Welcome!
Welcome to the Wyoming Labor Market Information website of the Wyoming Department of Workforce Services' Research & Planning section.
Research & Planning (R&P) is an exclusively statistical entity within the Wyoming Department of Workforce Services that collects, analyzes, and publishes timely and accurate labor market information (LMI) meeting established statistical standards.
Attention Wyoming Labor Force Trends Subscribers
Research & Planning has moved to an all-electronic format for Wyoming Labor Force Trends. If you would like to receive Trends electronically but are not currently doing so, please contact R&P Research Supervisor Michael Moore at michael.moore@wyo.gov or (307) 473-3814.
Weekly Unemployment Insurance Claims for Wyoming
Weekly Unemployment Insurance Claims for Wyoming by County of Residence, Industry, and Selected Demographics, 2019-2026
Weekly UI Claims Data Table of Contents
Updated June 18, 2026, for the week ending June 13, 2026.
Wyoming Long-Term Industry and Occupational Projections, 2024-2034
Wyoming is projected to add nearly 28,000 new jobs over the next 10 years, according to the newest long-term industry and occupational employment projections. These new projections feature more user-friendly tables with sorting and search functions.
2024-2034 Long-Term Industry and Occupational Projections home (HTML)
Published June 17, 2026.
Wyoming Unemployment Insurance Claims Report, May 2026
The number of initial and continued Unemployment Insurance (UI) claims in Wyoming increased slightly over the year, but declined substantially over the month as warm summer months brought more jobs.
There were 1,200 initial claims in May 2026, up from 1,190 (10, or 0.8%) in May 2025. Over the month, initial claims fell by 455 (-27.5%).
There were 8,904 total continued weeks claimed in May 2026, down 1,921 (-17.7%) over the month. There were 3,210 unique claimants, down 196 (-5.8%) over the month. The total number of continued weeks claimed and total claimants were largely unchanged over the year.
The May 2026 Unemployment Insurance claims report also provides detailed information on initial and continued claims at the industry and county levels.
May 2026 UI Claims Report
Published June 16, 2026.
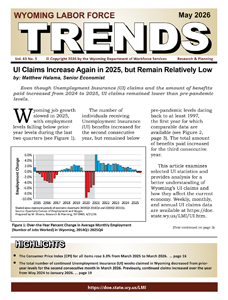
- UI Claims Increase Again in 2025, but
Remain Relatively Low
- Wyoming Unemployment Rate Steady
at 3.6% in March 2026
- Current Employment Statistics (CES) Estimates and Research & Planning’s
Internal Estimates, March 2026
- State Unemployment Rates (Seasonally
Adjusted)
- Wyoming Nonagricultural Wage and
Salary Employment
- State Unemployment Rates (Not
Seasonally Adjusted)
- Economic Indicators
- County Unemployment Rates
- Wyoming Normalized Unemployment
Insurance Statistics: Initial Claims
- Wyoming Normalized Unemployment
Insurance Statistics: Continued Claims
Occupational Employment and Wage Statistics (OEWS) in Wyoming
NEW: Statewide, Regional, County, and MSA Data (estimates for Wyoming wages for May 2025 data updated to the March 2026 ECI Employment Cost Index).
Wyoming Wage Survey
Published June 2026.
Wyoming Unemployment Rate Falls to 3.5% in April 2026
The Research & Planning section of the Wyoming Department of Workforce Services reported that the state’s seasonally adjusted unemployment rate fell slightly from 3.6% in March to 3.5% in April. Wyoming’s unemployment rate was modestly higher than its year-earlier level of 3.2%, but considerably lower than the current U.S. rate of 4.3%.
Current Employment Statistics (CES) estimates show that total nonfarm employment in Wyoming (not seasonally adjusted and measured by place of work) rose from 290,300 in April 2025 to 291,600 in April 2026, an increase of 1,300 jobs (0.4%).
Current News Release | News Release Archive | Latest Local Area Unemployment Statistics | News Release Schedule
Published May 26, 2026.
Growing and Declining Industries in Wyoming, 2025Q3
In third quarter 2025 (2025Q3), Wyoming had eight growing industries and six declining industries. This marked the third consecutive quarter that Wyoming had more growing industries than declining.
Growing industries included
support activities for transportation, warehousing & storage, pipeline transportation, and food manufacturing.
Declining industries included
sporting goods, hobby, musical instrument, book, & miscellaneous retailers; machinery manufacturing; and beverage & tobacco product manufacturing.
2025Q3 Report
Growing and declining industries home
Updated May 13, 2026.
Wage Records in Wyoming
Demographics and Earnings of Persons Working in Wyoming by County, Industry, Age, & Sex, 2000-2025
Table of Contents
Published May 11, 2026.
Modest Job Losses in Third Quarter 2025
From third quarter 2024 to third quarter 2025, total employment in the state fell by 1,320 jobs (-0.5%), but
total payroll rose by $66.1 million (1.5%). Employment rose in nine counties and fell in 14 counties. Total
payroll increased in 17 counties and decreased in six counties.
News Release | 2025Q3 Data | Summary Statistics by Industry | Summary Statistics by County
Published May 7, 2026.
Wyoming Short-Term Industry and Occupational Projections, 2025-2027
Wyoming is projected to add more than 6,000 jobs over the next two years, according to new short-term industry and occupational projections.
2025-2027 Short-Term Industry and Occupational Projections home (HTML)
Full publication (PDF)
Published March 23, 2026.
Wyoming Occupational Fatalities Decrease to 37 in 2024
News Release | Tables and Figures | CFOI Main Page
The number of occupational fatalities in Wyoming decreased from 45 in 2023 to 37 in 2024 (a decrease of 8 deaths, or 17.8%). Variations in fatalities from year to year are, to some extent, the result of the random nature of work-related accidents. Furthermore, there is not always a direct relationship between workplace fatalities and workplace safety. For example, suicides and homicides that occur in the workplace are included as occupational fatalities. Workplace fatalities are counted in the state where the injury occurred, not necessarily the state of residence or the state of death.
Across all industries, more than half of 2024 workplace deaths (51.4%) were the result of transportation incidents. Transportation incidents include highway crashes, pedestrian vehicular incidents, aircraft incidents, and water vehicle incidents.
Published February 19, 2026.
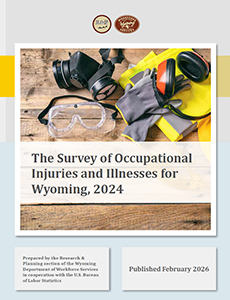
Survey of Occupational Injuries and Illnesses
Wyoming’s nonfatal occupational injury and illness incidence rate for all industries in 2023 was 2.7, according to the Survey of Occupational Injuries and Illnesses (SOII). Incidence rates represent the number of injuries and illnesses per 100 full-time workers.
This publication is intended to introduce the reader to the data available for Wyoming from the Survey of Occupational Injuries and Illnesses.
Published February 2026.
Wyoming Turnover Data, 1993Q1 to 2025Q2
Wyoming's turnover rate for second quarter 2025 (2025Q2) was 31.2%, essentially unchanged over the year.
Tables and Figures
Published January 28, 2026.
In-Demand Occupations for Wyoming
The Research & Planning (R&P) section of the Wyoming Department of Workforce Services, in partnership with the Wyoming Workforce Development Council, has published a list of in-demand occupations for Wyoming.
Click here to see the full list of 62 in-demand occupations for Wyoming.
Updated January 29, 2026.
New Labor Market Information Presentations
Research & Planning provides labor market information presentations to government entities, community groups, educators, training providers, and others free of charge. If you would like to discuss a presentation, please contact R&P Research Supervisor Michael Moore at michael.moore@wyo.gov or (307) 473-3814.
Recently added presentations include the following:
Women in Wyoming's Labor Market. Presented to the Wyoming Workforce Development Council on January 15, 2026, and to the Wyoming Council for Women on January 20, 2026, by Michael Moore,
R&P Research Supervisor.
Youth in Wyoming and its Labor Market. Presented to the Wyoming Workforce Development Council on November 6, 2025, by Michael Moore, R&P Research Supervisor.
Inside the 2025 Wyoming Workforce Annual Report. Presented to the Wyoming Workforce Development Council on September 4, 2025, by Michael Moore, R&P Research Supervisor.
Labor Market Information 101. Presented to the Wyoming Vocational Rehabilitation Managers’ Meeting, August 13, 2025, by Michael Moore, R&P Research Supervisor.
All presentations are available by clicking here.
Updated January 21, 2026.
2025 Directory of Licensed Occupations in Wyoming
The 2025 Directory of Licensed Occupations in Wyoming, compiled by the Research & Planning (R&P) section of the Wyoming Department of Workforce Services, provides detailed information about license requirements and related information for the 98 occupations required to have a license by the state of Wyoming. Forty-five licensing boards oversee the administration and enforcement of these licenses.
Requiring practitioners of some occupations to be licensed results in the assurance that these workers have a minimum level of education and competency, and also generally results in higher wages for workers in those occupations compared to those in many unlicensed occupations.
Published December 2025.
PDF (2.7 MB)
List of Licensed Occupations
Long-Term Employment Projections for Occupations Requiring Licensure in Wyoming, 2022-2032 (Statewide and Substate)
Wyoming Long-Term Sub-State Occupational Projections, 2022-2032
Sub-state Projections
Published December 2025.
NEW! Annual Report
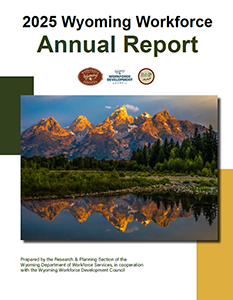
Welcome to the 2025 edition of the Wyoming Workforce Annual Report, produced by the Research & Planning (R&P) section of the Wyoming Department of Workforce Services in partnership with the Wyoming Workforce Development Council. This report provides an overview of Wyoming’s economy and workforce. Chapters in this report include:
- Continued Growth in Wyoming's Labor
Market in 2024
- Construction Drives Wyoming Job
Growth in 2024
- Population Growth Continues for
4th Straight Year
- Wyoming Labor Force Hits 8-Year
High in 2024
- Wyoming UI Claims Up, But Still Lower
than Usual in 2024
- Small Increase in Persons Working in
Wyoming in 2024
- Wyoming Women Had Higher Education
than Men in 2023
- Wyoming Projected to Add 35,000 Jobs
in the Next 10 Years
- Wyoming Projected to Outpace the
U.S. in STEM Job Growth
- Nearly Two-Thirds of Wyo Workers
Offered Medical Insurance
- Past and Projected Growth in Health
Care-Related Occupations
- Wyoming Occupational Fatalities
Increase to 45 in 2023
- Highlights of the 2023 SOII Survey
for Wyoming
- Just the Facts
Published June 25, 2025.
Wyoming Benefits Survey 2024
The Research & Planning (R&P) section of the Wyoming Department of Workforce Services conducts the Wyoming Benefits Survey on a quarterly basis. This survey is designed to collect information about the types of benefits Wyoming employers offer their employees.
This publication examines the prevalence of employer-provided benefits such as health insurance, retirement plans, and paid leave in Wyoming during first quarter 2022. These benefits are analyzed in several ways: by full- and part-time employment status, employer size class, industry, and by Wyoming substate region.
PDF (3.4 MB)
Published August 2025.
Quarterly Census of Employment and Wages for Wyoming, 2024 Annual Averages
Wyoming's average monthly employment in 2024 was 281,904, an over-the-year increase of 3,156 jobs, or 1.1%. Wyoming had $17.4 billion in total wages, a record high and an over-the-year increase of $892.6 million, or 5.4%. The state's average annual wage was $61,586, up $2,505 (4.2%) compared to 2023.
Table of Contents
Published May 20, 2025.
Science, Technology, Engineering, and Mathematics (STEM) Occupations
List of STEM occupations and long-term projections for STEM occupations in Wyoming and the U.S., 2022-2032.
Updated March 11, 2025.
NEW! Licensed Health Care Occupation Data for Individuals Working in Wyoming, 2023Q1
These tables provide detailed information on licensed individuals working in Wyoming, including employment by region, age, and Sex.
Table of Contents (HTML)
Published October 2023.
In 2020, Wyoming employers added an estimated 79,650 new hires: individuals who, during a particular quarter, started working for an employer he or she had not worked for since at least 1992, the first year for which R&P has wage records.
The New Hires Survey allows R&P to collect rich survey detail not previously available, such as occupation, rate of compensation, benefits, important job skills, employer satisfaction with a new hire’s skills, retention, and more. By linking New Hires Survey data to existing administrative databases, such as Unemployment Insurance Wage Records and Wyoming Department of Transportation driver’s license files, R&P is also able to identify new hires characteristics such as age and Sex.
Published June 29, 2022.
How the Global Pandemic Affected Wyoming Workers
Using survey data collected through the U.S. Bureau of Labor Statistics' Current Population Survey (CPS), this new report from the Research & Planning (R&P) section of the Wyoming Department of Workforce Services looks at how the global pandemic impacted workers in Wyoming and the U.S.
Topics covered in this report include:
- The number of individuals who were able to work remotely
- How many people were unable to work
- Whether employees received pay for hours not worked
- If the pandemic prevent individuals from looking for work
- And more
Published March 23, 2022.
A new publication from the Research & Planning (R&P) section of the Wyoming Department of Workforce Services demonstrates R&P's ability to track Wyoming high school seniors into post-secondary education and the labor market.
The senior cohort for the academic year 2006/07 was used as an example throughout the publication. Key findings showed that 10 years after their senior year:
- 78.7% had attended either college or a university
- 39.8% earned a post-secondary award (certificate or degree)
- 49.2% were found working in Wyoming
Published September 29, 2021.
New from R&P: Postsecondary Education Employment Outcomes Interactive Graphics
New postsecondary education employment outcomes data for graduates of Wyoming community colleges and the University of Wyoming are now available online by clicking here.
For more information on how to navigate these interactive Tableau graphics, please see this article in Wyoming Labor Force Trends.
Published November 9, 2020.
Wyoming Youth and Populations with Barriers to Employment:
Supporting Tables and Figures for Wyoming’s Workforce Innovation and Opportunity Act Annual Performance Report, FY 2019
This report, prepared by the Research & Planning section of the Wyoming Department of Workforce Services, serves as supporting documentation for Wyoming’s Workforce Innovation and Opportunity Act Annual Report for Program Year 2019. The primary focus of this report is Wyoming youth, which is defined for these purposes as individuals ages 15-24, and other populations with barriers to employment, such as homeless, English language learners, veterans, and others.
WIOA Report (PDF)
Workforce Innovation and Opportunity Act for Wyoming
Published September 29, 2020.
 Hire Wyo