Wyoming Labor Force Trends
October 2026 | Volume 63, No. 10
Click Here for PDF
Return to Table of Contents
What Do Electricity Sales Data Reveal About Wyoming’s Economy?
by: David Bullard, Senior Economist
Electricity sales can be divided into three broad categories: residential, commercial, and industrial. The industrial sector is closely tied to Wyoming's mining industry, and is the largest consumer of electricity in the state. However, from 1990 to 2025, its consumption grew at the slowest pace, and its share of electricity sales fell dramatically. The commercial sector is the second largest user of electricity in Wyoming, and its consumption grew at the fastest pace, more than doubling from 1990 to 2025. The residential sector is the smallest of the three sectors and its consumption growth fell in the middle of the other two sectors. This article also compares electricity sales trends in Wyoming to the U.S.
The U.S. Energy Information Administration (EIA) publishes data on electricity sales by major sector for the U.S. and all 50 states. Data are available on a monthly and annual basis. This article reviews electricity sales for Wyoming and the U.S. from 1990 to 2025 and compares them to selected employment series.
The three main categories of electricity sales are residential, commercial, and industrial. According to EIA (2026), “the residential sector includes homes and apartments. The commercial sector includes offices, malls, stores, schools, hospitals, hotels, warehouses, restaurants, and places of worship and public assembly. The industrial sector includes facilities and equipment used for manufacturing, agriculture, mining, and construction." Transportation makes up a very small proportion of retail electricity sales (less than one percent). It is not published separately for Wyoming, but it is published for the U.S.
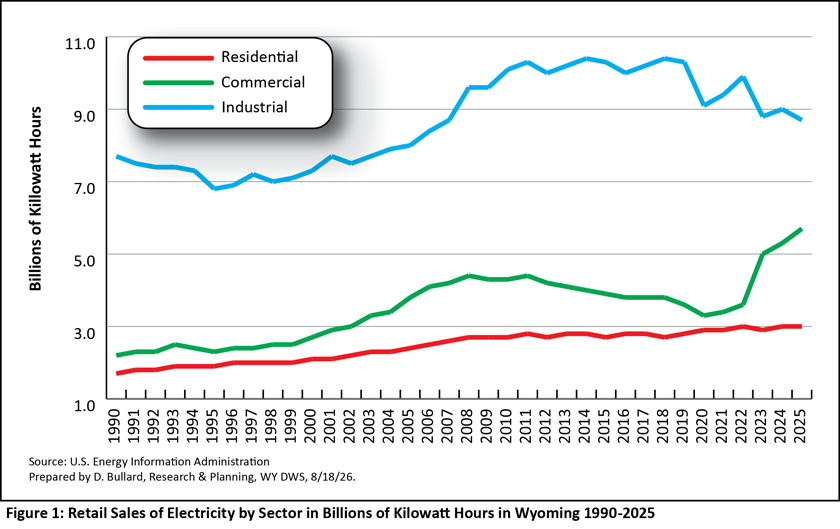
Figure 1 shows retail sales for electricity for the three main sectors for Wyoming from 1990 to 2025. Several things stand out. First, the industrial sector uses much more electricity than the residential and commercial sectors. This is likely due to the large size of Wyoming’s mining sector. Second, electricity usage in the industrial sector peaked in 2014 at 10.4 billion kilowatt hours and eventually declined to 8.7 billion kilowatt hours in 2025. Third, electricity sales increased in all three sectors from 1990 to 2025. The commercial sector had the largest increase (3.5 billion kilowatt hours, or 161.2%). It was followed by the residential sector (1.2 billion kilowatt hours, or 71.8%) and the industrial sector (1.0 billion kilowatt hours, or 12.5%).
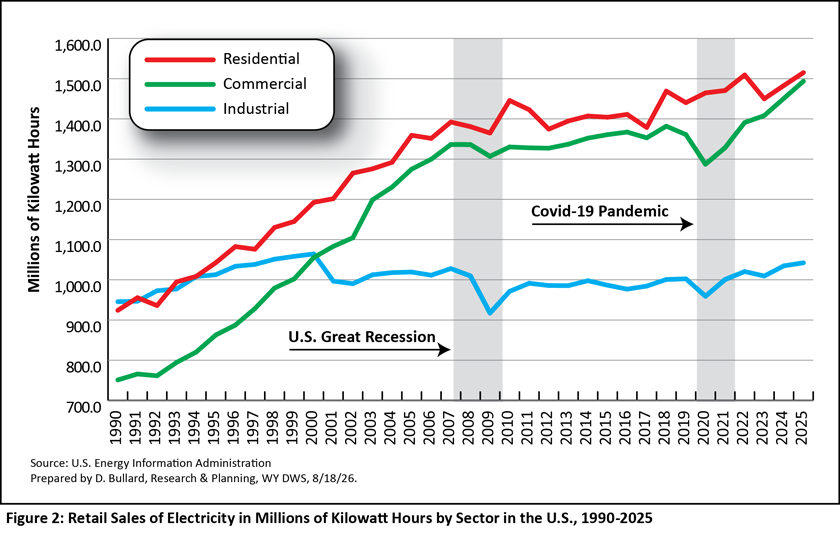
Figure 2 shows electricity sales for the United States. Interestingly, for the U.S. as a whole, the residential sector is the largest user of electricity, while in Wyoming it is the smallest sector.
In the U.S. data, the Great Recession is clearly seen as a dip in electricity sales to the industrial sector in 2009, and the pandemic recession is seen as another dip in 2020. These recessions also affected the commercial sector with decreases in 2009 and 2020.
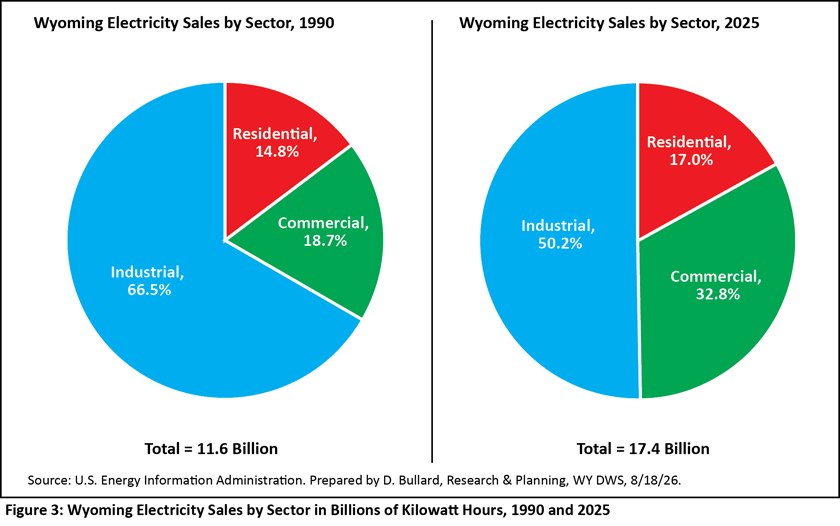
Figure 3 presents some of the same data in a different format. From these pie charts, it is apparent that from 1990 to 2025, Wyoming’s industrial sector made up a smaller part of electricity sales (falling from 66.5% to 50.2%). The residential sector increased its share of sales slightly from 14.8% to 17.0%, while the commercial sector rose more prominently from 18.7% to 32.8%.
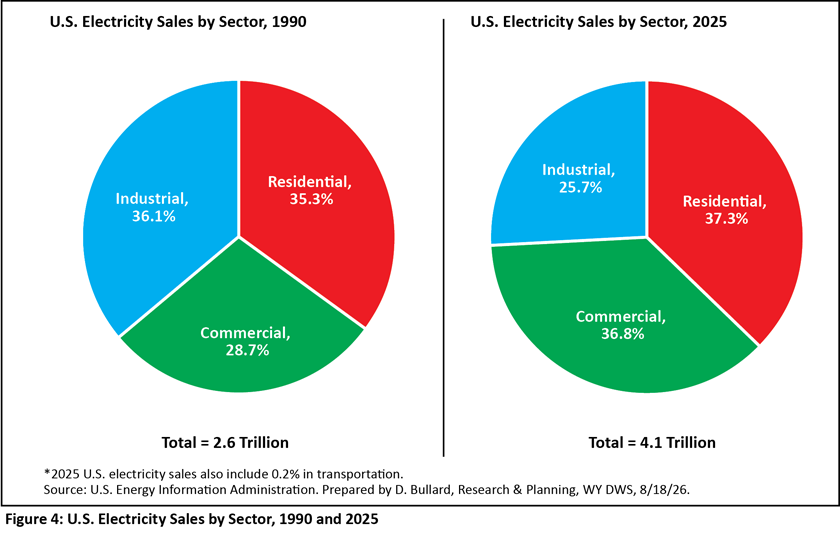
U.S. data (seen in Figure 4) shows a similar pattern. The residential sector increased slightly from 35.3% to 37.3% from 1990 to 2025, while the industrial sector fell from 36.1% to 25.7%, and the commercial sector grew from 28.7% to 36.8%. Decreasing electricity sales to the industrial sector is consistent with falling manufacturing employment in the U.S. (down 5.1 million jobs, or 28.6%, from 1990 to 2025). The shifts seen in Figures 3 and 4 seem to underscore the gradual transition of both the U.S. and Wyoming away from goods-producing toward more services-based economies.
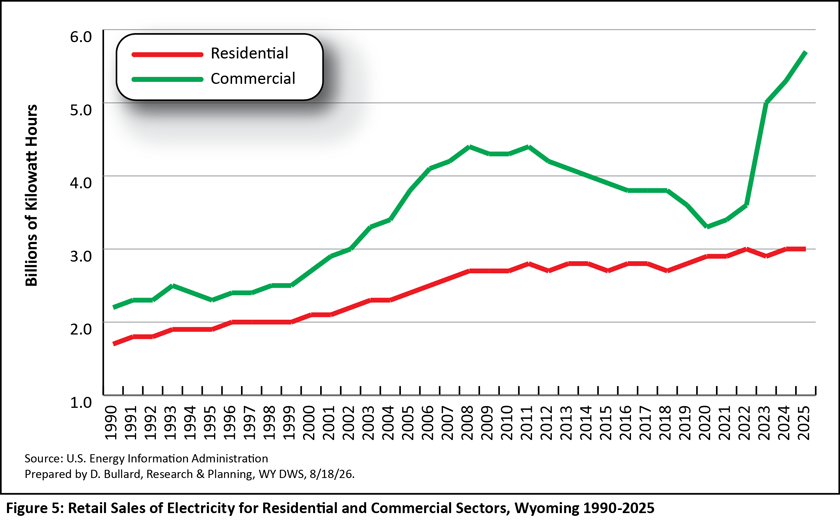
Figure 5 is similar to Figure 1, except the industrial sector is excluded. This allows for a closer look at trends in the residential and commercial sectors. Here it is clear that electricity sales to the commercial sector increased sharply from 2022 to 2023 (up 39.7%) and then increased further in 2024 and 2025. This has led some analysts to wonder whether the recent increases in electricity sales to the commercial sector are related to data centers opening in the state.
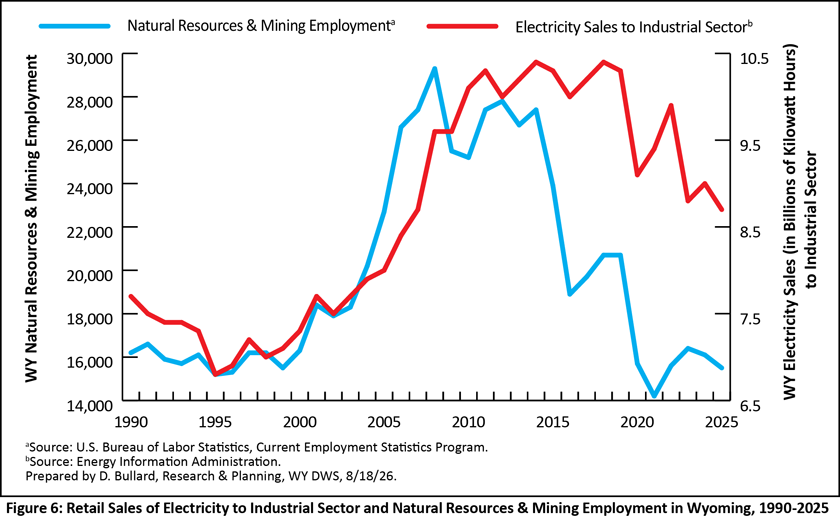
Figure 6 illustrates the relationship between electricity sales to the industrial sector in Wyoming and natural resources & mining employment in the state. Employment nearly doubled from 15,500 jobs in 1999 to 29,300 jobs in 2008, while electricity sales rose rapidly over the same period. Later, as employment fell from 27,400 jobs in 2014 to 15,500 jobs in 2025, electricity sales decreased from their 2014 peak of 10.4 billion kilowatt hours to 8.7 billion kilowatt hours in 2025.
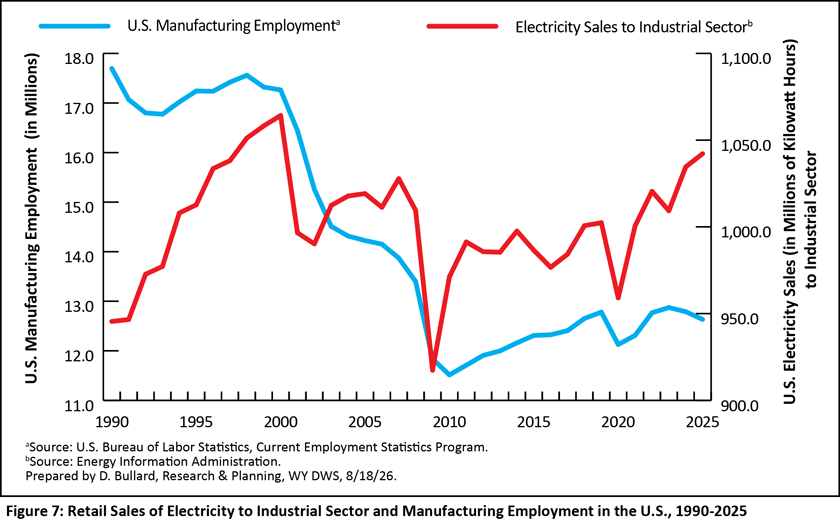
U.S. data for electricity sales to the industrial sector are shown in Figure 7 along with U.S. manufacturing employment. From a peak in 2000, U.S. electricity sales fell to a low point in 2009. Manufacturing employment fell steadily from 1998 to 2010. While electricity sales rebounded somewhat from their 2009 low point, employment only increased marginally. Rising output per worker, or in other words, higher productivity, may help explain weak employment growth in the U.S. manufacturing sector.
Conclusions
What are some key takeaways from the electricity sales data for Wyoming and the U.S.? First, compared to the U.S., Wyoming’s industrial sector consumes a much larger share of electricity (50.2% in Wyoming and 25.7% in the U.S. in 2025). This is likely due to the large size of Wyoming’s mining sector. Additionally, electricity sales to Wyoming’s industrial sector appear correlated with natural resources & mining employment. When employment decreases, electricity sales tend to decrease as well.
In both the U.S. and Wyoming, sales of electricity to the industrial sector have been growing at a much slower pace than sales to the residential and commercial sectors. In Wyoming, electricity sales to the commercial sector increased sharply in 2023 and then continued to increase in 2024 and 2025. It is possible that this increase was related to data centers opening in the state.
References
U.S. Energy Information Administration. (n.d.). Energy use basics. Retrieved June 30, 2026, from https://www.eia.gov/kids/using-and-saving-energy/energy-use-basics.php

 Hire Wyo