Wyoming Labor Force Trends
October 2023 | Volume 60, No. 10
Click Here for PDF
Return to Table of Contents
2023Q1 Quarterly Update
Wyoming Employment Returns to Pre-Pandemic Levels
by: Michael Moore, Research Supervisor
This article provides an overview of Wyoming’s employment and wages in first quarter 2023, as the state saw over-the-year increases in employment and wages for the eighth consecutive quarter. The data presented in this article are from the Quarterly Census of Employment and Wages, available online at https://doe.state.wy.us/LMI/toc_202.htm.
Wyoming added more than 6,300 jobs and $386.8 million in total wages over the year in first quarter 2023 (2023Q1; see Table 1). This marked the eighth consecutive quarter of over-the-year job growth, and the first time Wyoming returned to pre-pandemic employment levels.
In this article, data from 2023Q1 are compared to data from the prior year at the industry and county levels. The purpose of this article is gain a better understanding of how Wyoming's labor market has changed in recent years, particularly since the Covid-19 pandemic and the state's most recent economic downturn.
The data in this article are from the Quarterly Census of Employment and Wages (QCEW). Data from 2023Q1 are available at https://doe.state.wy.us/LMI/23Q1_QCEW/toc.htm.
Introduction
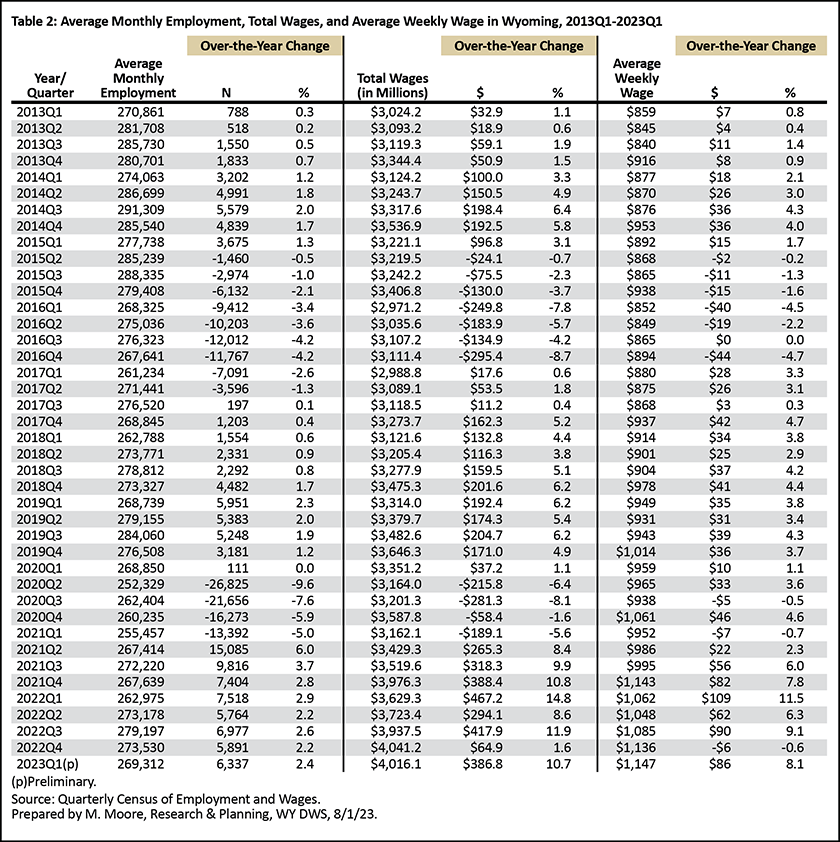
Wyoming’s average monthly employment in 2023Q1 was 269,312, an increase of 6,337 jobs (2.4%) compared to 2022Q1 (see Table 2). The state had $4.0 billion in total wages, up $386.8 million (10.7%) over the year. Wyoming's average weekly wage increased from $1,062 to $1,147 ($86, or 8.1%).
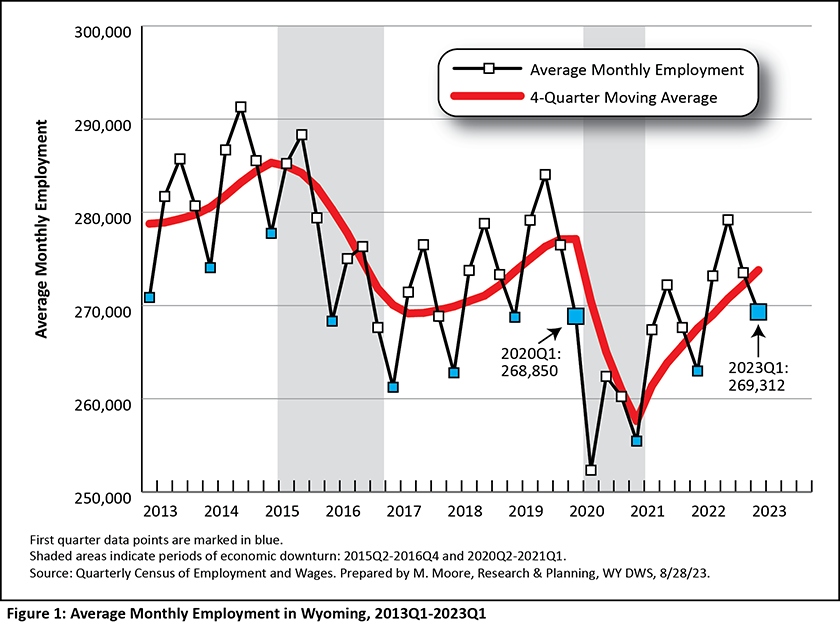
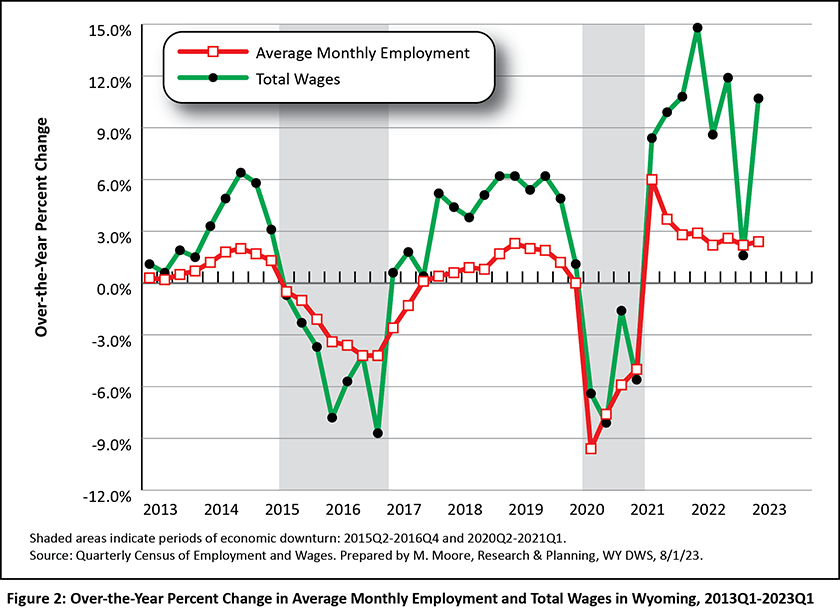
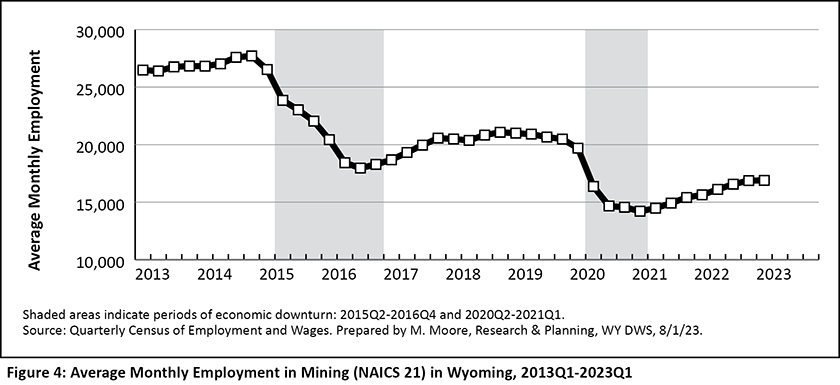
Wyoming employment is typically lowest during the first quarter of each year (see Figure 1). The shaded areas in Figure 1 and Figure 2 and other figures in this article represent periods of economic downturn. The Research & Planning (R&P) section of the Wyoming Department of Workforce Services has defined an economic downturn as a period of at least two consecutive quarters of over-the-year decreases in average monthly employment and total wages based on data from the QCEW. Wyoming has endured three such economic downturns since 2009: 2009Q1 to 2010Q1, 2015Q2 to 2016Q4, and 2020Q2 to 2021Q1.
Wyoming’s most recent downturn was influenced by the COVID-19 pandemic and declines in the prices of and demand for the state’s energy resources. While each downturn had its own unique circumstances, declining energy prices preceded all three (Moore, 2019).
As previously mentioned, 2023Q1 marked the first time Wyoming has returned to pre-pandemic employment levels. The state's average monthly employment of 269,312 was slightly higher than the 268,739 in 2019Q1 and 268,850 in 2020Q1, just prior to the start of the pandemic.
Industry
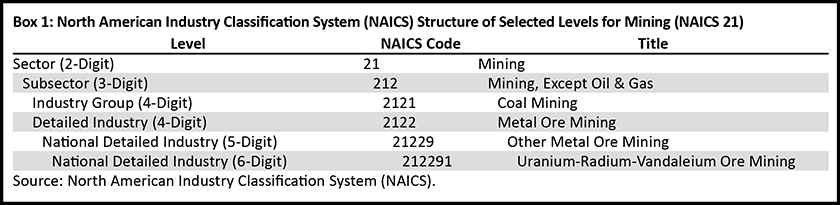
Industries are organized by the North American Industry Classification System (NAICS). A sample of the NAICS hierarchal structure for mining (NAICS 21) can be found in Box 1.
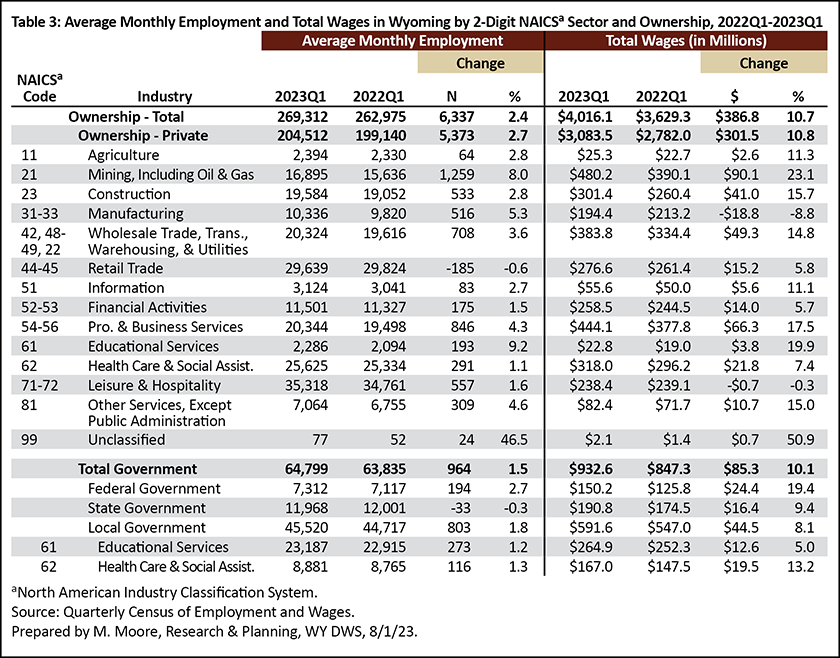
Table 3 shows employment and wages at the two-digit sector level. Nearly all industries showed substantial over-the-year employment gains, led by mining, including oil & gas (1,259 more jobs, or 8.0%), professional & business services (846, or 4.3%), leisure & hospitality (557, or 1.6%), and construction (533, or 2.8%). Retail trade was the only private industry with a decrease in average monthly employment (-185, or -0.6%).
Local government added 803 jobs (1.8%) and federal government added 194 (2.7%). State government declined by 33 jobs, or 0.3%.
This article provides detailed employment and wage information on Wyoming's mining, construction, and information sectors. Mining and construction are both key contributors to Wyoming's economy. While information makes up a small part of the state's total employment, it's worth noting this industry has seen continued growth in recent quarters, after many years of job losses.
Similar tables and figures are available for each industry at https://doe.state.wy.us/LMI/QCEW_OTY/toc.htm.
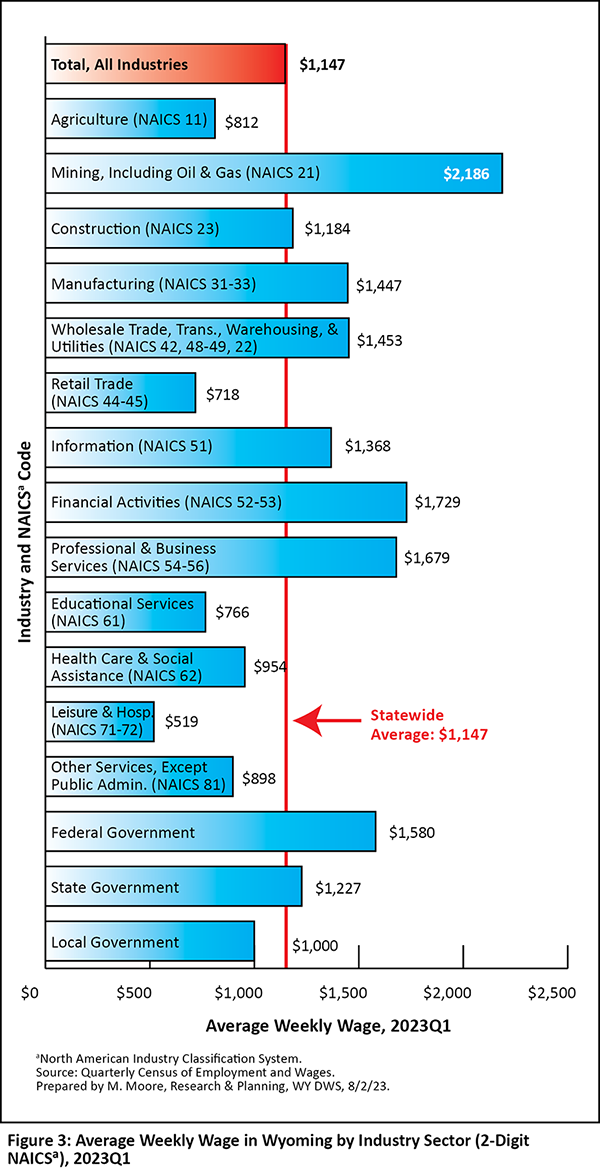
Across all industries, Wyoming's average weekly wage in 2023Q1 was $1,147 (see Figure 3). The highest weekly wages were found in mining, including oil & gas ($2,186), financial activities ($1,729), professional & business services ($1,679), and federal government ($1,580). The industries with the lowest average weekly wages were leisure & hospitality ($519), retail trade ($718), and private educational services ($766).
Mining, Including Oil & Gas (NAICS 21)
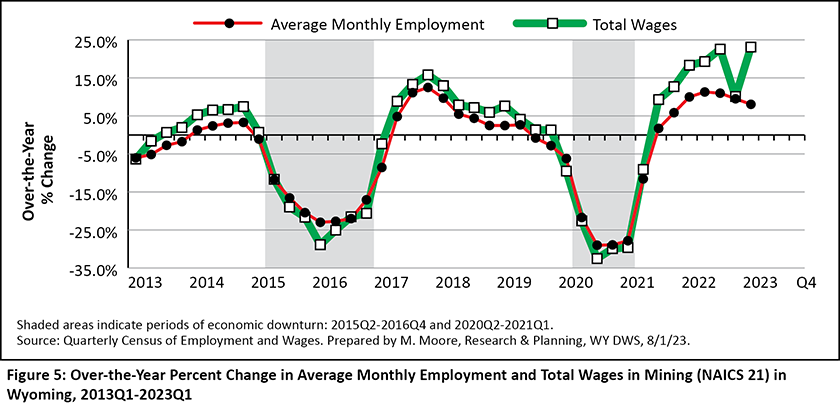
As previously mentioned, Wyoming's recent downturns were preceded by declining energy prices and driven by job losses in mining. While employment in Wyoming's mining sector has not returned to pre-pandemic levels, over-the-year job growth has been seen for seven consecutive quarters (see Figure 4 and Figure 5).
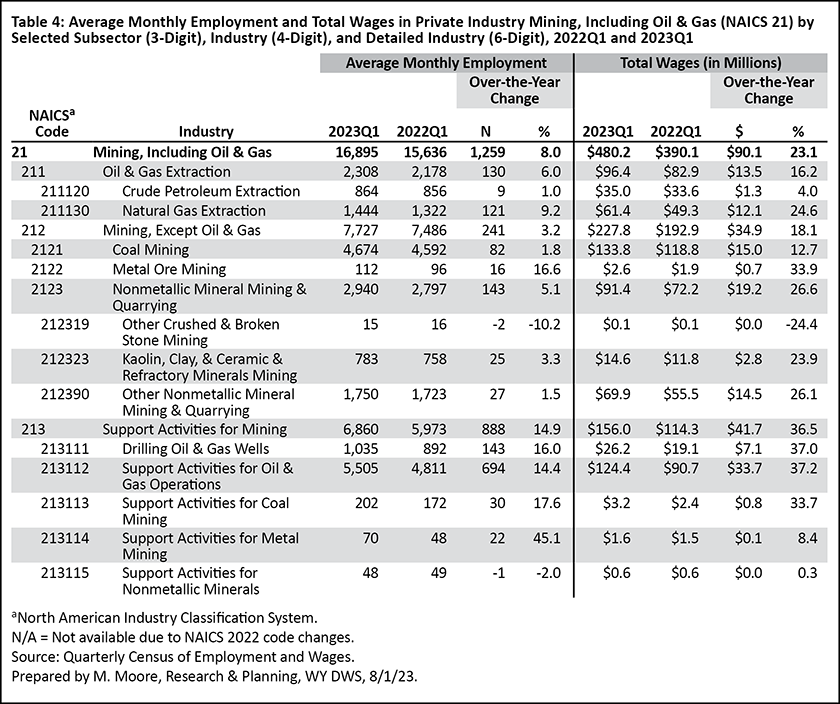
Wyoming's mining sector (NAICS 21) is comprised of three subsectors (see Table 4): oil & gas extraction (NAICS 211), mining, except oil & gas (NAICS 212), and support activities for mining (NAICS 213). All three subsectors added jobs from 2022Q1 to 2023Q1.
Overall, Wyoming's mining sector added 1,259 jobs from 2022Q1 to 2023Q1, an increase of 8.0%. Support activities for mining added the greatest number of jobs (888, or 14.9%) of the three subsectors. Within this subsector, the largest job growth occurred in support activities for oil & gas operations (694, or 14.4%), drilling oil & gas wells (143, or 16.0%), and support activities for coal mining (30, or 17.6%).
Mining, except oil & gas added 241 new jobs over the year, an increase of 3.2%. This subsector includes coal mining, which added 82 new jobs, an increase of 1.8%. This marked the fifth consecutive quarter of over-the-year job growth in coal mining. Nonmetallic mineral mining & quarrying added 143 jobs over the year, an increase of 5.1%.
Oil & gas extraction added 130 jobs over the year, a 6.0% increase. Job gains in this subsector were seen in both natural gas extraction and crude petroleum extraction.
Mining had $480.2 million in total wages in 2023Q1, 12.0% of the state's total wages and more than any other industry. Mining has historically contributed more wages to the statewide total than any other industry. For example, Bullard (2015) noted that in 2015Q1, mining paid 19.0% of the state's total wages, or approximately $1 of every $5 of total payroll.
However, total wages in mining have decreased substantially since the 2015-2016 economic downturn. Total wages in mining peaked at $637.4 million in 2014Q4, and fell to a decade low of $310.8 million in 2020Q3 (Research & Planning, 2023).
As previously mentioned, mining had the highest average weekly wage of all industries in 2022Q4 ($2,186 compared to $1,147 across all industries). High wages in mining have remained consistent over the last decade.
Construction (NAICS 23)
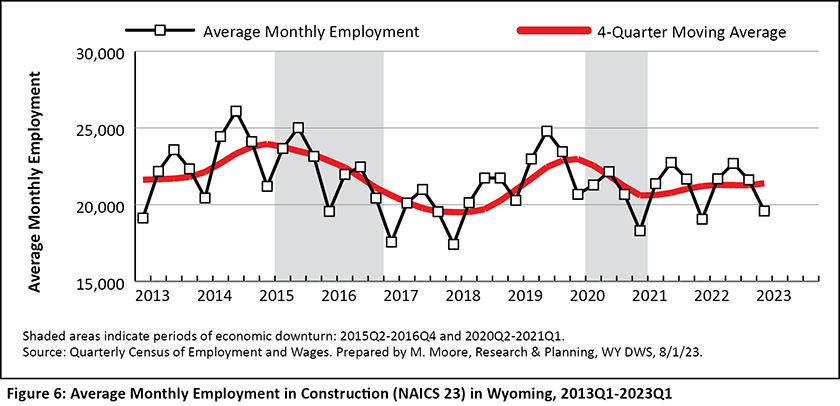
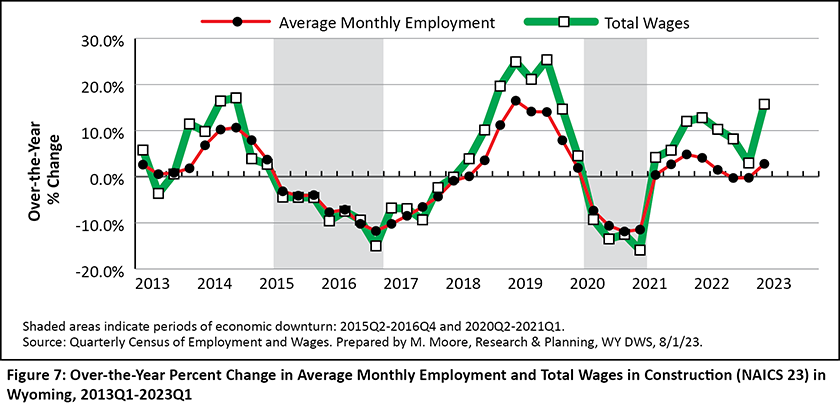
Wyoming's construction sector has seen moderate growth over the last two years, following substantial job losses during the most recent economic downturn (see Figure 6 and Figure 7).
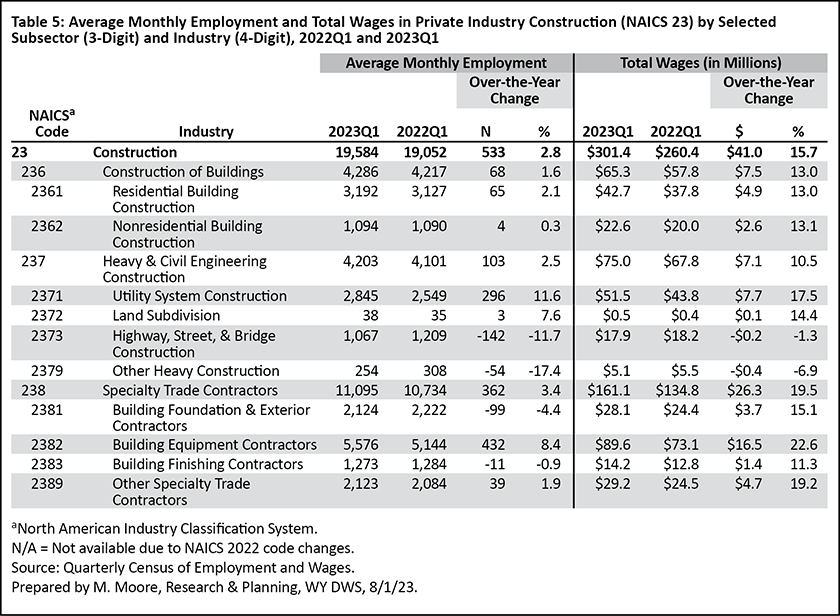
In 2023 there were 19,584 jobs in construction, up 2.8% (533 jobs) over the year (see Table 5). Construction accounted for 7.3% of all jobs in Wyoming. Construction is comprised of three subsectors: construction of buildings (NAICS 236), heavy & civil engineering construction (NAICS 237), and specialty trade contractors (NAICS 238).
At the subsector level, the greatest growth was seen in specialty trade contractors (362 jobs, or 3.4%), followed by heavy & civil engineering (103, or 2.5%) and construction of buildings (68, or 1.6%).
As illustrated in Figure 6, Wyoming's construction sector saw substantial employment growth from 2018 to 2019, followed by job losses during the most recent economic downturn. As noted by Moore (2022), construction growth prior to the pandemic was largely driven by temporary oil & gas pipeline construction jobs. Since the pandemic, however, moderate growth in construction has been due more to job gains in specialty trade contractors and construction of buildings.
Construction had $301.4 million in total wages in 2023Q1, up $41.0 million (15.7%) over the year. Construction contributed 7.5% of the state's total wages in 2023Q1.
Information (NAICS 51)
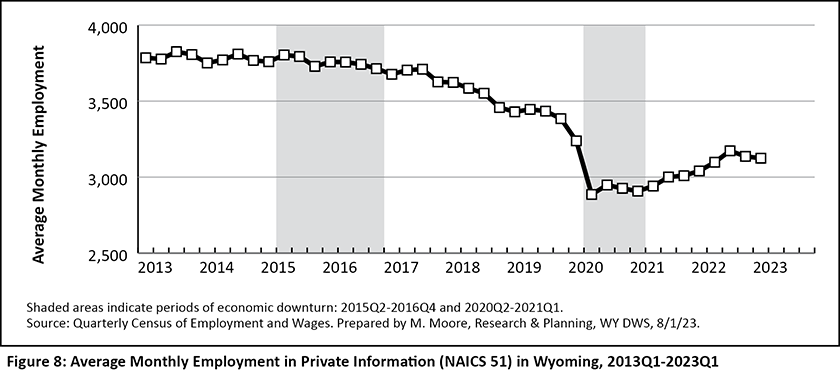
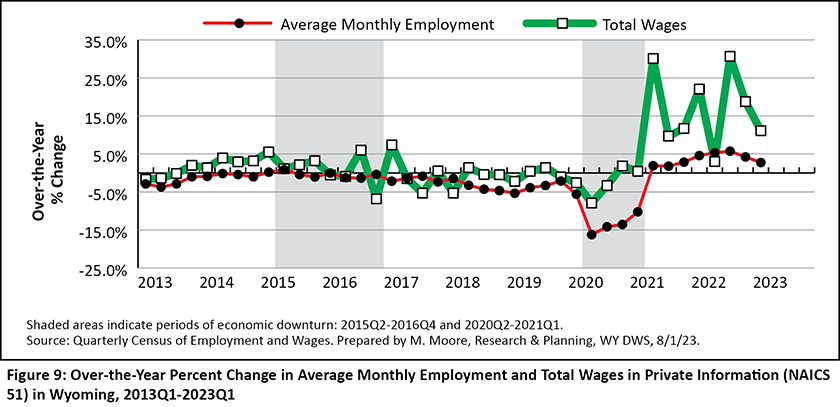
Employment in Wyoming's information sector declined moderately from 2013 to 2019 and then saw substantial job losses during the most recent economic downturn (see Figure 8 and Figure 9). Since 2021Q2, however, information has seen eight consecutive quarters of steady over-the-year job growth.
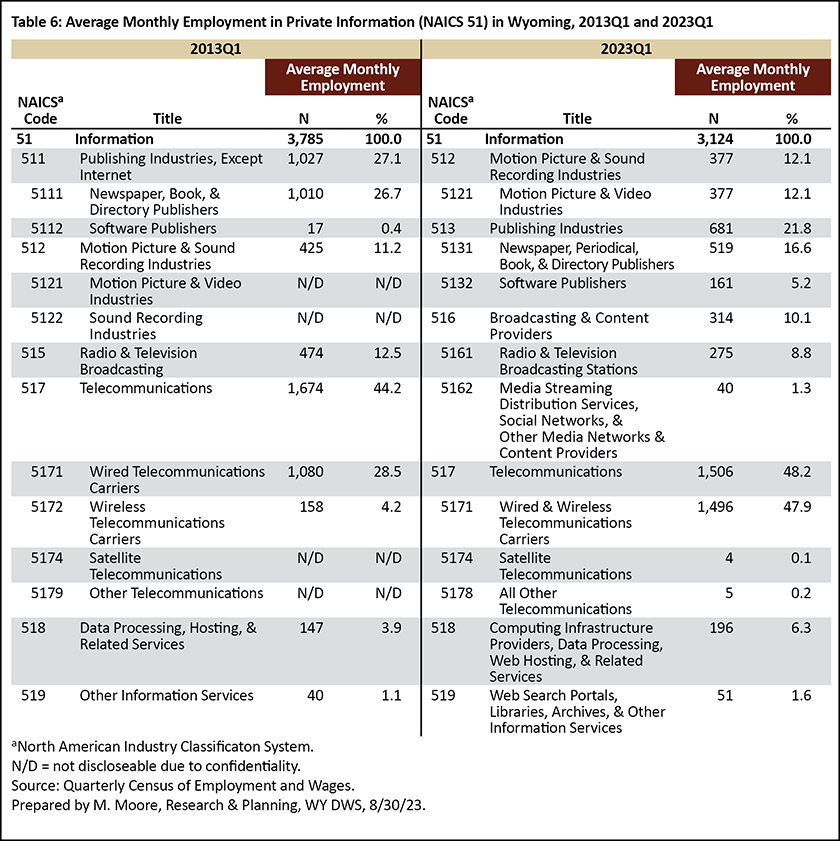
The growth in Wyoming's information sector is due in part to changes in technology and NAICS coding. In 2013Q1, for example, employment in information in Wyoming was distributed across six subsectors: publishing industries, except internet (27.1% of employment in information), motion picture & sound recording industries (11.2%), radio & television broadcasting (12.5%), telecommunications (44.2%), data processing, hosting, & relating services (3.9%), and other information services (1.1%; see Table 6).
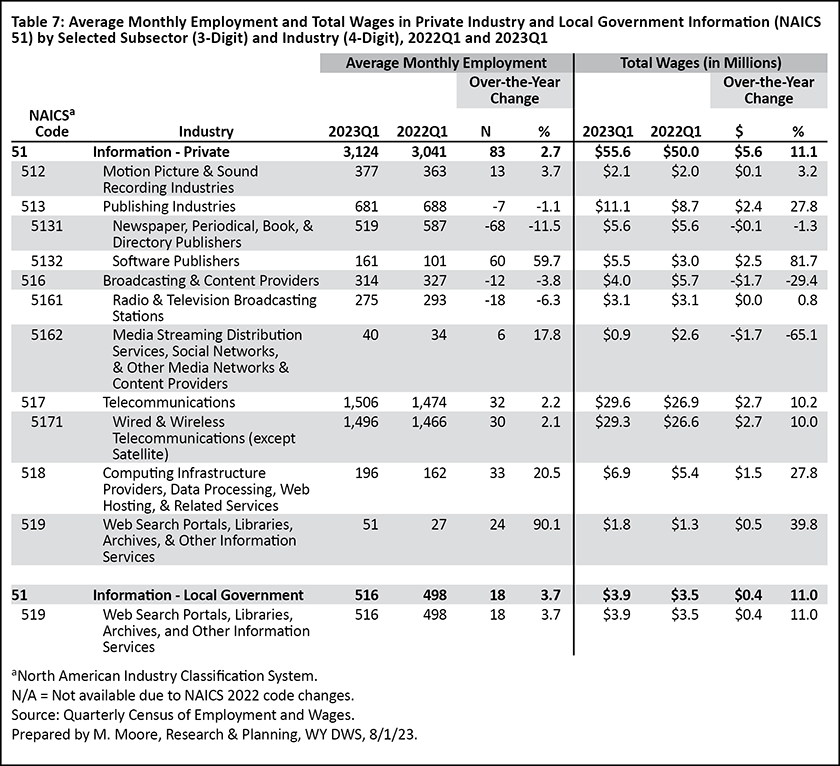
With the most recent NAICS changes in 2022, employment in information was found across six subsectors in 2023Q1: motion picture & sound recording industries (12.1%), publishing industries (21.8%), broadcasting & content providers (10.1%), telecommunications (48.2%), computing infrastructure providers, data processing, web hosting, & related services (6.3%), and web search portals, libraries, archives, & other information services (1.6%).
The impact of technological changes can be seen in the four-digit industry level as well. For example, in 2013, newspaper, book, & directory publishers were given the NAICS code 5111, with 1,010 total jobs. In 2023, the similar industry was classified as newspaper, periodical, book, & directory publishers (NAICS 5131), with 519 jobs, approximately half as many.
In 2023Q1, Wyoming's private information sector had 3,124 jobs, an over-the-year increase of 83, or 2.7% (see Table 7). Information accounted for just 1.2% of Wyoming's total employment in 2023Q1. Subsectors that saw over-the-year job growth included computer infrastructure providers, data processing, web hosting, & related services (33, or 20.5%), telecommunications (32, or 2.2%), and web search portals, libraries, archives, & other information services (24, or 90.1%).
Wyoming's private information sector had $55.6 million in total wages in 2023Q1, or 1.4% of the state's total wages.
County
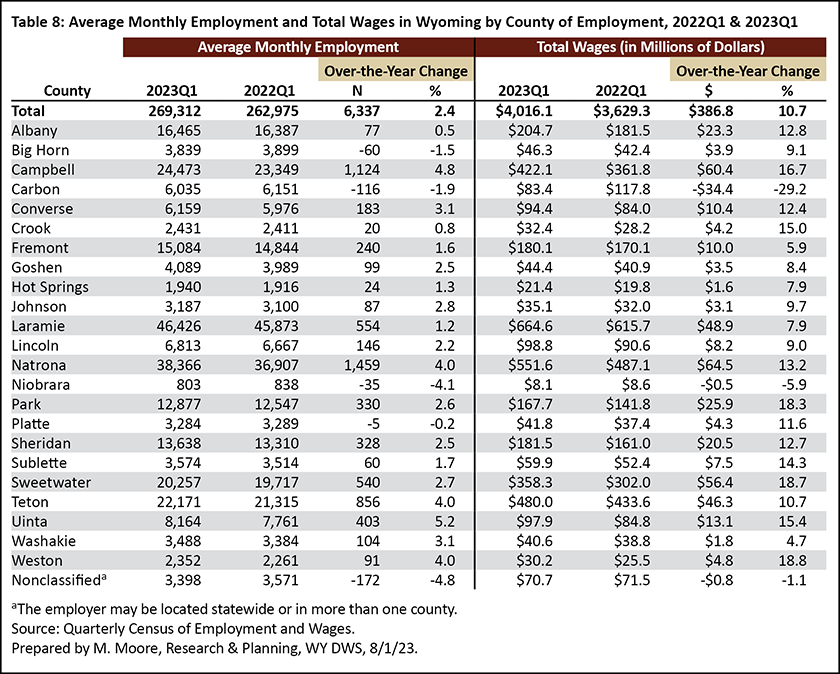
All but four of Wyoming's 23 counties experienced over the-year job growth in 2023Q1 (see Table 8). Natrona County added the greatest number of jobs (1,459, or 4.0%), followed by Campbell (1,124, or 4.8%), Teton (856, or 4.0%), and Laramie (554, or 1.2%) counties. Carbon County saw the greatest over-the-year job losses (-116, or -1.9%), followed by Big Horn (-60, or -1.5%) and Niobrara (-35, or -4.1%) counties.
Natrona County also saw the greatest increase in total wages ($64.5 million, or 13.2%), followed by Campbell ($60.4 million, or 16.7%), Laramie ($48.9 million, or 7.9%), and Teton ($46.3 million, or 10.7%) counties. Only Carbon (-$34.4 million, or -29.2%) and Niobrara (-$503,750, or -5.9%) saw over-the-year decreases in total wages.
Pre-Pandemic Data
As previously mentioned, 2023Q1 marked the first time Wyoming employment returned to pre-pandemic levels. The state's average monthly employment increased from 268,850 in 2020Q1 (just prior to the start of the pandemic) to 269,312 in 2023Q1 (462 new jobs, or 0.2%).
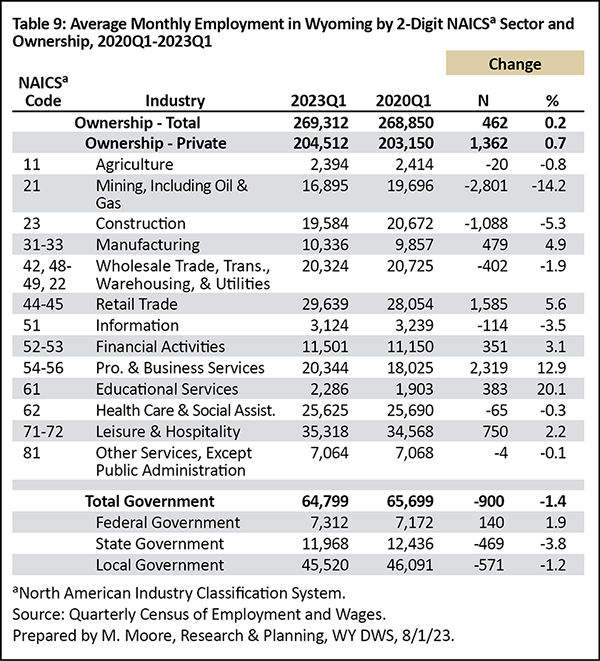
As shown in Table 9, the industries that returned to or surpassed pre-pandemic employment included professional & business services (2,319 new jobs, or 12.9%), retail trade (1,585, or 5.6%), leisure & hospitality (750, or 2.2%), and manufacturing (479, or 4.9%).
Industries in which employment remained substantially lower compared to 2020Q1 included mining (-2,801, or -14.2%), construction (-1,088, or -5.3%), and wholesale trade, transportation, warehousing, & utilities (-402, or -1.9%). Total government had 900 fewer jobs (-1.4%), with the greatest job losses seen in local (-571, or -1.2%) and state (-469, or -3.8%) government. Federal government added 140 jobs (1.9%).
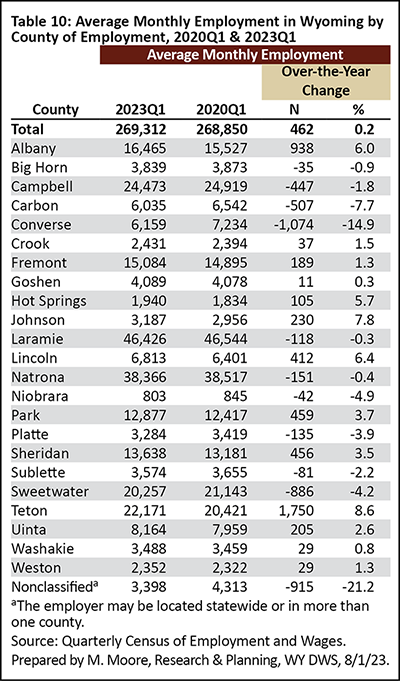
Thirteen of Wyoming's 23 counties returned to or exceeded pre-pandemic levels by 2023Q1 (see Table 10), led by Teton (1,750, or 8.6%) and Albany (938, or 6.0%) counties. Other counties that saw employment growth included Park (459, or 3.7%), Sheridan (456, or 3.5%), and Lincoln (412, or 6.4%).
Of the 10 counties that have not yet returned to pre-pandemic employment levels, several are those with large proportions of mining jobs, such as Converse (-1,074, or -14.9%), Sweetwater (-886, or -4.2%), Carbon (-507, or -7.7%), and Campbell (-447, or -1.8%) counties.
First quarter 2023 marked the eighth consecutive quarter of over-the-year job growth for Wyoming, as the state added more than 6,300 jobs and nearly $400 million in total wages. Almost all industries added jobs, led by mining, professional & business services, leisure & hospitality, and construction.
In addition, 2023Q1 was the first time the state's average monthly employment returned to pre-pandemic levels. Employment increased in industries such as professional & business services and retail trade, but remained lower than pre-pandemic levels in industries like mining and construction.
Quarterly employment and wage data for Wyoming from the QCEW are available online at https://doe.state.wy.us/LMI/toc_202.htm. Data for 2023Q2 will be released on November 3, 2023, with a feature article planned for the January 2024 issue of Wyoming Labor Force Trends.
References
Bullard, D. (2015). Local jobs and payroll in Wyoming in First Quarter 2015: Job losses appear in the oil & gas sector. Wyoming Labor Force Trends, 52(10). Research & Planning, WY DWS. Retrieved September 6, 2023, from https://doe.state.wy.us/LMI/trends/1015/1015.pdf
Moore, M. (2019, May). Chapter 1: Introduction — Driven by demographics and downturns: Wyoming’s 2018 labor market at a glance. 2019 Wyoming Workforce Annual Report. Research & Planning, WY DWS. Retrieved September 6, 2023, from https://doe.state.wy.us/LMI/annual-report/2019/2019_Annual_Report.pdf
Moore, M. (2022, July). 2021Q4 quarterly update: Wyoming shows continued job growth in fourth quarter. Wyoming Labor Force Trends, 59(7). Research & Planning, WY DWS. Retrieved September 6, 2023, from https://doe.state.wy.us/LMI/trends/0722/a1.htm
Research & Planning. (2023, July). Wyoming QCEW summary statistics by industry, 2001-2022 — Mining, including oil & gas. Retrieved September 6, 2023, from https://doe.state.wy.us/LMI/23Q1_QCEW/t32.htm

 Wyoming at Work
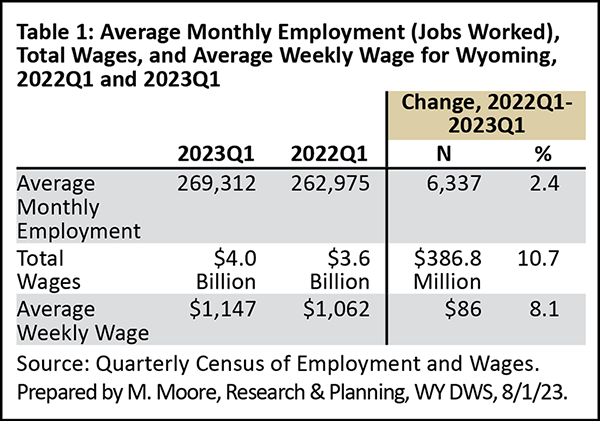