Wyoming Labor Force Trends
October 2022 | Volume 59, No. 10
Click Here for PDF
Return to Table of Contents
Industry Spotlight: Repair & Maintenance (NAICS 811)
by: Matthew Halama, Senior Economist
The industry spotlight is a quarterly feature from the Research & Planning (R&P) section of the Wyoming Department of Workforce Services designed to highlight a North American Industry Classification System (NAICS) subsector. This article uses data obtained from the Quarterly Census of Employment and Wages (QCEW) from the last 20 years, or the oldest available data to the most recent quarter available.
This article focuses on the repair & maintenance subsector, which is given the NAICS code 811. Industries that fall into the NAICS 811 category include general automotive repair, specialized automotive repair, car washes, electronic & precision equipment repair & maintenance, commercial & industrial machinery & equipment repair & maintenance, home & garden equipment repair & maintenance, appliance repair & maintenance, re-upholstery & furniture repair, and footwear & leather goods repair.
Statewide Wyoming quarterly data included in this article are total payroll, average monthly number of employees, average weekly wage, and number of businesses from the QCEW. A total of 85 quarters worth of data were observed from first quarter 2001 (2001Q1) to first quarter 2022 (2022Q1). A total of 85 quarters were examined for the research presented in this article. The numbers come from private establishments so local and federal government employment within this industry have been excluded. The data discussed in this article are available online at https://doe.state.wy.us/LMI/toc_202.htm.
Total Wages
The majority of quarters (49) reviewed showed an over-the-year increase in total wages, while 32 quarters had a decrease. The largest over-the-year increase was $15.3 million (40.1%) in 2010Q3, while the greatest over-the-year decrease was $8.3 million (-19.1%) in 2016Q3.
From 2001Q1 to 2022Q1, total payroll rose from approximately $18.0 million to $41.3 million ($23.3 million, or 129.4%).
Average Monthly Employment
Average monthly employment in repair & maintenance was largest in 2012Q3 at 4,345 and lowest at 2,861 in 2001Q1. The greatest over-the-year increase in employment was 673 (21.2%) in 2006Q4, while the largest decrease was 511 (-12.5%) in 2010Q1.
Repair & maintenance does not have the same seasonal changes in employment seen in many other industries in Wyoming. For example, statewide average monthly employment tends to increase during the summer months in second and third quarters and decrease during first and fourth quarters. As illustrated in Figure 1, repair & maintenance employment has remained relatively flat since 2015.
From 2001Q1 to 2022Q1, average monthly employment in repair & maintenance increased from 2,861 to 3,295 (434 jobs, or 15.2%).
Average Weekly Wage
The average weekly wage for repair & maintenance was lower than the statewide average wage during 46 of the quarters examined. The statewide average wage has been greater than the repair & maintenance average wage during each of the last nine quarters.
From 2001Q1 to 2022Q1, the average weekly wage for repair & maintenance increased from $484 to $964, an increase of $480, or 99.3%. In contrast, the statewide average weekly wage increased from $522 to $1,059 ($537, or 103.0%).
Number of Business Locations
The number of Unemployment Insurance-covered businesses in repair & maintenance increased from 707 in 2001Q1 to 730 in 2022Q1, an increase of 23, or 3.3%. The number of businesses peaked at 748 in 2009Q1 and was lowest at 690 in 2017Q1. The number of businesses in repair & maintenance has steadily increased over the last five years.
Conclusion
Repair & maintenance has experienced many of the same ups and downs as the rest of Wyoming’s economy, but overall employment and wages both increased from 2001Q1 to 2022Q1.


 Wyoming at Work
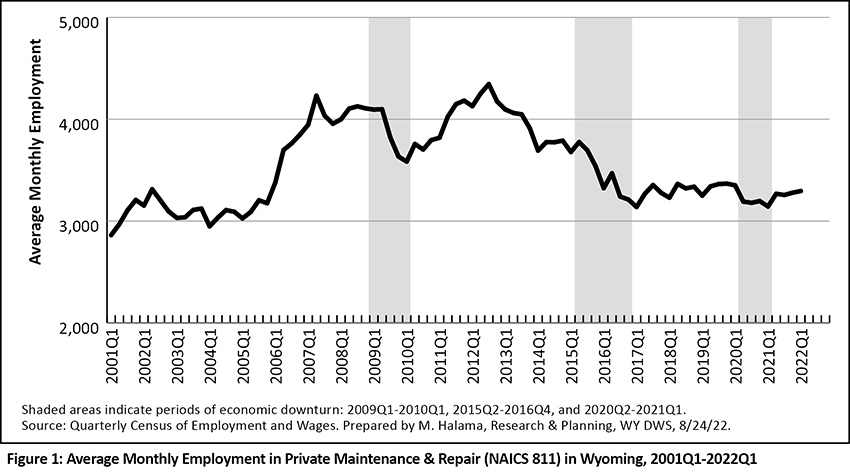