Wyoming Labor Force Trends
October 2022 | Volume 59, No. 10
Click Here for PDF
Return to Table of Contents
2022Q1 Quarterly Update: Wyoming Employment Grows for Fourth Consecutive Quarter
Abstract: This article provides an overview of Wyoming’s employment and wages in first quarter 2022, as the state saw over-the-year increases in employment and wages for the fourth consecutive quarter. The data presented in this article are from the Quarterly Census of Employment and Wages, available online at https://doe.state.wy.us/LMI/toc_202.htm.
by: Michael Moore, Research Supervisor
Wyoming added nearly 7,000 new jobs and more than $450 million in total wages from first quarter 2021 (2021Q1) to first quarter 2022 (2022Q1) as the state continued to recover from its most recent economic downturn (see Table 1). Although average monthly employment and total wages increased from prior-year levels for the last four consecutive quarters, Wyoming has not yet returned to pre-pandemic employment levels.
This article compares data from 2022Q1 to data from the prior year at the industry and county levels. In addition, this article also compares current employment and wages to pre-pandemic years. This analysis helps provide a better understanding of how different industries and counties are recovering from economic disruptions caused by the COVID-19 pandemic and job losses in the energy sector.
The data in this article are from the Quarterly Census of Employment and Wages (QCEW). Data from 2022Q1 are available at https://doe.state.wy.us/LMI/22Q1_QCEW/toc.htm.
Introduction
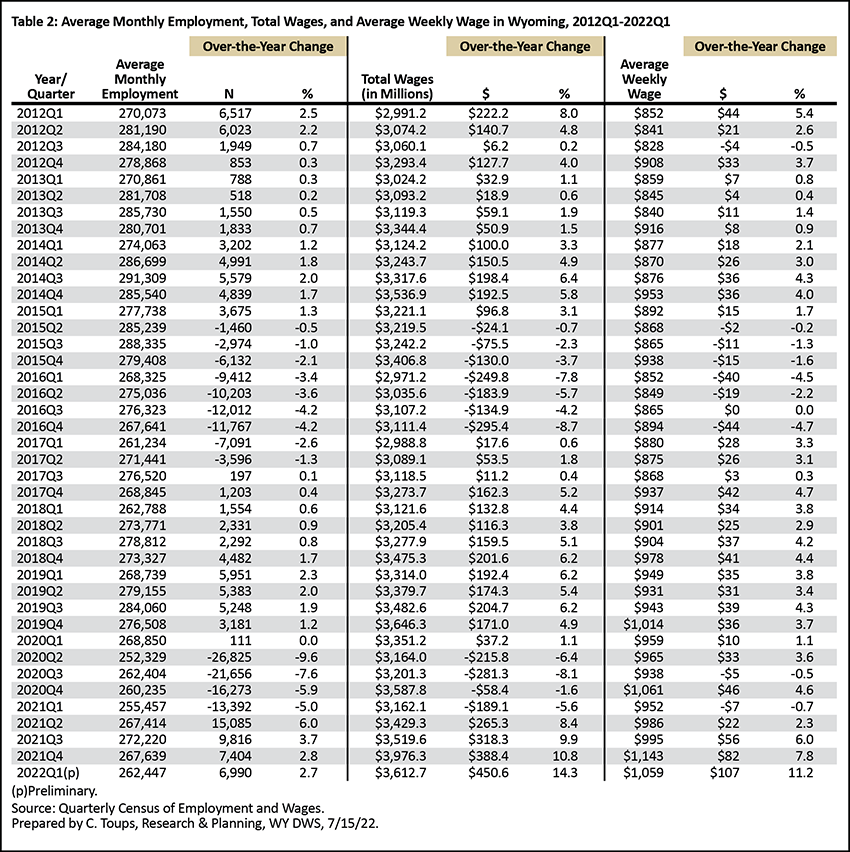
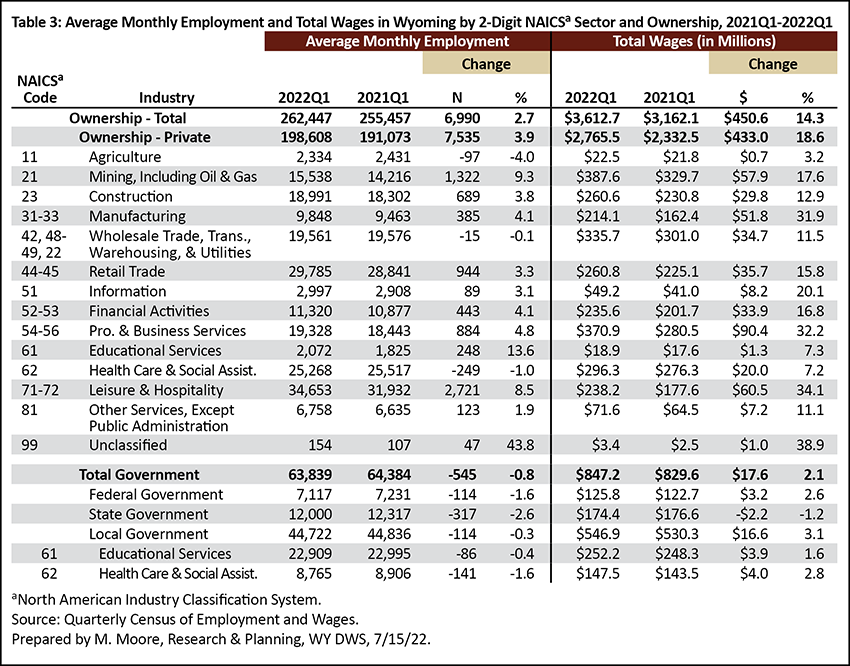
Wyoming’s average monthly employment in 2022Q1 was 262,447, an increase of 6,990 jobs (2.7%) compared to 2021Q1 (see Table 2). Total wages increased from $3.2 billion to $3.6 billion over the year ($450.6 million, or 14.3%) while the state's average weekly wage increased from $952 to $1,059 ($107, or 11.2%).
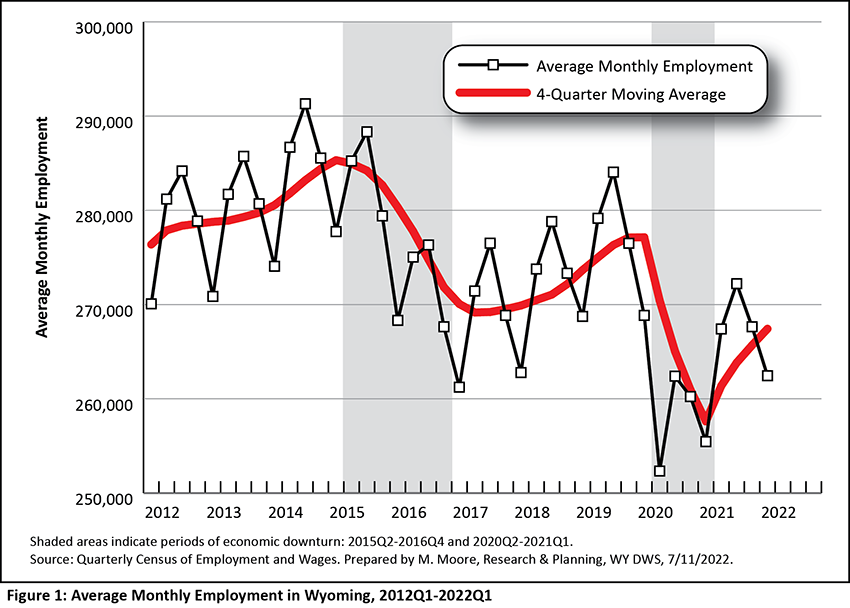
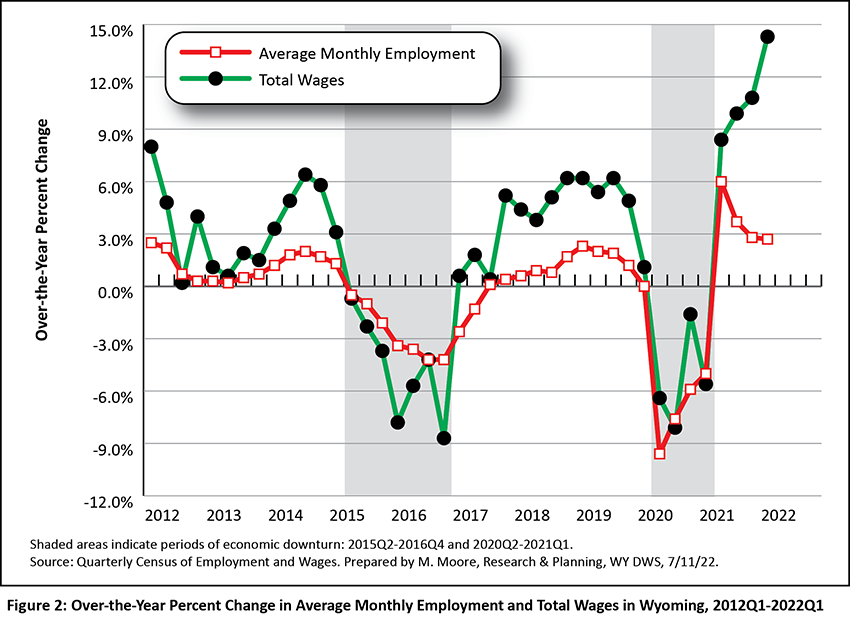
Since 2009, Wyoming has endured three periods of economic downturn, defined by the Research & Planning (R&P) section of the Wyoming Department of Workforce Services as a period of at least two consecutive quarters of over-the-year decrease in average monthly employment and total wages based on data from the QCEW (see Figure 1 and Figure 2). The two prior downturns occurred from 2009Q1 to 2010Q1 and from 2015Q2 to 2016Q4.
Wyoming’s most recent downturn was influenced by the COVID-19 pandemic and declines in the prices of and demand for the state’s energy resources, and lasted from 2020Q2 (the pandemic started in March 2020, just prior to second quarter) to 2021Q1. All three recent economic downturns were preceded by declining energy prices (Moore, 2019).
Wyoming has yet to return to pre-pandemic employment levels. The state's average monthly employment of 262,447 in 2022Q1 represented approximately 6,300 fewer jobs compared to 2019Q1 and 2020Q1. However, as noted by Bullard (2022) and discussed later in this article, some industries have exceeded pre-pandemic employment levels.
Industry
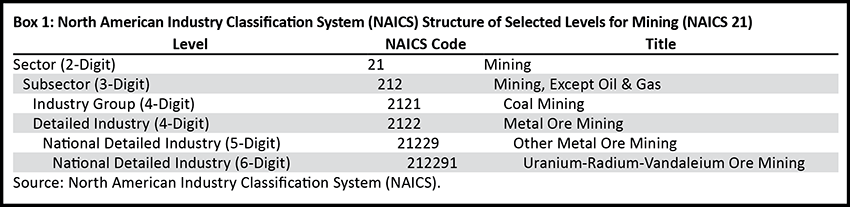
Industries are organized by the North American Industry Classification System (NAICS). A sample of the NAICS hierarchal structure for mining (NAICS 21) can be found in Box 1.
Employment and wages at the two-digit sector level are shown in Table 3. Nearly all private industries showed substantial over-the-year gains in employment, including leisure & hospitality (2,721, or 8.5%), mining, including oil & gas (1,322, or 9.3%), retail trade (944, or 3.3%), professional & business services (884, or 4.8%), and construction (689, or 3.8%). Over-the-year job losses were seen in health care & social assistance (-249, or -1.0%) and agriculture (-97, or -4.0%). In addition, total government lost 545 jobs (-0.8%), with decreases seen in the state (-317, or -2.6%), federal (-114, or -1.6%), and local (-114, or -0.3%) government levels.
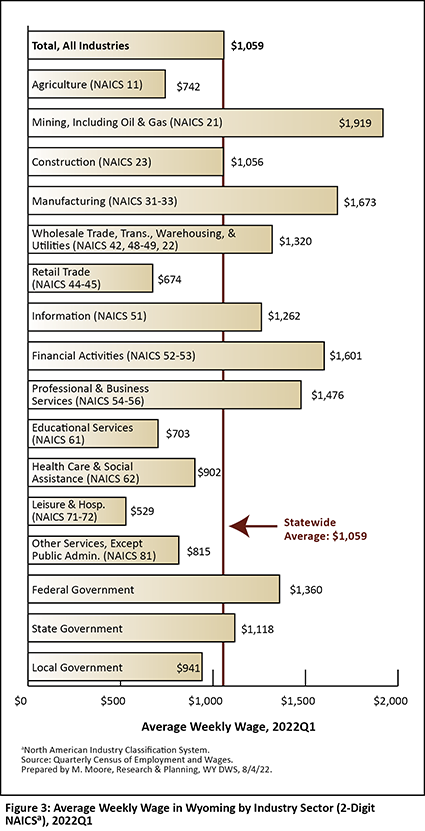
Average weekly wages have increased substantially from pre-pandemic levels in nearly all industries. As shown in Figure 3, in 2022Q1 the private industries with the highest average weekly wages included mining ($1,919), manufacturing ($1,673), financial activities ($1,601), and professional & business services ($1,476). The lowest average weekly wages were found in leisure & hospitality ($529) and retail trade ($674). Federal government had a higher average wage ($1,360) than state ($1,118) and local ($941) government.
This article focuses on four private industry sectors that showed substantial employment and wage growth over the year: mining, construction, professional & business services, and leisure & hospitality. More detailed tables are included for these four industries that show data for selected subsectors (three-digit), industry groups (four-digit), and detailed national industries (six-digit).
Mining, Including Oil & Gas (NAICS 21)
Mining (which includes coal, oil, and natural gas) is a “major economic engine of the Wyoming economy, both in direct employment and all industries that stem from this activity” (Manning, 2016). Historically, the mining sector has been a driver of Wyoming’s economic health.
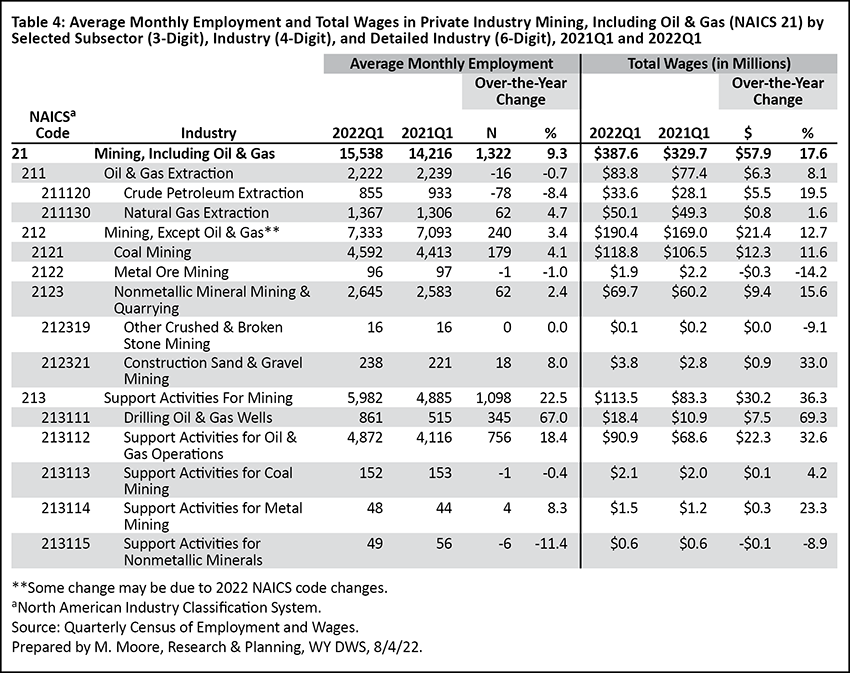
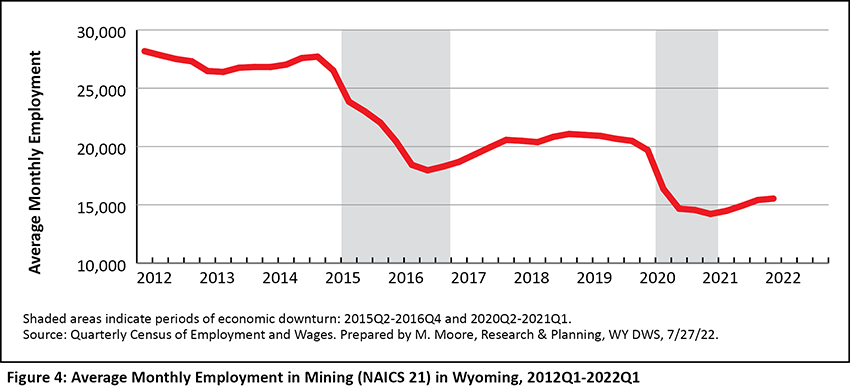
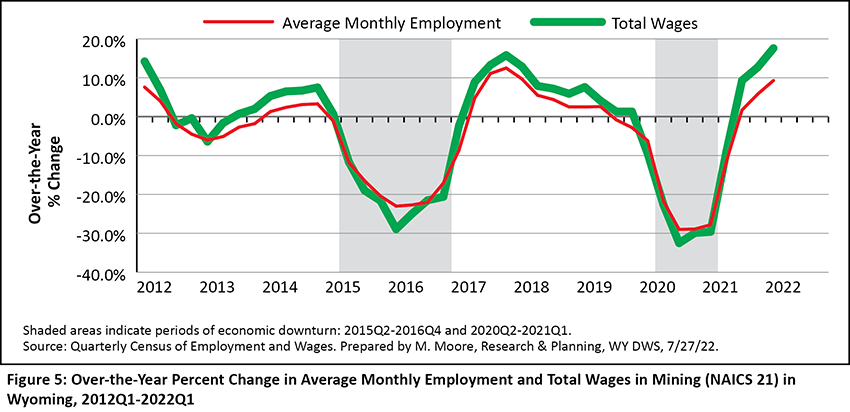
Employment in mining increased from 14,216 in 2021Q1 to 15,538 in 2022Q1 (see Table 4). This marked the third consecutive quarter of job growth for Wyoming's mining sector. However, employment in mining remains much lower compared to pre-pandemic levels. Figure 4 and Figure 5 illustrate the substantial drop in average monthly employment and total wages in mining during the two most recent economic downturns. Employment in Wyoming's mining sector dropped to historically low levels in 2020.
The greatest job gains in mining were found in the support activities for mining subsector (see Table 4). This sector is comprised of businesses "primarily providing support services, on a contract or fee basis, required for the mining and quarrying of minerals and for the extraction of oil and gas," such as drilling oil and gas wells (U.S. Bureau of Labor Statistics, 2022).
Average monthly employment in support activities for mining was 5,982 in 2022Q1, up 1,098 jobs (22.5%) compared to 2021Q1. The majority of these jobs gains were found in support activities for oil & gas operations (756 new jobs, or 18.4%) and drilling oil & gas wells (345 new jobs, or 67.0%).
Employment in mining, except oil & gas increased from 7,093 to 7,333 (240, or 3.4%). In particular, Wyoming's coal mining industry added 179 jobs, a 4.1% increase. This marked the greatest over-the-year increase in coal mining employment since 2015Q2 (Research & Planning, 2022). Employment in the oil & gas extraction subsector decreased slightly over the year, from 2,239 to 2,222 (-16, or -0.7%).
Total wages in mining increased from $329.7 million in 2021Q1 to $387.6 million in 2022Q1 ($57.9 million, or 17.6%).
Mining contributed 5.9% of all jobs and 10.7% of total wages in Wyoming in 2022Q1. In comparison, in 2015Q1, just prior to the start of the previous economic downturn (2015Q2-2016Q4) mining contributed 9.6% of the state’s total employment (one in 10 jobs) and 19.0% of total wages ($1 of every $5 in payroll; Research & Planning, 2022).
Construction (NAICS 23)
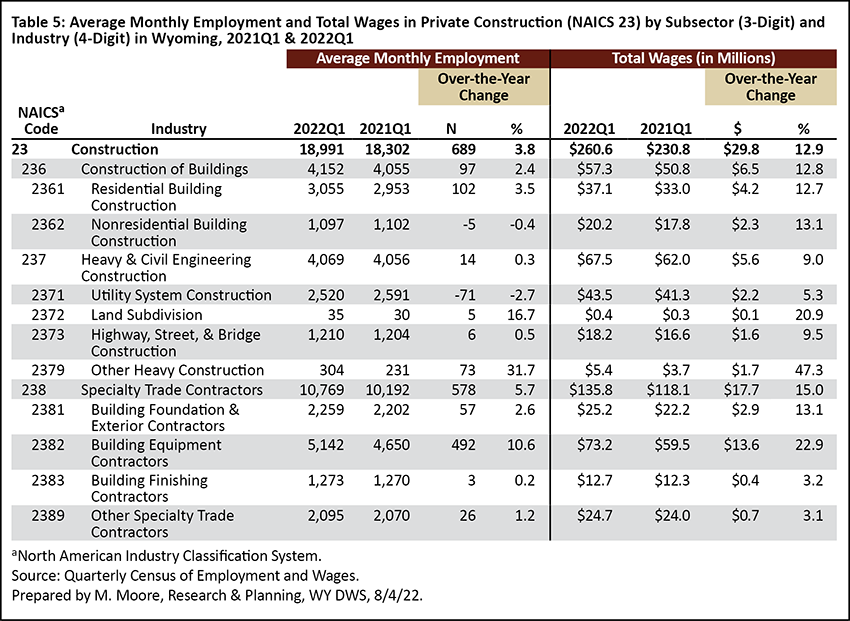
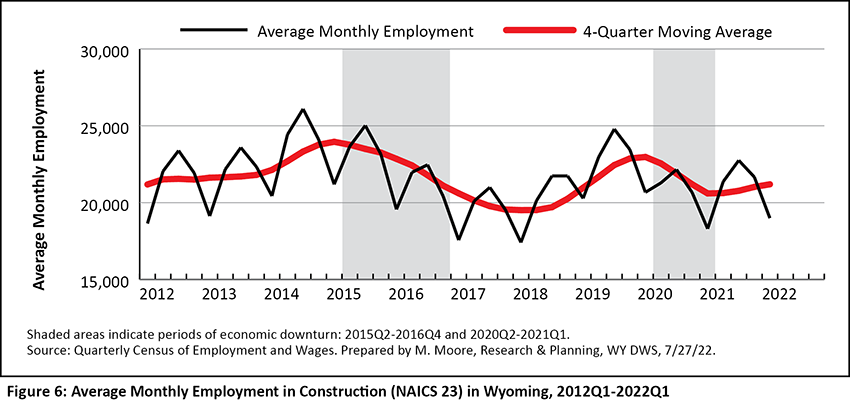
Average monthly employment in Wyoming's construction sector increased from 18,302 in 2021Q1 to 18,991 in 2022Q1 (689 jobs, or 3.8%; see Table 5). Construction employment is typically at its lowest point of the year during first quarter.
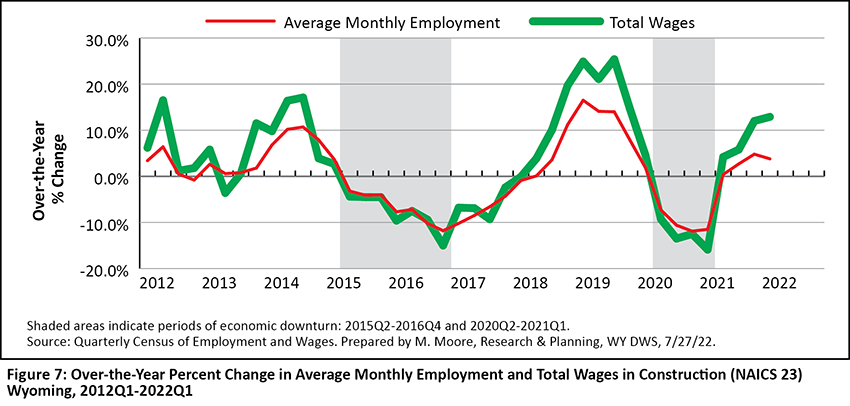
Over-the-year job growth continued in Wyoming’s construction sector for the fourth consecutive quarter in 2022Q1 (see Figures 6 and Figure 7). Prior to the pandemic, construction experienced substantial growth driven by temporary oil & gas pipeline construction jobs.
Over-the-year job growth was seen to some degree in all three construction subsectors in 2022Q1. Specialty trade contractors added 578 jobs (5.7%), construction of buildings grew by 97 jobs (2.4%), and heavy & civil engineering construction increased by 14 jobs (0.3%). In particular, the building equipment contractors industry showed substantial growth with 492 new jobs, a 10.6% increase.
Total wages in construction increased from $230.8 million to $260.6 million ($29.8 million, or 12.9%). The greatest total wage growth was seen in specialty trade contractors ($17.7 million, or 15.0%), followed by construction of buildings ($6.5 million, or 12.8%).
Construction accounted for 7.2% of all jobs and total wages in 2022Q1, virtually unchanged during most quarters over the last 20 years (Research & Planning, 2022).
Professional & Business Services (NAICS 54-56)
Professional & business services is a supersector comprised of three sectors: professional & technical services (NAICS 54), management of companies & enterprises (NAICS 55), and administrative & waste services (NAICS 56).
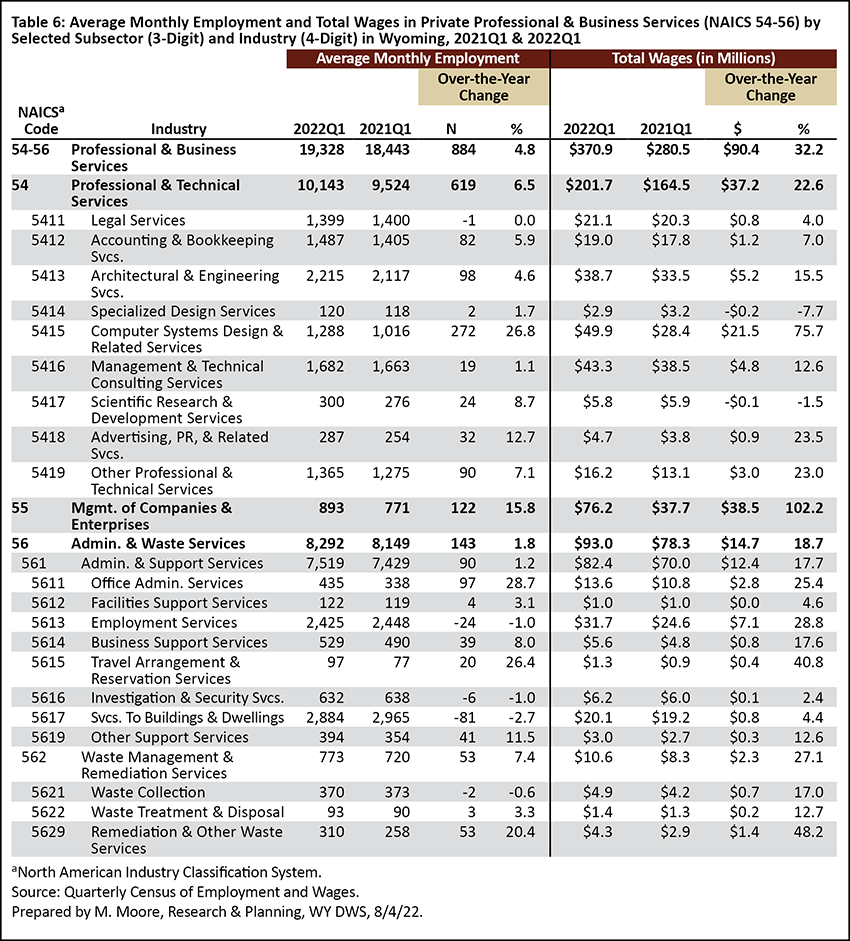
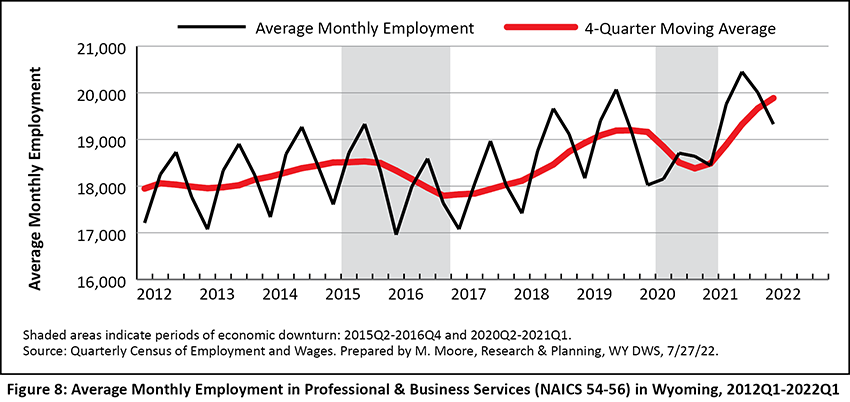
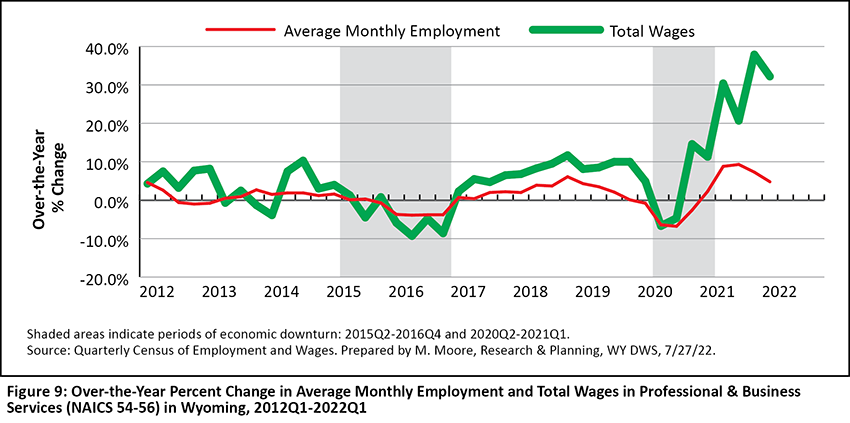
Average monthly employment increased from 18,443 in 2021Q1 to 19,328 in 2022Q1 (884, or 4.8%; see Table 6). This marked the fifth consecutive quarter of over-the-year job growth for this industry. Prior to the pandemic, professional & business services showed steady growth for 11 consecutive quarters, or nearly three years, from 2017Q2 to 2019Q4 (see Figure 8 and Figure 9). Employment in professional & business services has reached historical highs since the end of the most recent downturn (Research & Planning, 2022).
Job growth was seen in all three sectors in 2022Q1, with the greatest increase found in professional & technical services (619 jobs, or 6.5%). This sector includes such activities as legal services, accounting & bookkeeping services, scientific research & development, and more.
Management of companies & enterprises added 122 jobs, a 15.8% increase.
Administrative & waste services added 143 jobs, an increase of 1.8%. Within this sector, the largest increases were seen in office administrative services (97, or 28.7%) and remediation & other waste services (53, or 20.4%).
Total wages in professional & business services increased from $280.5 million to $370.9 million ($90.4 million, or 32.2%). As shown in Figure 9, total wages in professional & business services have increased substantially over each of the last seven quarters.
Professional & business services accounted for 7.4% of all jobs and 10.3% of the state’s total wages in 2022Q1, more wages than any other private sector except mining. This industry has contributed an increasing percentage of Wyoming’s employment and wages over the last few years; for example 10 years ago in 2012Q1, professional & business services contributed 17,211 jobs (6.4% of the state total) and $210.1 million in total wages (7.0% of the state total; Research & Planning, 2022).
Leisure & Hospitality (NAICS 71-72)
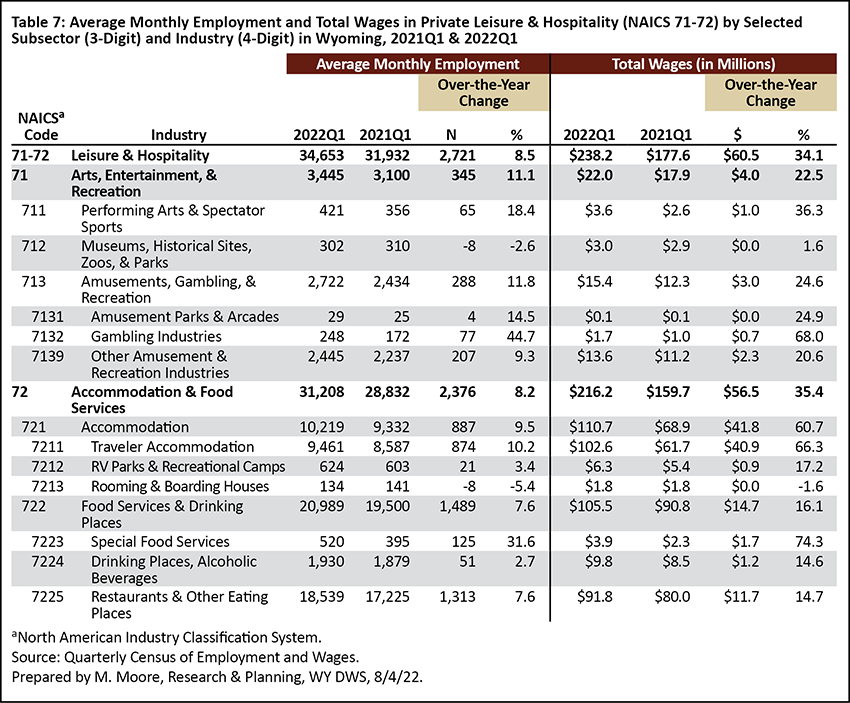
The leisure & hospitality supersector is comprised of two sectors: arts, entertainment, & recreation (NAICS 71) and accommodation & food services (NAICS 72; see Table 7).
During the pandemic and most recent downturn, leisure & hospitality employment dropped to a 20-year low (Moore, 2021) as this industry lost more jobs than any other. Since then, leisure & hospitality has added more jobs than any industry during each of the last four quarters (Research & Planning, 2022). The average monthly employment of 34,653 was higher than in any other first quarter dating back to at least 2001Q1.
The greatest increase in employment within leisure & hospitality was seen in food services & drinking places (1,489 jobs, or 7.6%), followed by accommodation (887, or 9.5%) and amusements, gambling, & recreation (288, or 11.8%).
Total wages in leisure & hospitality increased from $177.6 million in 2021Q1 to $238.2 million in 2022Q1 ($60.5 million, or 34.1%).
Leisure & hospitality accounted for 13.2% of all jobs in 2021Q4, but only 6.6% of the state’s total wages. This discrepancy is due in large part to the number of lower paying jobs in leisure & hospitality. In 2022Q1, the average weekly wage in leisure & hospitality of $529 was almost exactly half the statewide average wage of $1,059.
County
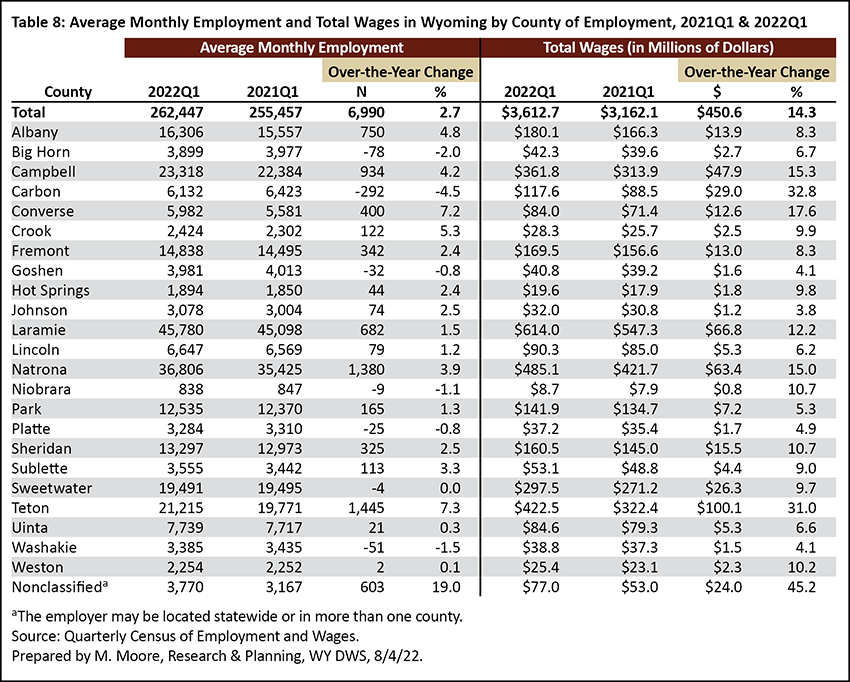
All but six counties experienced over the-year job gains in 2022Q1 (see Table 8), with the greatest increases seen in Teton (1,445 jobs, or 7.3%), Natrona (1,380, or 3.9%), Campbell (934, or 4.2%), Albany (750, or 4.8%), and Laramie (682, or 1.5%) counties. The greatest job losses were seen in Carbon (-292, or -4.5%), Big Horn (-78, or -2.0%), and Washakie (-51, or -1.5%) counties.
Total wages increased in each county over the year. The greatest increases were seen in Teton ($100.1 million, or 31.0%), Laramie ($66.8 million, or 12.2%), Natrona ($63.4 million, or 15.0%), Campbell ($47.9 million, or 15.3%), and Carbon ($29.0 million, or 32.8%) counties.
Pre-Pandemic Levels
As previously mentioned, Wyoming has not returned to pre-pandemic employment levels despite recent job gains. The state’s average monthly employment of 262,447 in 2022Q1 remained 2.3% lower (-6,292 jobs) than the 268,739 in 2019Q1.
However, an article in the August 2022 issue of Wyoming Labor Force Trends demonstrated how employment in several industries recently surpassed pre-pandemic levels (Bullard, 2022). For example, Bullard observed based on data from the Current Employment Statistics (CES) program that leisure & hospitality lost 11,700 jobs (-31.5%) from March 2020 to April 2020. Employment began to rebound by May 2020, and by April 2022, "employment exceeded pre-pandemic levels by a sizeable margin."
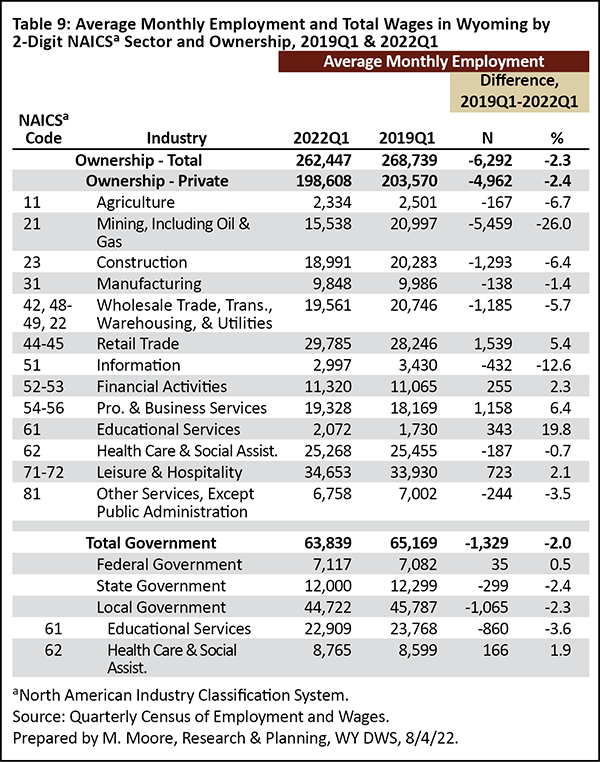
Table 9 compares average monthly employment from 2022Q1 to pre-pandemic employment from 2019Q1. Industries with higher employment in 2022Q1 included retail trade (1,539 more jobs, or 5.4%), professional & business services (1,158, or 6.4%), leisure & hospitality (723, or 2.1%), and financial activities (255, or 2.3%).
In several other industries, however, employment remained substantially lower compared to 2019Q1; these industries included mining (-5,459, or -26.0%), construction (-1,293, or -6.4%), and wholesale trade, transportation, warehousing, & utilities (-1,185, or -5.7%). In the August 2022 Trends article, Bullard explained that Wyoming's wholesale trade and transportation & warehousing sectors are closely tied to the state's energy sector, which helps explain the lower employment in those industries.
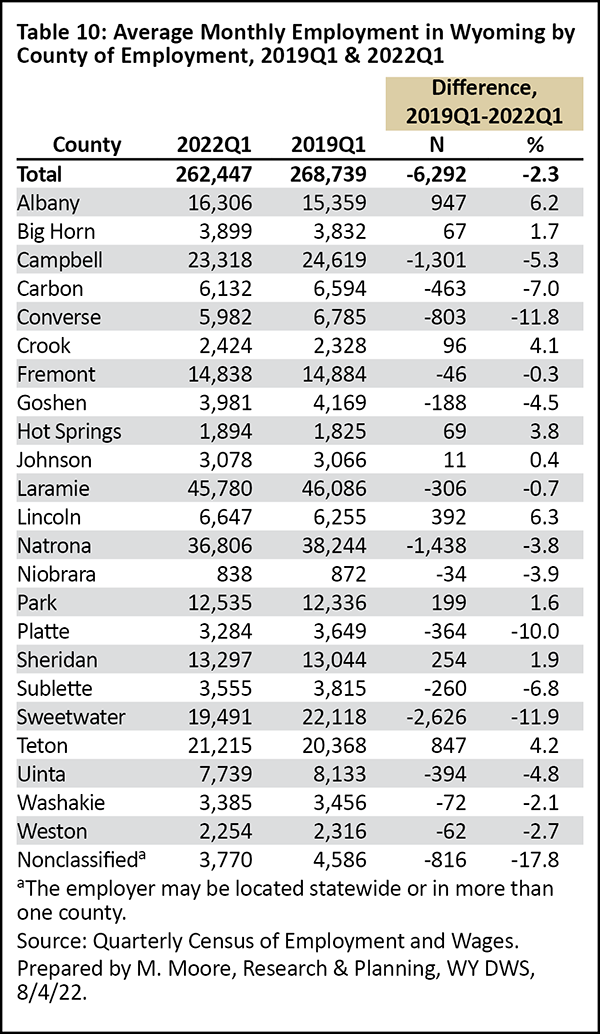
As shown in Table 10, nine of Wyoming's 23 counties had higher average monthly employment in 2022Q1 than in 2019Q1; these included Albany (947 more jobs, or 6.2%), Teton (847, or 4.2%), Lincoln (392, or 6.3%), Sheridan (254, or 1.9%), and Park (199, or 1.6%) counties. Employment in the remaining 14 counties remained lower than 2019Q1 employment. For example, Sweetwater County had 2,626 fewer jobs (-11.9%), followed by Natrona (-1,438, or -3.8%), Campbell (-1,301, or -5.3%), and Converse (-803, or -11.8%) counties.
Conclusion
Wyoming experienced its fourth consecutive quarter of over-the-year job gains in 2022Q1, as the state added nearly 7,000 jobs, a 2.7% increase. Total wages increased by $450.6 million, or 14.3%. While employment lagged behind pre-pandemic levels overall, several industries exceeded their 2019Q1 employment, including retail trade, professional & business services, leisure & hospitality, and financial activities.
Quarterly employment and wage data for Wyoming from the QCEW are available online at https://doe.state.wy.us/LMI/toc_202.htm. Data for 2022Q2 will be released on November 4, 2022, with a feature article planned for the January 2023 issue of Wyoming Labor Force Trends.
References
Bullard, D. (2022, August). Pandemic job losses and recovery in Wyoming: A sector-by-sector review. Wyoming Labor Force Trends, (59)8. Research & Planning, WY DWS. Retrieved August 24, 2022, from https://doe.state.wy.us/LMI/trends/0822/a1.htm
Manning, P. (2016, April). Chapter 2: Global demand for oil, gas and coal. Workforce Planning Report 2016, Wyoming Labor Force Trends, (53)4. Research & Planning, WY DWS. Retrieved August 24, 2022, from https://doe.state.wy.us/LMI/trends/0416/a2.htm
Moore, M. (2019, May). Chapter 1: Introduction — Driven by demographics and downturns: Wyoming’s 2018 labor market at a glance. 2019 Wyoming Workforce Annual Report. Research & Planning, WY DWS. Retrieved August 24, 2022, from https://doe.state.wy.us/LMI/annual-report/2019/2019_Annual_Report.pdf
Moore, M. (2021, April). 2020Q3 quarterly update: Wyoming job losses continue in third quarter 2020. Wyoming Labor Force Trends, 58(4). Retrieved August 24, 2022, from https://doe.state.wy.us/LMI/trends/0421/0421.pdf
Research & Planning. (2022). Wyoming QCEW summary statistics by industry, 2001-2022: Total, all industries. Retrieved August 24, 2022, from https://doe.state.wy.us/LMI/QCEW_OTY/toc.htm
U.S. Bureau of Labor Statistics (2022, June). Industries at a glance: Support activities for mining -- NAICS 213). Retrieved August 24, 2022, from https://www.bls.gov/iag/tgs/iag213.htm


 Wyoming at Work
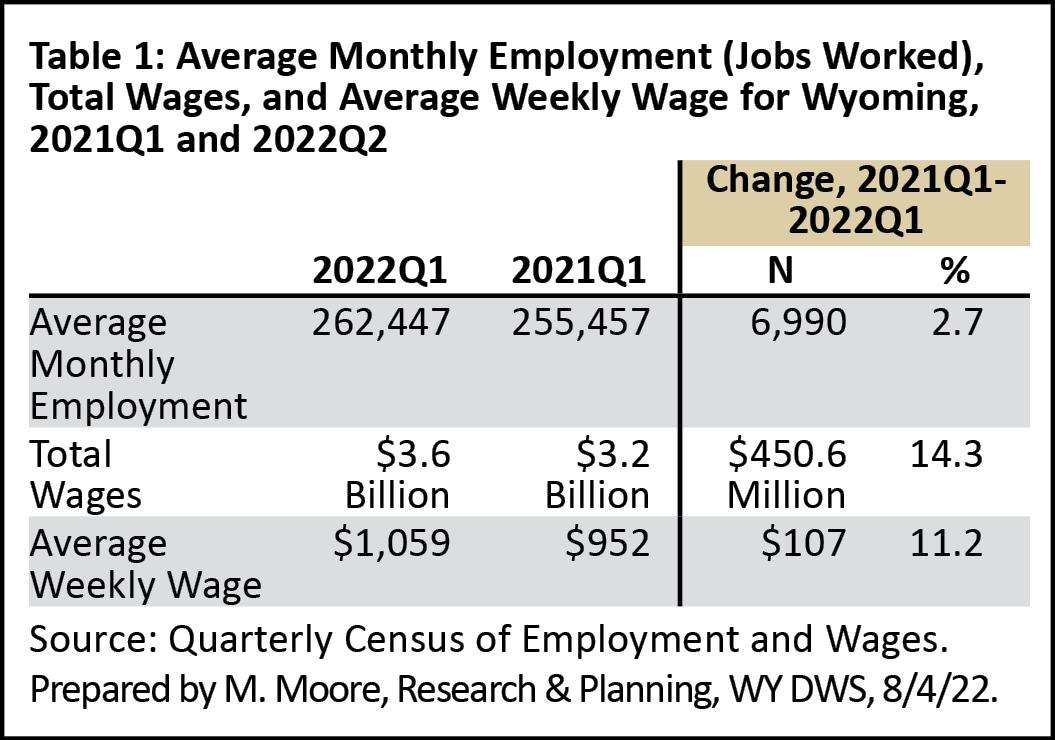