Wyoming Labor Force Trends
September 2022 | Volume 59, No. 9
Click Here for PDF
Return to Table of Contents
Gross Output and Wyoming's Economy: A Primer
Abstract: The following article is a brief introduction to a new report from the Research & Planning (R&P) section of the Wyoming Department of Workforce Services on gross output. The full publication is forthcoming and will be published October 2022.
by: Matthew Halama, Senior Economist
In 2014, the U.S. Bureau of Economic Analysis (BEA) started reporting the gross output statistic. Gross output is an economic variable that measures spending throughout the entire economic cycle from initial production to the sales of final goods. Gross domestic product (GDP) only measures the economic value of the final goods being sold; it does not take into account the economic value of the production process. Subtracting GDP from gross output provides an estimate of intermediate inputs, a measurement of the value of the supply chain spending in an area. Supply chain spending (also known as intermediate inputs) is larger than the individual economic components that make up GDP (consumption, investment, government, import, and export spending).
Data for this research came from IMPLAN and United States Bureau of Economic Analysis (BEA). IMPLAN compiles annual gross output and gross domestic product (GDP) data going as far back as 2001. IMPLAN provides the nominal monetary value of the components of gross output and GDP. The components of GDP include consumption (C), investment (I), government spending (G), exports (X), imports (M), and institutional sales (IS). Consumption is defined as personal consumption expenditures such as spending by households on non-fixed capital items. Investment spending refers to private domestic investment or capital expenditures. Government spending denotes expenditures on goods and services by the government. Net exports is the difference between domestic spending on foreign goods, exports (X) and foreign spending on domestic goods, imports (M). Institutional sales refers to sales of goods and services by institutions and that they are subtracted from the other components of final demand (GDP). Intermediate inputs as defined by IMPLAN are the foreign and domestically-produced goods and services used up by an industry in the process of producing its gross output.
Why it Matters
While GDP is the primary economic measurement used in the country, it often leaves an incomplete or inaccurate picture of the state of the economy. Professor Mark Skousen (2017) uses a four-stage model of the economy to illustrate the relationship between gross output and GDP. Stage 1 measures the sales/revenues of resources extracted; stage 2 measures the goods and services produced and manufactured; stage 3 measures goods and services through wholesale and retail channels; and stage 4 measures the value of goods and services sold to end users. Stage 4 (GDP) is the summation of the value of finished goods and services sold to consumers, businesses, and government as final users, whereas gross output is the total economic activity of all sales/revenues of firms at all four stages of production. It is frequently reported that consumption spending makes up 70% of GDP and therefore is the primary driver of the economy. Gross output is an economic measure that captures spending in all stages of production, not just final demand that GDP captures.
Important Findings
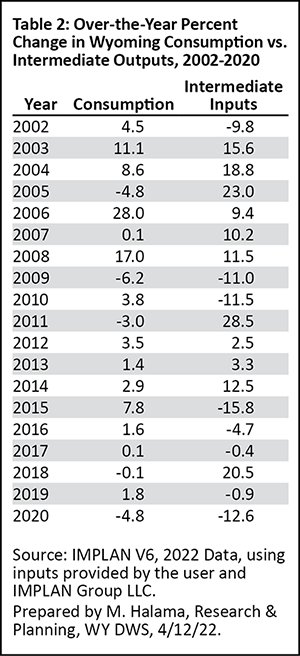
In 2020, gross output spending was $69.6 billion, while gross domestic product spending in Wyoming was $36.5 billion (see Table 1). During that same time, intermediate input spending was $33.1 billion compared to $24.4 billion in consumption spending in Wyoming (see Table 3). Of course, the aforementioned numbers will not be spread evenly among industries grouped according to North American Industry Classification System (NAICS). Intermediate input spending will most likely be in goods-producing industries such as mining, construction, and manufacturing, while consumption spending will likely be captured within retail trade, finance and insurance, and real estate and rental and leasing.
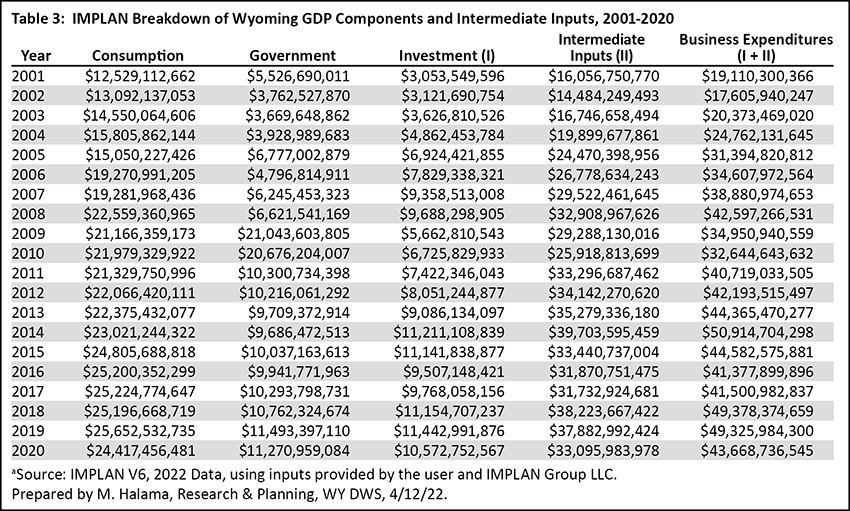
Another interesting finding is the downturns Wyoming experienced in 2010, 2016, and 2020 coincided with a large drop in intermediate inputs in each of these years, while consumption spending only fell modestly in 2009 and 2020 (see Table 2). This implies that intermediate inputs may be a better signal indicating economic downturns in Wyoming. The argument that consumption spending makes up nearly 70.0% of GDP, while accurate, ignores intermediate input spending. When intermediate input spending is taken into consideration, consumption accounts for 35.0% of spending in a gross output model. The findings suggest that consumption spending is not a large driver of economic conditions in Wyoming.
Future Research
Future research includes deconstructing gross output by two- and three-digit NAICS industries to see the relationship between the different components of gross output on those industries. In addition, using regression analysis to see which gross output components affect employment among the different NAICS industries may show which component encourages growth. The benefit of these research proposals would be to first detail the economic value of each component of gross output to more detailed industries to see what “drives” the industry. The second would be to run a regression analysis on the components of gross output on each two- or three-digit industry to understand the relationship between spending and employment. Do any of the components of gross output have a statistically significant effect on the level of employment? If so, which spending components contribute to an increase or decrease in employment?
References
Skousen, M. (2017). GO Beyond GDP: Introducing Gross Output as a Top-Line in National Income Accounting. Swedish Entrepreneurship Forum. Retrieved from https://entreprenorskapsforum.se/wp-content/uploads/2017/10/PS_Skousen_web.pdf


 Wyoming at Work
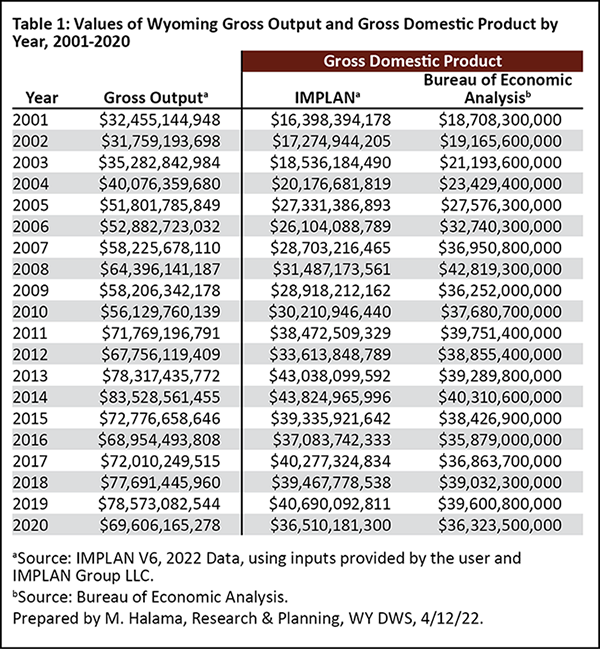