Wyoming Labor Force Trends
August 2023 | Volume 60, No. 8
Click Here for PDF
Return to Table of Contents
An Update on the Demographics of Wyoming's Labor Market
by: Michael Moore, Research Supervisor
Demographics tables published by Research & Planning annually have a wide variety of uses. As illustrated in this article, they can identify trends in the ages of Wyoming workers, help provide a better understanding of the gender wage gap, and more. These demographics tables are available online at https://doe.state.wy.us/LMI/demographics.htm.
Each year, the Research & Planning (R&P) section of the Wyoming Department of Workforce Services publishes detailed demographics tables on Wyoming’s labor market. These tables provide rich detail not otherwise available.
The data presented in these demographics tables are based on employers’ quarterly wage and employment reports to the Unemployment Insurance (UI) tax section of the Wyoming Department of Workforce Services; these are referred to as wage records. UI covered employment represents approximately 91.5% of Wyoming’s total wage and salary employment (Bullard, 2015). Any individual who had wages in Wyoming at any time from 2000 to 2022 is included in the summary counts presented in this research. Each individual is counted only once.
For the research discussed in this article, R&P links wage records to other administrative databases, such as the driver's license file obtained from the Wyoming Department of Transportation. This allows R&P analysts to identify key variables such as gender, age, industry of employment, county of residence and employment, average wages earned, average quarters worked, and more.
R&P’s demographics tables provide a wealth of information on the state’s labor market. This article provides samples of information found in these tables.
Economic Trends and Gender
Data for male and female resident workers, along with nonresidents, are included in R&P’s demographics tables. The term nonresidents refers to individuals for whom demographic data are not available; these may be individuals who travel to Wyoming for temporary seasonal work, or individuals who moved to Wyoming but had not yet obtained a Wyoming driver’s license or otherwise established residency. This section will focus primarily on resident female and male workers in Wyoming over the last 20 years.
From 2002 to 2022, Wyoming experienced several economic ups and downs (see Figure 1). The state saw rapid economic expansion from 2005 to 2008, but experienced three separate economic downturns since. R&P has defined an economic downturn as a period of at least two consecutive quarters of over-the-year decline in average monthly employment and total wages, based on data from the Quarterly Census of Employment and Wages (QCEW).
Each of these recent downturns was preceded by declining energy prices and job losses in Wyoming’s mining sector. The first of these three downturns lasted from first quarter 2009 (2009Q1) to first quarter 2010 (2010Q1) and began during the national Great Recession, which lasted from December 2007 to June 2009 (NBER, 2010). The next downturn lasted from 2015Q2 to 2016Q4, and resulted from a substantial decline in the demand for and cost of natural resources such as coal, oil, and natural gas. Finally, the most recent economic downturn lasted from 2020Q2 to 2021Q1 and was largely driven by business closures during the COVID-19 pandemic and job losses in Wyoming's mining industry.
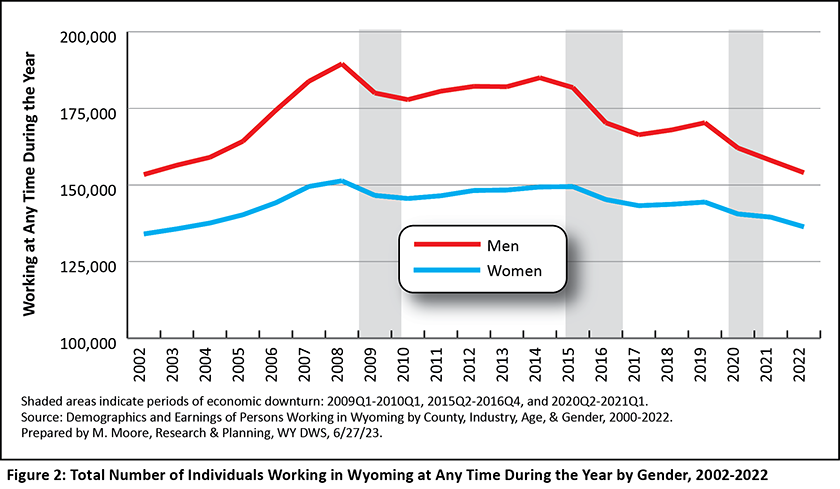
Figure 2 illustrates how the economic downturns affected men and women working in the state. During each of the downturns, the decrease in the number of male workers was much greater than the decrease in the number of female workers. This was especially true during the first two downturns, due to the large number of men working in mining jobs that were heavily impacted by the downturns.
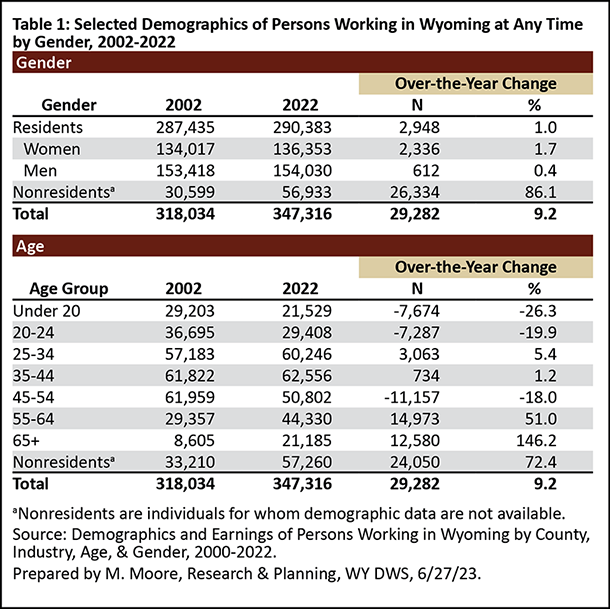
From 2002 to 2022, the overall number of individuals working in Wyoming at any point during the year increased from 318,034 to 347,316 (an increase of 29,282, or 9.2%; see Table 1). Wyoming saw a greater increase of women working (2,336, or 1.7%) than men (612, or 0.4%).
Gender Wage Gap
The demographics tables include average annual wages, which provide for a basic comparison in earnings between men and women working in Wyoming. However, it is important to understand that the earnings discussed in this article are not an apples-to-apples comparison between men and women, as they do not take into account important factors such as occupation, hours worked, experience in a particular job, and others. Occupation data are not collected with wage records, so R&P only has very limited data on a relatively small number of occupations.
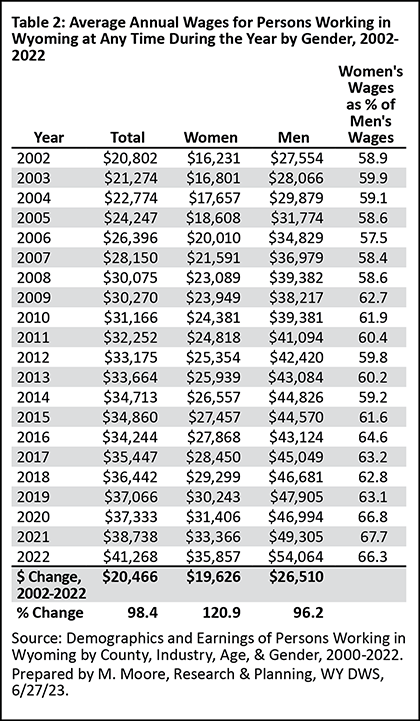
Overall, women in Wyoming earned an average annual wage of $35,857 in 2022, compared to $54,064 for men. In other words, women earned 66.3% of men’s wages, or 66.3 cents on the dollar. Over the last 20 years, the gender wage gap in Wyoming has narrowed; in 2002, women earned 58.9% of men’s wages (see Table 2). The gender wage gap is widest during periods of growth for Wyoming’s mining industry, and then narrows during economic downturns.
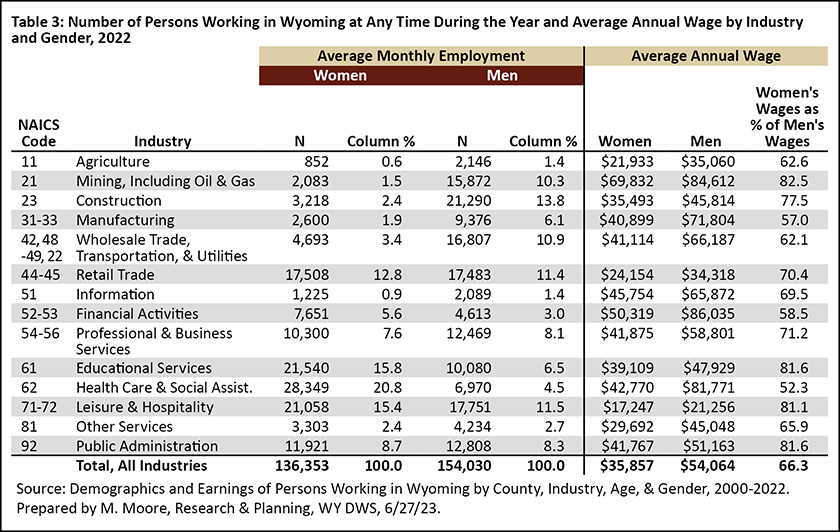
The difference in wages can be explained in part by the industries in which men and women work. In 2022, approximately six out of every 10 women (64.8%) worked in one of four industries: health care & social assistance, educational services, leisure & hospitality, and retail trade. As shown in Table 3, these are often low-paying industries. In contrast, men are often employed in more diverse and higher-paying industries, such as construction; wholesale trade, transportation, & utilities; and mining, including oil & gas.
At the industry level, women also earned considerably less than men did. In health care & social assistance, for example, the average annual wage for women was $42,770, approximately half (52.3%) of the $81,771 average annual wage for men. This is likely influenced by the large number of women working in lower-paying jobs as nursing assistants. In leisure & hospitality, which is an industry with lower wages, women were paid 81.6% of men’s wages.
Despite the existing gender wage gap, women’s wages have grown at a greater rate than men’s wages over the last 20 years. The average wage for women in Wyoming increased 120.9% from $16,231 in 2002 to $35,857 in 2022 (see Table 2). In contrast, men’s wages increased 96.2%, from $27,554 to $54,064.
Age Trends
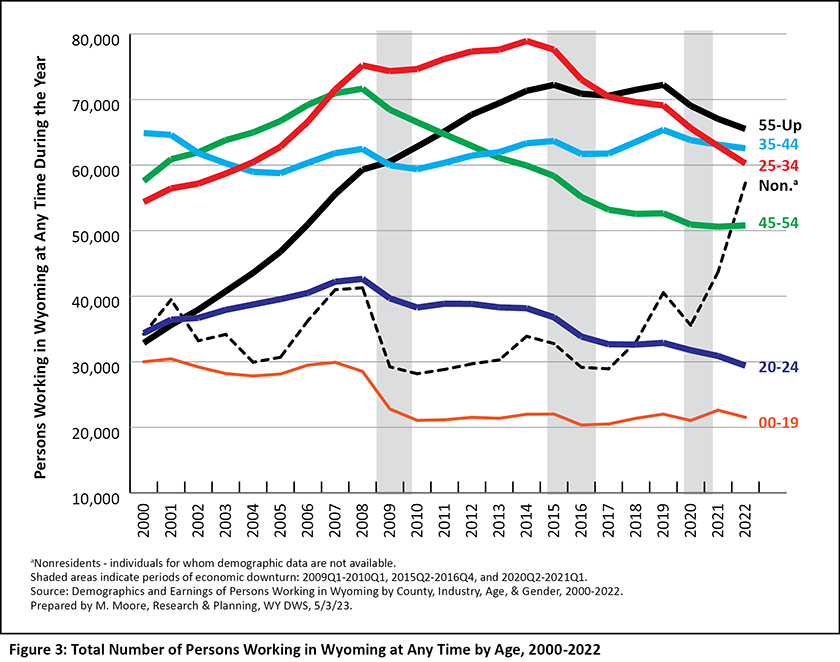
Wyoming’s workforce has gone through many demographic changes over the last 20 years, as illustrated in Figure 3. This section will focus on the changes seen from 2019 to 2022 to understand how the Covid-19 pandemic affected Wyoming's labor market.
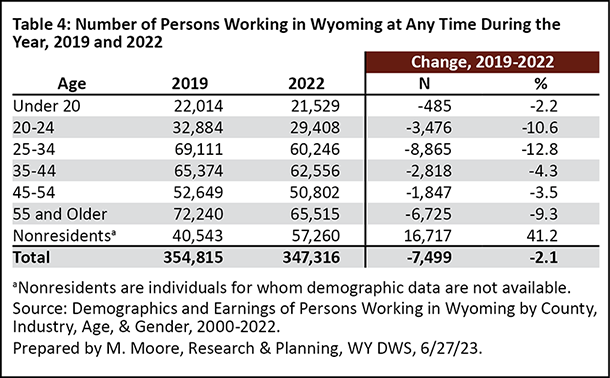
The number of persons working in Wyoming decreased for all age groups from 2019 to 2022, with the greatest losses seen in those ages 25-34 (-8,865, or -12.8%) and 55 and older (-6,725, or -9.3%; see Table 4).
Research & Planning identified several possible reasons for the decline in those ages 25-34 (Moore, 2021), such as the large number of younger workers leaving Wyoming, working in another state, or working gig-type jobs that are not covered by Wyoming UI, and therefore not found in wage records.
The sharp decrease in workers ages 55 and older since the start of the COVID-19 pandemic likely is the result of many older workers leaving the workforce or retiring during the pandemic. Nationally, Montes, Smith, and Dajon (2022) observed a "retirement boom" in the years since the pandemic, and noted that the share of retired workers was 1.5 percentage points higher in 2022 compared to 2019, prior to the pandemic. Castro (2021) stated that as of August 2021, more than 3 million people retired earlier than expected due to the pandemic.
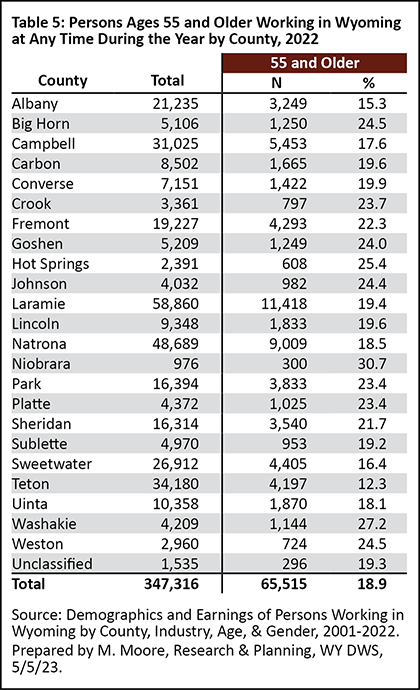
Despite the decline in older workers in recent years, individuals ages 55 and older contributed the largest share of all persons working in Wyoming in 2022. Of the 347,316 people working in Wyoming at any time during the year, nearly one in five (18.9%) was 55 or older (see Table 5).
Older workers made up an even greater proportion of all persons working in some of the Wyoming's more rural and least populous counties (see Table 5). For example, nearly one in three (30.7%) of the 976 people working in Niobrara County was 55 or older. Other examples of counties where older workers made up greater percentages of the total included Washakie (27.2%), Hot Springs (25.4%), Big Horn (24.5%), and Weston (24.5%) counties.
Conclusion
The demographics tables published by R&P annually have a wide variety of uses. They can be used to help understand changes in the demographic makeup of Wyoming’s labor market, and also to identify trends in ages, annual earnings, and more.
R&P’s demographics tables, along with articles, graphics, and more, are available at https://doe.state.wy.us/LMI/demographics.htm.
References
Bullard, D. (2015, January). Local jobs and payroll in Wyoming in second quarter 2014: Construction leads job growth. Wyoming Labor Force Trends, 52(1). Research & Planning, Wyoming Department of Workforce Services. Retrieved July 7, 2023, from https://doe.state.wy.us/LMI/trends/0115/qcew.htm
Castro, M. (2021, October). The Covid retirement boom. Federal Reserve Bank of St. Louis. Retrieved May 5, 2023, from https://tinyurl.com/2whzsm6w
Montes, J., Smith, C., and Dajon, J. (2022). The great retirement boom: The pandemic-era surge in retirements and implications for future labor force participation. Federal Reserve Board, Washington, D.C. Retrieved May 5, 2023, from https://tinyurl.com/3ze66xpt
Moore, M. (2021, September). Millennials continue to leave Wyoming and its labor market. Wyoming Labor Force Trends, 58(9). Research & Planning, WY DWS. Retrieved May 5, 2023, from https://doe.state.wy.us/LMI/trends/0921/0921.pdf
National Bureau of Economic Research (2023, March). U.S. business cycle expansions and contractions. Retrieved July 7, 2023, from https://www.nber.org/research/data/us-business-cycle-expansions-and-contractions

 Wyoming at Work
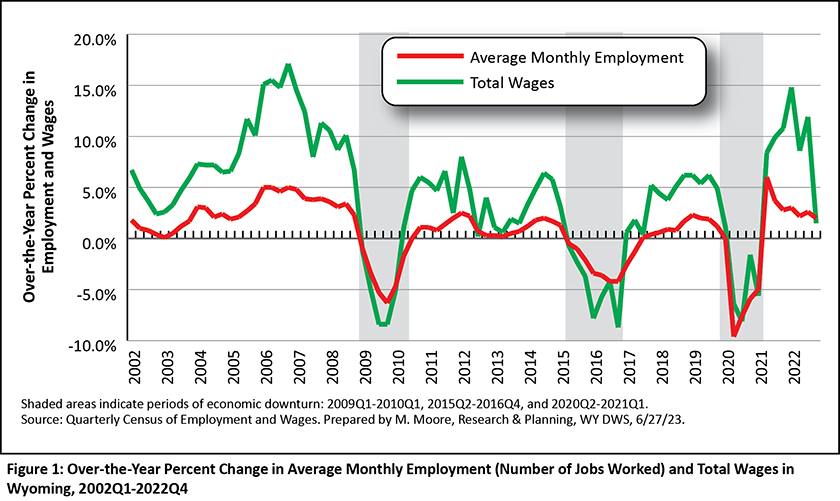