"Labor Market Information (LMI) is an applied science; it is the systematic collection and analysis of data which describes and predicts the relationship between labor demand and supply." The States' Labor Market Information Review, ICESA, 1995, p. 7.
by: Michael Moore, Research Supervisor
The 2026 Wyoming Workforce Annual Report from the Research & Planning (R&P) section of the Wyoming Department of Workforce Services, in partnership with the Wyoming Workforce Development Council, provides a wealth of information on Wyoming’s labor market.
The annual report’s authors looked at Wyoming’s labor market in 2025 by using data from numerous sources, including the Quarterly Census of Employment and Wages (QCEW), Wyoming Wage Records, Local Area Unemployment Statistics (LAUS), Unemployment Insurance claims, and more.
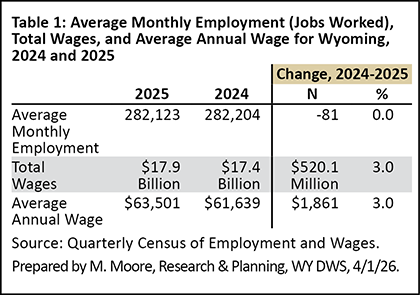
As noted in Chapter 2 of the report, data from the QCEW show that Wyoming saw the first signs of job losses during third and fourth quarter 2025 (2025Q3 and 2025Q4) after 17 consecutive quarters (or more than four years) of over-the-year job growth. At the annual level, Wyoming's average monthly employment for 2025 was 282,123, down slightly (81 jobs, or 0.0%) compared to 2024 (see Table 1). Wyoming employers paid $17.9 billion in total wages in 2025, an increase of $520.1 million (3.0%) over the year. Wyoming's average annual wage in 2025 was $63,501, up $1,861 (3.0%) compared to 2024.
Wyoming’s labor force (the sum of all employed and unemployed individuals) was down in 2025, while the unemployment rate was up, according to LAUS data in Chapter 4. The total labor force in 2025 was 289,017, with a 3.4% unemployment rate; this marked the first decrease in the labor force after three consecutive years of growth.
As noted in Chapter 6 of the report, Wage Records show a total of 347,129 total persons working in Wyoming at any time during the year, a decrease of 1.7%. In recent years, Wyoming has seen a decrease in resident male and female workers, and an increase of nonresident workers, or those for whom demographic data are not available. Nonresidents are typically individuals who commute to Wyoming from another state or country for work, or individuals who moved to Wyoming for work but did not yet establish residency.
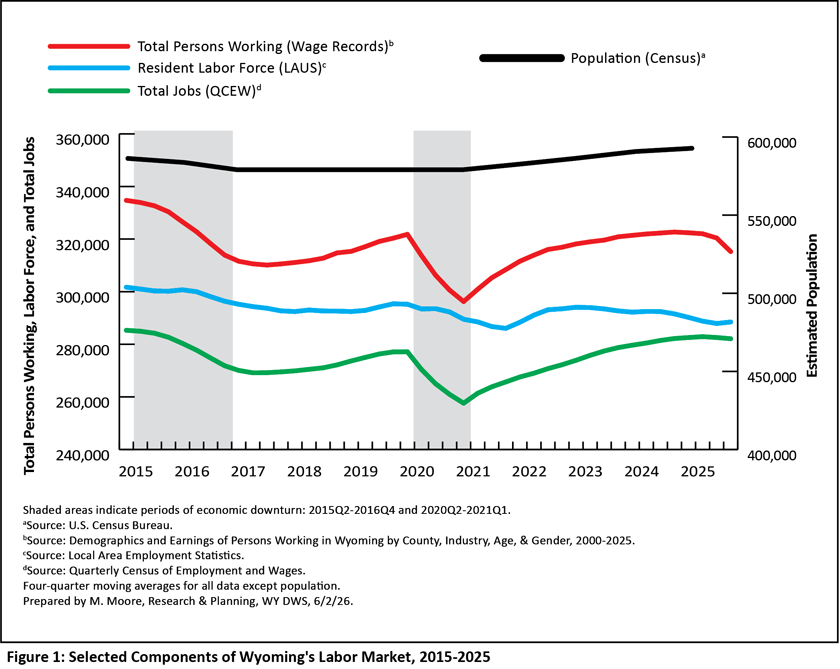
Figure 1 provides a snapshot of Wyoming's labor market over the last 10 years by using data from a variety of the sources discussed in the annual report. The shaded areas represent periods of economic downturn, which R&P defines as a period of at least two consecutive quarters of over-the-year decline in average monthly employment (the number of jobs worked) and total wages based on data from the QCEW. The black line at the top represents Wyoming's estimated population, which has grown each year since 2020. The red line represents the total number of persons working based on Wage Records, and the blue line indicates Wyoming's resident labor force, based on LAUS estimates. Finally, the green line represents Wyoming's average monthly employment (total jobs worked) based on the QCEW.
As is evident in Figure 1, the number of jobs worked from the QCEW (green line) and the total number of persons working from Wage Records (red line) follow very similar patterns and decrease substantially during economic downturns. When Wyoming loses jobs, there are far fewer opportunities for people to work in the state. Both of these metrics steadily increased from 2021 on, but decreased slightly during the second half of 2025.
The new report is available online at https://doe.state.wy.us/LMI/annual_report.htm.
The following are some of the specific locations on our website that may have useful information for you as you consider your employment options: