Wyoming Labor Force Trends
April 2025 | Volume 62, No. 4
Click Here for PDF
Return to Table of Contents
2024Q3 Quarterly Update
Wyoming Sees 3-plus Years of Over-the-Year Job Gains
by: Michael Moore, Research Supervisor
This article provides an overview of Wyoming’s employment and wages in third quarter 2024 at the county and industry levels, in order to identify areas of over-the-year job growth. This also includes a discussion on growth at the subsector level to determine more specific job growth.
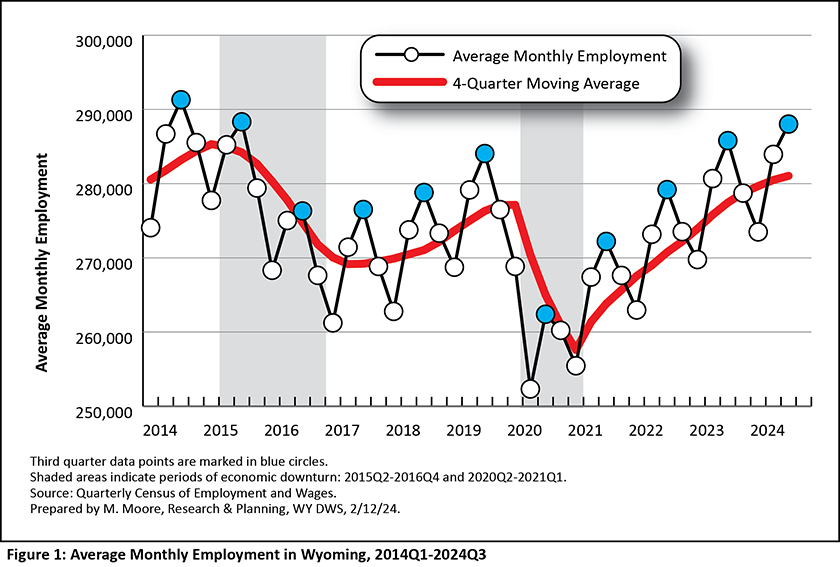
Third quarter 2024 (2024Q3) marked the 14th consecutive quarter of over-the-year job growth for Wyoming, as the state added more than 2,200 new jobs, an increase of 0.8% (see Table 1). Employment typically peaks in the third quarter each year, as Wyoming employers add more employees during the warm summer months (see Figure 1).
This article looks at quarterly employment and wages at the county and industry levels for 2024Q3 in Wyoming. As discussed in this article, several industries saw job losses compared to 2023Q3. However, even those industries saw some growth at the more detailed three-digit subsector level. This article looks at 20 subsectors with strong over-the-year job growth.
The data discussed in this article are from the Quarterly Census of Employment and Wages (QCEW). Data from 2024Q3 are available at https://doe.state.wy.us/LMI/24Q3_QCEW/toc.htm.
Introduction
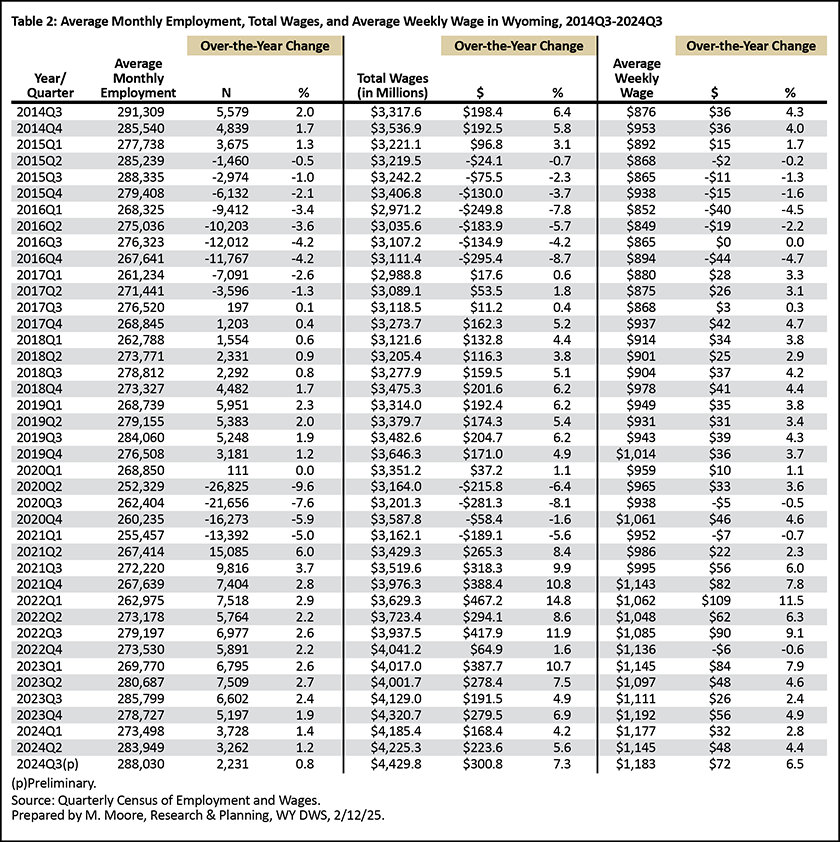
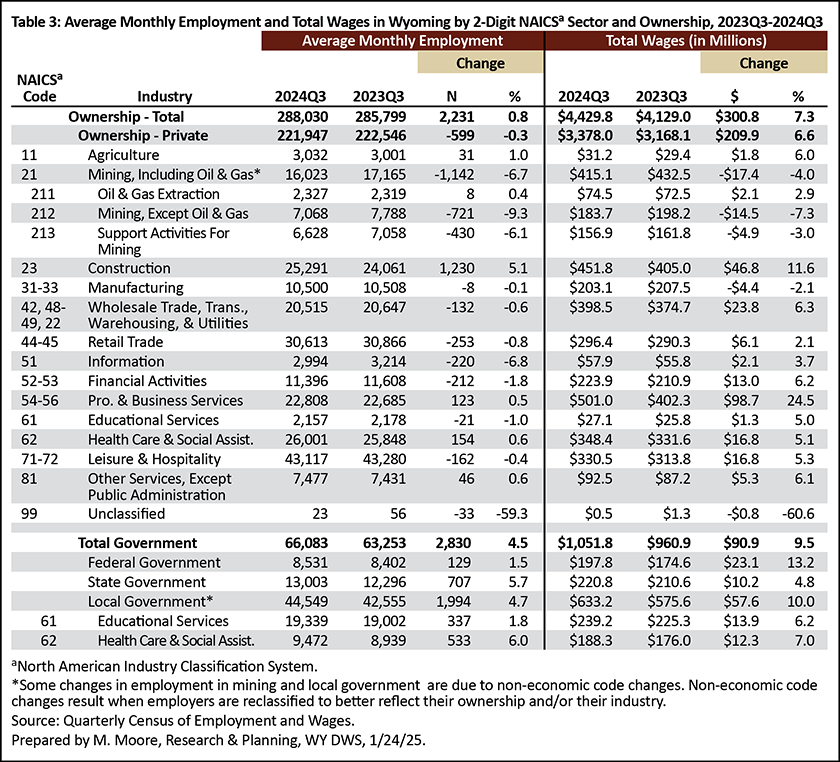
Wyoming’s average monthly employment in 2024Q3 was 288,030, an increase of 2,231 jobs (0.8%) compared to 2023Q3 (see Table 2). The state had $4.2 billion in total wages, up $300.8 million (7.3%) over the year. Wyoming's average weekly wage increased from $1,111 to $1,183 ($72, or 6.5%).
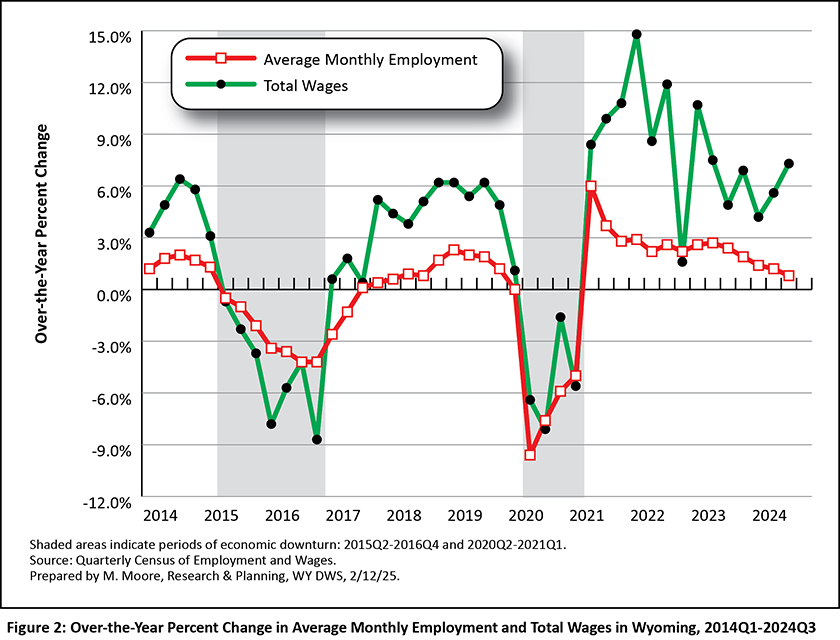
The shaded areas in the figures in this article represent periods of economic downturn. The Research & Planning (R&P) section of the Wyoming Department of Workforce Services has defined an economic downturn as a period of at least two consecutive quarters of over-the-year decreases in average monthly employment and total wages based on data from the QCEW. Wyoming has endured three such economic downturns since 2009: 2009Q1 to 2010Q1, 2015Q2 to 2016Q4, and 2020Q2 to 2021Q1 (see Figure 2). Wyoming’s most recent downturn was influenced by the COVID-19 pandemic and declines in the prices of and demand for the state’s energy resources. While each downturn had its own unique circumstances, declining energy prices preceded all three (Moore, 2019).
Industry
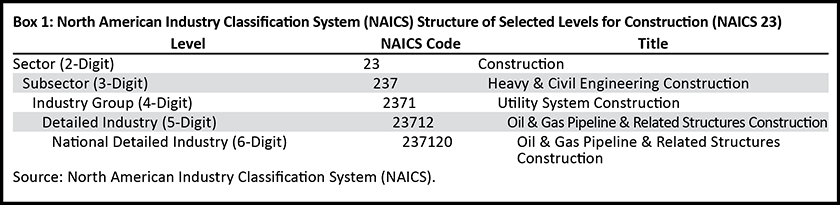
Industries are organized by the North American Industry Classification System (NAICS). A sample of the NAICS hierarchal structure for construction (NAICS 23) can be found in Box 1. This article primarily discusses statewide employment and wages at the sector (or two-digit NAICS) level.
As shown in Table 3, construction led all industries with 1,230 new jobs, a 5.1% over-the-year increase. Smaller job gains were also seen in health care & social assistance (154, or 0.6%); other services, except public administration (46, or 0.6%); and agriculture (31, or 1.0%). Job losses were seen in retail trade (-253, or -0.8%), financial activities (-212, or -1.8%), and leisure & hospitality (-162, or -0.4%), among others. Wyoming's mining sector lost 1,142 jobs (-6.7%); however, several of these job losses were due to non-economic code changes, as were job gains in local government (Moore, 2024).
Local government (including schools and hospitals) accounted for the largest share (15.5%) of Wyoming's total employment in 2024Q3. Local government comprises employment and wages in Wyoming's counties, cities, towns, school districts, community colleges, tribal governments, and other municipalities. Other industries that accounted for substantial shares of employment included leisure & hospitality (15.0%), retail trade (10.6%), health care & social assistance (9.0%), and construction (8.8%).
Wyoming had $4.4 billion in total wages in 2024Q3, an over-the-year increase of $300.8 million, or 7.3%. The greatest over-the-year increases in wages were seen in professional & business services ($98.7 million, or 24.5%), construction ($46.8 million, or 11.6%), and wholesale trade, transportation, & utilities ($23.8 million, or 6.3%).
Local government contributed the greatest share (14.3%) of all wages, followed by professional & business services (11.3%); construction (10.2%); mining, including oil & gas (9.4%); and wholesale trade, transportation, & utilities (9.0%).
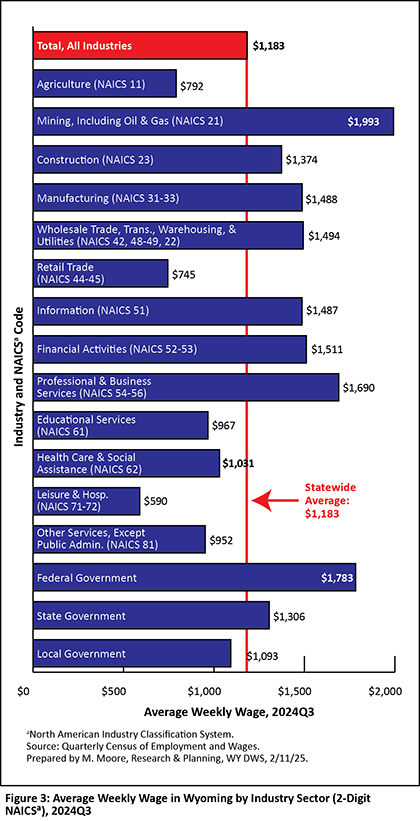
Wyoming's average weekly wage in 2024Q3 was $1,183 (see Figure 3). The highest wages were seen in mining, including oil & gas ($1,993); federal government ($1,783); professional & business services ($1,690); and financial activities ($1,511). The industries with the lowest wages were leisure & hospitality ($590), retail trade ($745), and agriculture ($792).
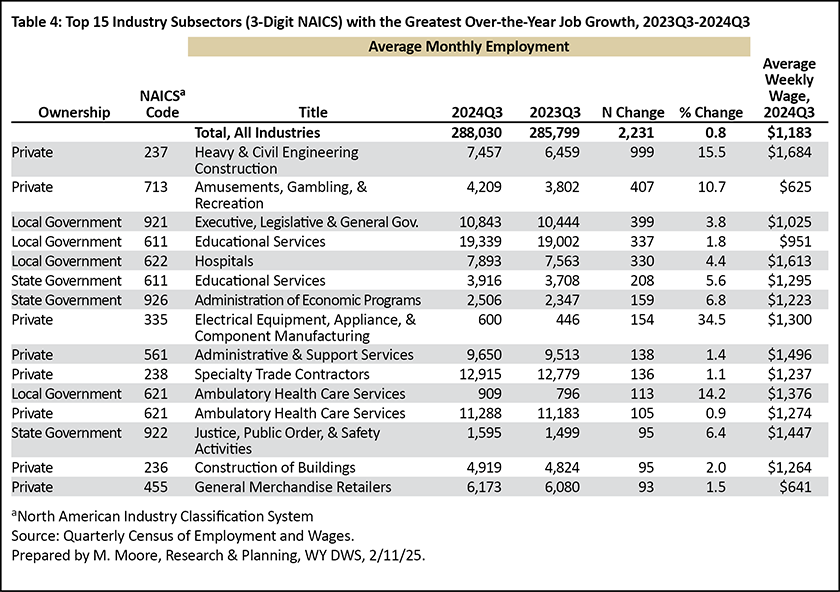
Table 4 shows the 15 industry subsectors (three-digit NAICS) with the greatest over-the-year job growth in Wyoming. The greatest job growth was found in heavy & civil engineering construction (999 new jobs, or 15.5%), followed by amusements, gambling, & recreation (407, or 10.7%). Other private subsectors that showed over-the-year job growth included electrical equipment, appliance, & component manufacturing (154, or 34.5%); administrative & support services (138, or 1.4%); specialty trade contractors (136, or 1.1%); and ambulatory health care services (105, or 0.9%).
Local government subsectors that showed substantial over-the-year job growth included executive, legislative, & general government (399, or 3.8%); educational services (337, or 1.8%); and hospitals (330, or 4.4%). State government employment increased in educational services (208, or 5.6%), administration of economic programs (159, or 6.8%), and justice, public order, & safety activities (95, or 6.4%).
County
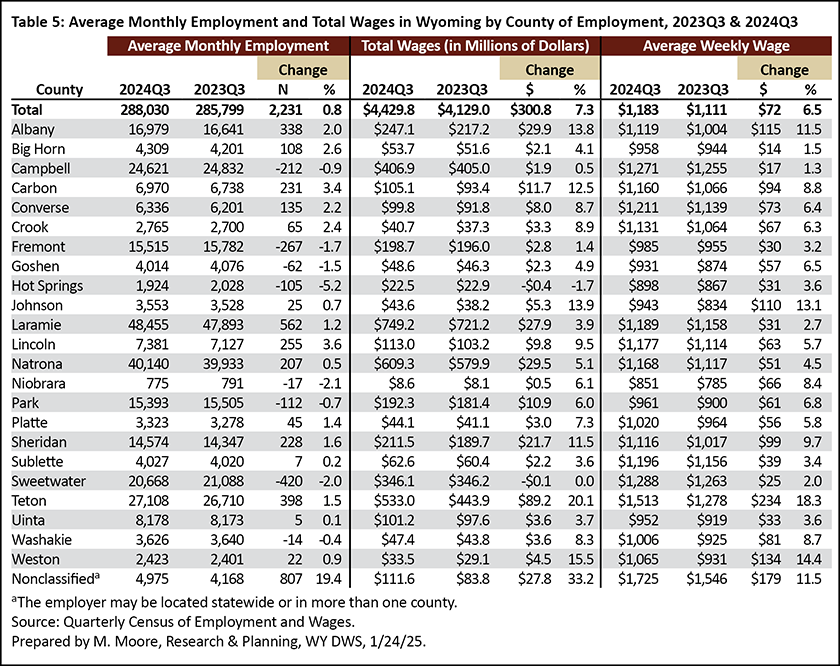
Over-the-year job growth occurred in 15 of Wyoming's 23 counties (see Table 5). Laramie County added the greatest number of jobs (562, or 1.2%), followed by Teton (398, or 1.5%), Albany (338, or 2.0%), Lincoln (255, or 3.6%), and Carbon (231, or 3.4%) counties.
The counties that lost jobs over the year included Sweetwater (-420, or -2.0%), Fremont (-267, or -1.7%), Campbell (-212, or -0.9%), and Park (-112, or -0.7%) counties.
The counties with the greatest over-the-year growth in total wages were Teton ($89.2 million, or 20.1%), Albany ($29.9 million, or 13.8%), Natrona ($29.5 million, or 5.1%), and Laramie ($27.9 million, or 3.9%) counties.
Teton County had the highest average weekly wage ($1,513), followed by Sweetwater ($1,288), Campbell ($1,271), Converse ($1,211), and Sublette ($1,196) counties.
Conclusion
Third quarter 2024 marked the 14th consecutive quarter of over-the-year job growth for Wyoming, as the state added more than 2,200 jobs and $300.8 million in total wages. Construction drove the state's job growth, with 1,230 new jobs. Job gains also were seen in health care & social assistance; other services, except public administration; and agriculture. However, those job gains were partially offset by job losses in mining, retail trade, financial activities, and leisure & hospitality, among others.
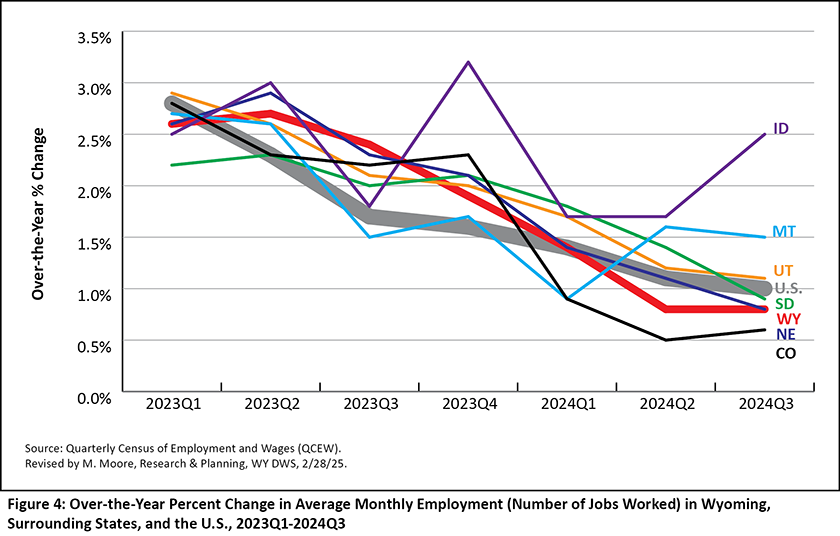
Wyoming's over-the-year job growth has slowed in recent quarters, from 2.4% in 2023Q3 to 0.8% in 2024Q3. However, slowing job growth is not unique to Wyoming. As shown in Figure 4, job growth also slowed nationally and in many of Wyoming's surrounding states. The exceptions were Idaho and Montana, which grew at faster rates during the first three quarters of 2024. Colorado's over-the-year job growth especially decreased in recent quarters, from 2.3% in 2023Q4 to 0.5% and 0.6% in 2024Q2 and 2024Q3, respectively.
Quarterly employment and wage data for Wyoming from the QCEW are available online at https://doe.state.wy.us/LMI/toc_202.htm. Data for 2024Q4 will be released on May 9, 2025, with a feature article planned for the July 2025 issue of Wyoming Labor Force Trends.
References
Moore, M. (2019, May). Chapter 1: Introduction — Driven by demographics and downturns: Wyoming’s 2018 labor market at a glance. 2019 Wyoming Workforce Annual Report. Research & Planning, WY DWS. Retrieved February 28, 2025, from https://doe.state.wy.us/LMI/annual-report/2019/2019_Annual_Report.pdf
Moore, M. (2024, October). 2024Q1 quarterly update: Wyoming jobs, total wages grow for 12th consecutive quarter. Wyoming Labor Force Trends, 61(10). Retrieved February 28, 2025, from https://doe.state.wy.us/LMI/trends/1024/a1.htm
 Hire Wyo
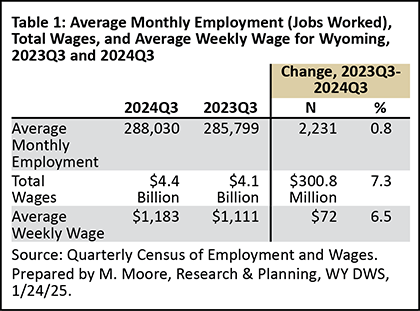