Wyoming Labor Force Trends
April 2023 | Volume 60, No. 4
Click Here for PDF
Return to Table of Contents
Wyoming Adds Nearly 6,000 Jobs, $397 Million in Total Wages
by: Michael Moore, Research Supervisor
This article provides an overview of Wyoming’s employment and wages in third quarter 2022, as the state saw over-the-year increases in employment and wages for the sixth consecutive quarter. The data presented in this article are from the Quarterly Census of Employment and Wages, available online at https://doe.state.wy.us/LMI/toc_202.htm.
Wyoming added nearly 6,000 jobs and $396.7 million in total wages over the year in third quarter 2022 (2022Q3) as the state continued to recover from it most recent economic downturn (see Table 1). While total employment has not yet returned to pre-pandemic levels, 2022Q3 marked the sixth consecutive quarter of over-the-year growth in employment and total wages.
This article compares data from 2022Q3 to data from the prior year at the county and industry levels in order to obtain a better understanding of how different industries and counties are recovering from economic disruptions caused by the COVID-19 pandemic and job losses in the energy sector.
The data in this article are from the Quarterly Census of Employment and Wages (QCEW). Data from 2022Q3 are available at https://doe.state.wy.us/LMI/22Q3_QCEW/toc.htm.
Introduction
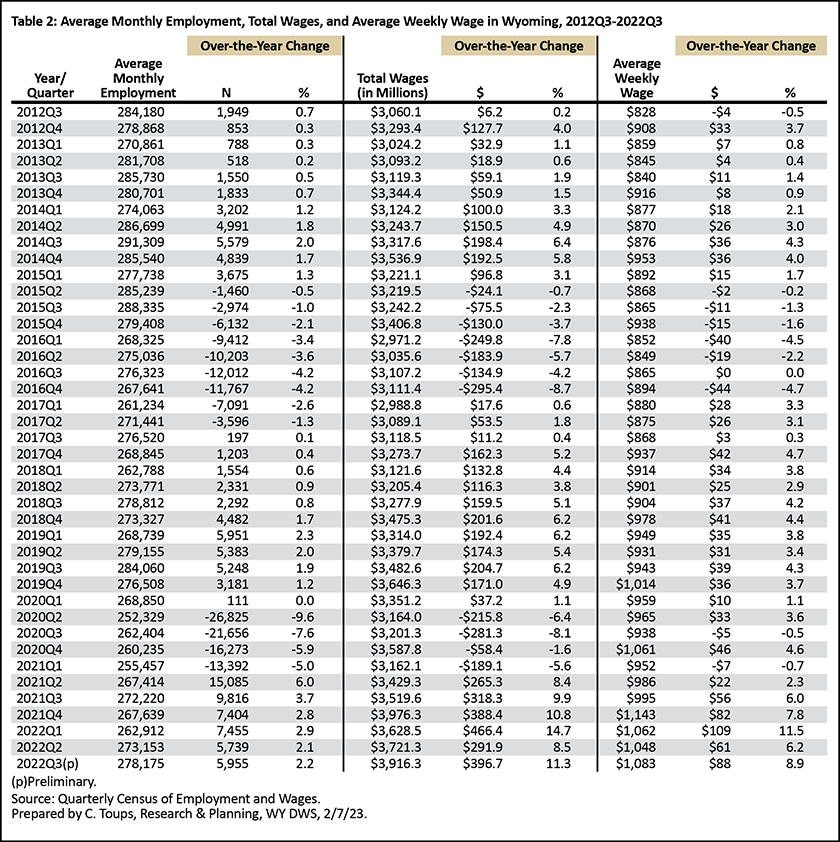
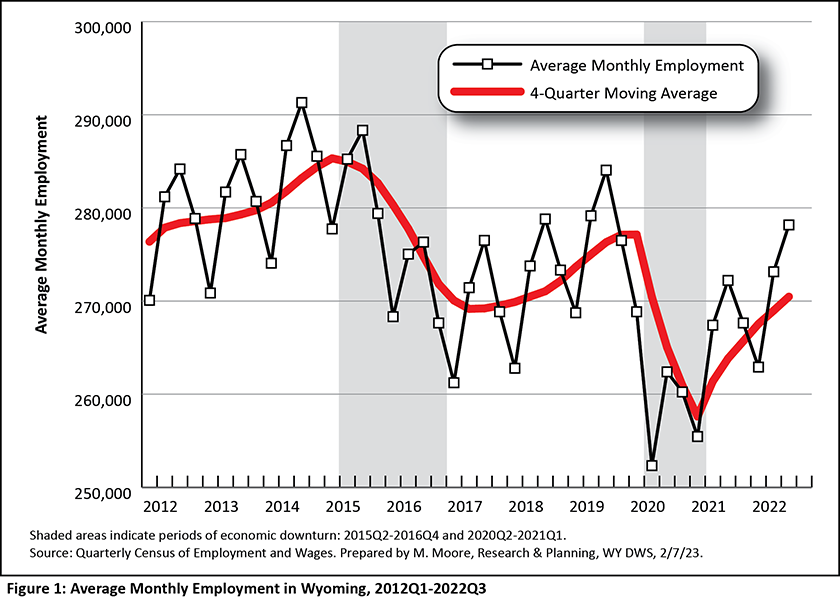
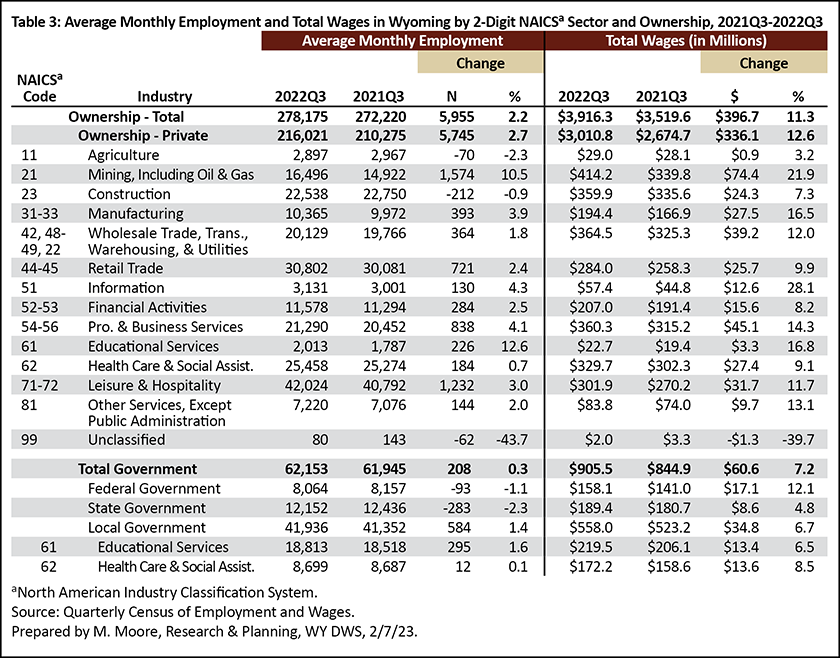
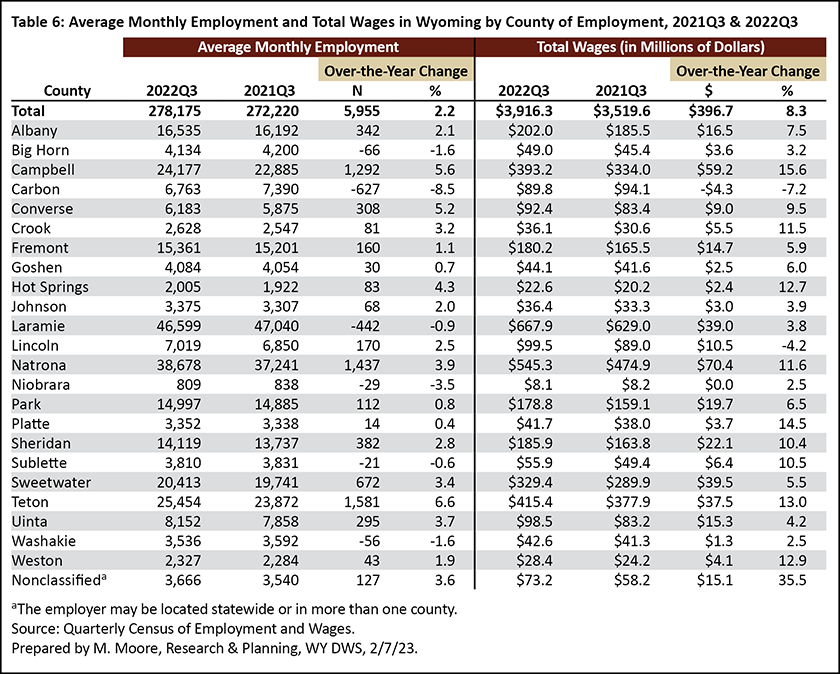
Wyoming’s average monthly employment in 2022Q3 was 278,175, an increase of 5,955 jobs (2.2%) compared to 2021Q3 (see Table 2). Total wages increased from $3.5 billion to $3.9 billion over the year ($396.7 million, or 11.3%) while the state's average weekly wage increased from $995 to $1,083 ($88, or 8.9%). Wyoming employment tends to peak during the third quarter (see Figure 1), as the warm summer months bring more jobs in industries such as construction and leisure & hospitality.
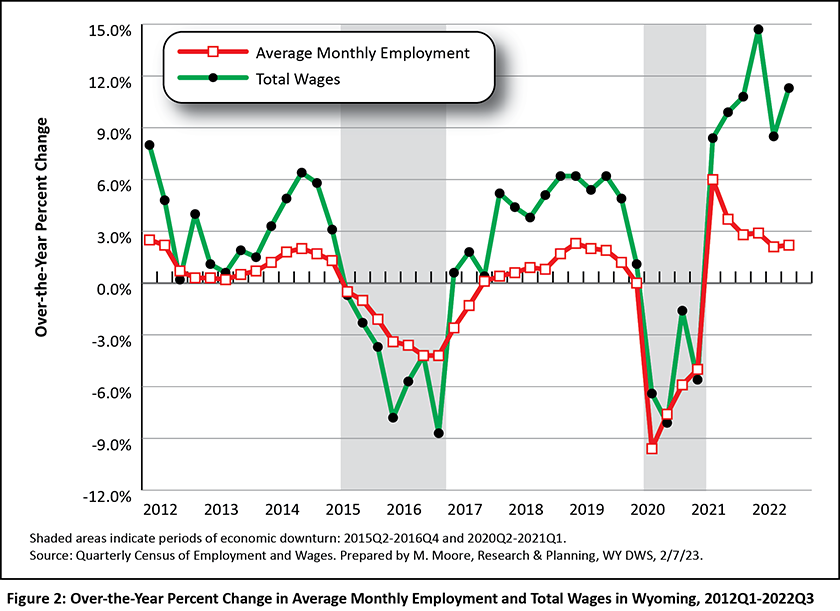
The Research & Planning (R&P) section of the Wyoming Department of Workforce Services has defined an economic downturn as a period of at least two consecutive quarters of over-the-year decreases in average monthly employment and total wages based on data from the QCEW (see Figure 2). Wyoming has endured three such economic downturns since 2009: 2009Q1 to 2010Q1, 2015Q2 to 2016Q4, and 2020Q2 to 2021Q1.
Wyoming’s most recent downturn was influenced by the COVID-19 pandemic and declines in the prices of and demand for the state’s energy resources. While each downturn had its own unique circumstances, declining energy prices preceded all three (Moore, 2019).
As previously mentioned, Wyoming has not returned to pre-pandemic employment levels. In 2022Q3, Wyoming had 5,885 fewer jobs (-2.1%) compared to 2019Q3 (see Table 2).
Industry
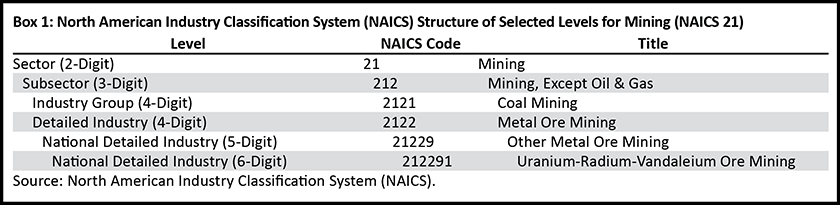
Industries are organized by the North American Industry Classification System (NAICS). A sample of the NAICS hierarchal structure for mining (NAICS 21) can be found in Box 1.
Table 3 shows employment and wages at the two-digit sector level. Most industries showed substantial over-the-year employment gains, led by mining, including oil & gas (1,574 more jobs, or 10.5%) and leisure & hospitality (1,232, or 3.0%). In fact, mining and leisure & hospitality accounted for nearly half (47.1%) of the 5,955 new jobs over the year. Other industries with substantial over-the-year job growth included professional & business services (838, or 4.1%), retail trade (721, or 2.4%), and manufacturing (393, or 3.9%). Job losses were seen in state government (-283, or -2.3%), construction (-212, or -0.9%), federal government (-93, or -1.1%), and agriculture (-70, or -2.3%).
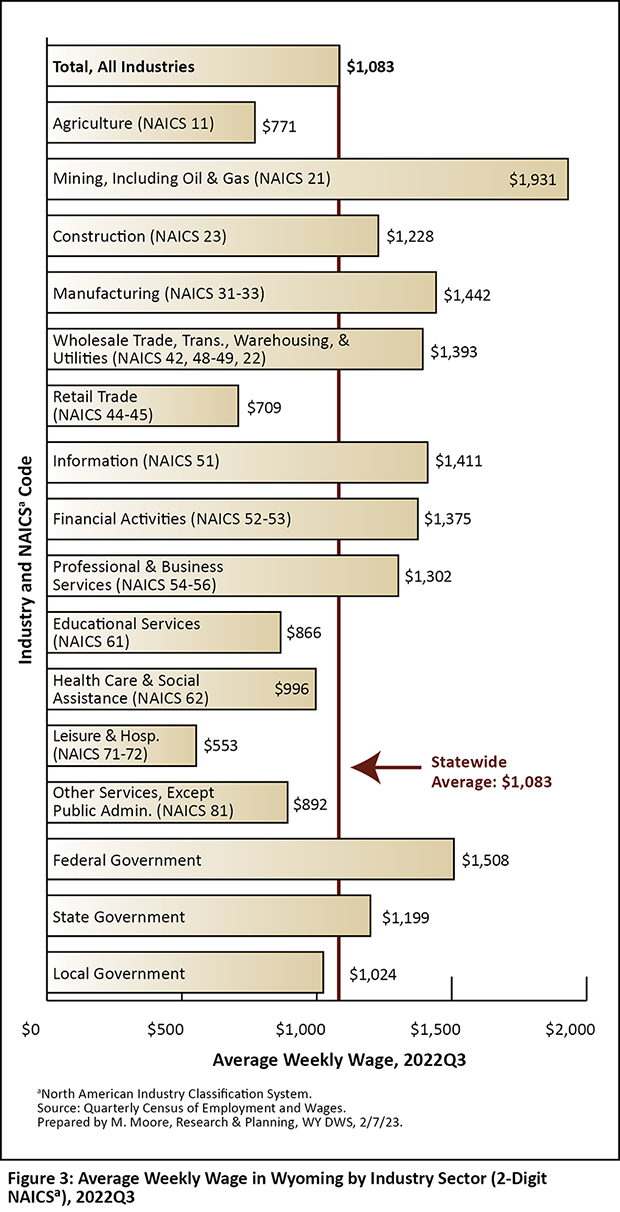
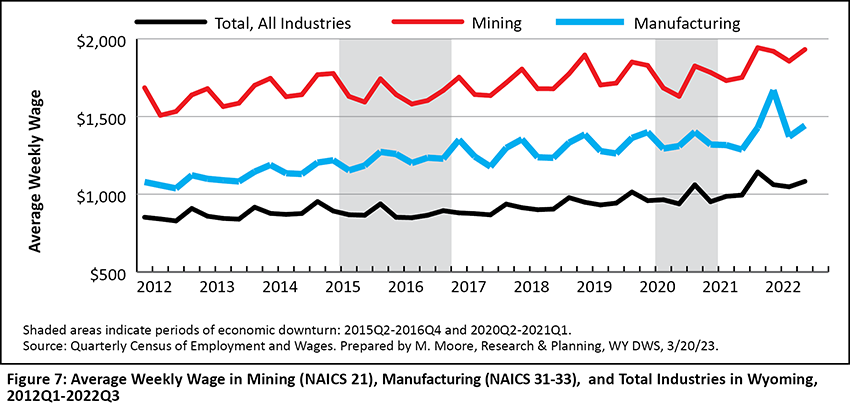
Across all industries, Wyoming's average weekly wage in 2022Q3 was $1,083 (see Figure 3). The highest weekly wages were found in mining, including oil & gas ($1,931), federal government ($1,508), manufacturing ($1,442), and information ($1,411). The industries with the lowest weekly wages were leisure & hospitality ($553), retail trade ($709), and agriculture ($771).
This article includes detailed employment and wage information for Wyoming's mining and manufacturing sectors. Table 4 and Table 5 provide detailed information for selected subsectors (three-digit), industry groups (four-digit), and detailed national industries (six-digit) in mining and manufacturing, respectively. Figures 4-7 illustrate employment and wage trends in mining and manufacturing over the last 10 years.
Similar tables and figures are available for each industry at https://doe.state.wy.us/LMI/QCEW_OTY/toc.htm.
Mining, Including Oil & Gas (NAICS 21)
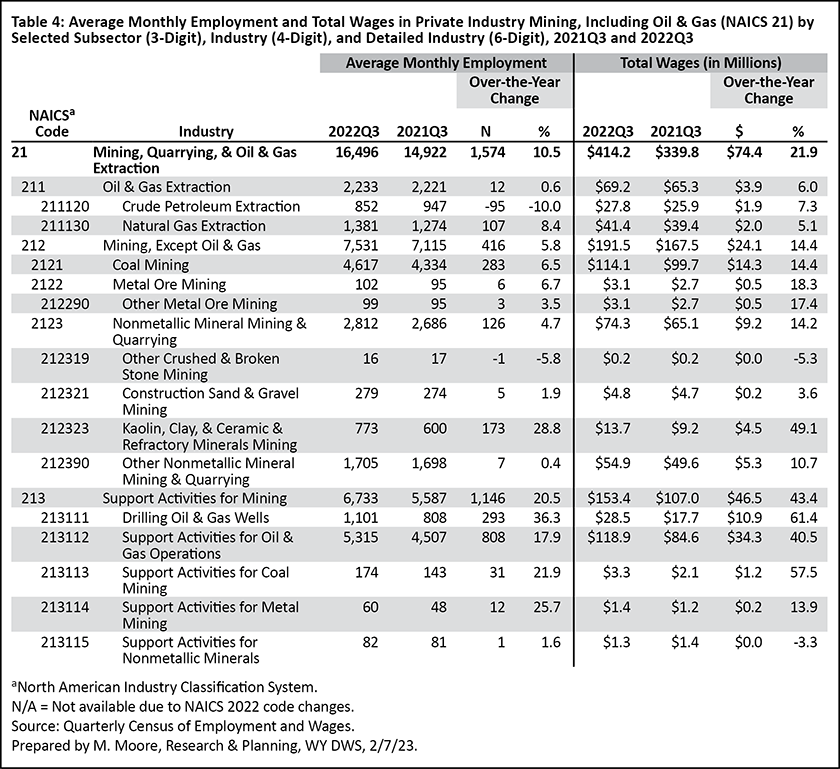
Wyoming's mining sector (NAICS 21) is comprised of three subsectors (see Table 4): oil & gas extraction (NAICS 211), mining, except oil & gas (NAICS 212), and support activities for mining (NAICS 213).
Overall, Wyoming's mining sector added 1,574 jobs from 2021Q3 to 2022Q3, an increase of 10.5%. Of the three subsectors, the greatest over-the-year job increases in 2022Q3 were found in support activities for mining (1,146 new jobs, or 20.5%). Within this subsector, the largest job growth occurred in support activities for oil & gas operations (808, or 17.9%) and drilling oil & gas wells (293, or 36.3%).
Mining, except oil & gas added 416 new jobs over the year, an increase of 5.8%. This subsector includes coal mining, which added 283 new jobs, an increase of 6.5%. In fact, 2022Q3 marked the third consecutive quarter of over-the-year job growth in coal mining. The last time coal mining experienced three quarters of over-the-year job growth was from 2017Q3 to 2018Q1. As noted by Moore (2023), employment in coal mining steadily decreased over the last 10 years, though some job gains were seen in recent quarters.
Oil & gas extraction increased slightly from 2,221 in 2021Q3 to 2,233 in 2022Q3 (12 jobs, or 0.6%).
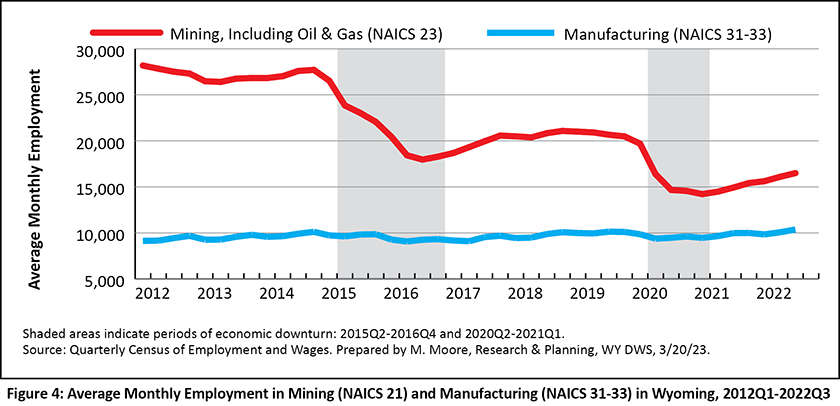
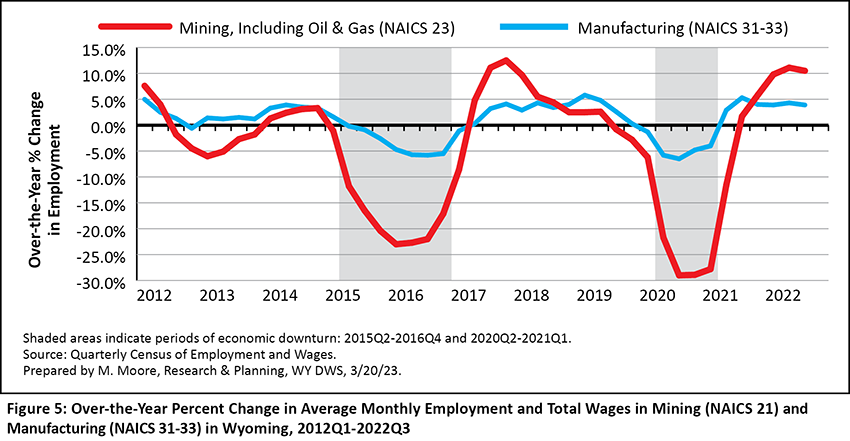
As previously mentioned, Wyoming's recent downturns were preceded by declining energy prices and driven by job losses in mining (see Figure 4 and Figure 5). Regarding the economic downturn that lasted from 2015Q2 to 2016Q4, Gallagher (2016) noted the “substantial decline in the prices of oil, an extended period of low natural gas prices, and the erosion in the price of coal." During that downturn, Wyoming lost approximately one-third of its mining jobs as employment fell from 26,527 in 2015Q1 just prior to the downturn to 17,961 in 2016Q3 (-8,566 jobs, or -32.3%).
Mining then experienced moderate job growth from 2017 to 2019; however, job losses in mining preceded the COVID-19 pandemic by three quarters, and employment fell to a decade low of 14,216 in 2021Q1. Mining continued losing jobs through 2021Q2, but as of 2022Q3 has seen over-the-year job growth for five consecutive quarters. Mining employment has not returned to pre-pandemic levels.
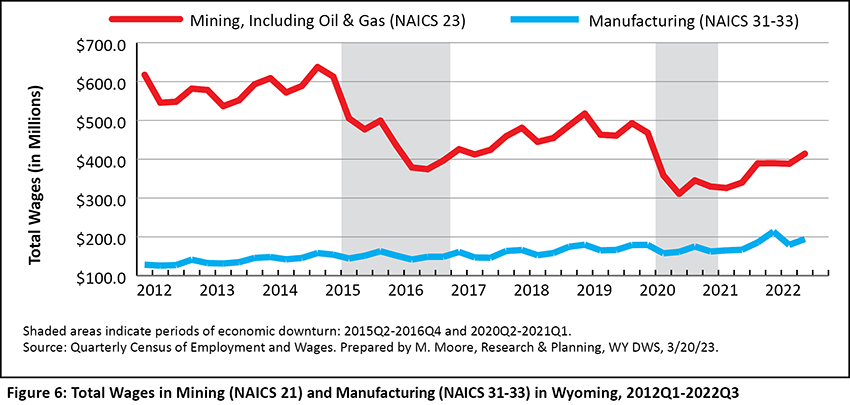
Mining has historically contributed more wages to the statewide total than any other industry. For example, Bullard (2015) noted that in 2015Q1, mining paid 19.0% of the state's total wages, or approximately $1 of every $5 of total payroll. But as illustrated in Figure 6, total wages in mining have decreased substantially since the 2015-2016 economic downturn. Total wages peaked at $637.4 million in 2014Q4, and fell to a decade low of $310.8 million in 2020Q3. In 2022Q3, mining contributed 10.6% to the state's total wages, or approximately $1 of every $10 of total payroll.
As previously mentioned, mining had the highest average weekly wage of all industries in 2022Q3 ($1,931 compared to $1,083 across all industries).
High wages in mining have remained constant over the last decade (see Figure 7).
Manufacturing (NAICS 31-33)
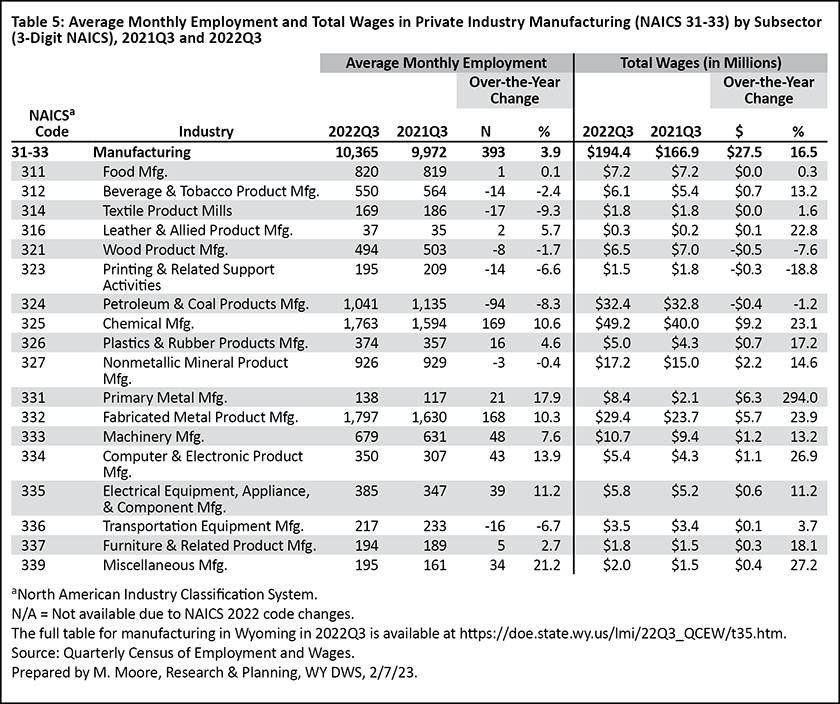
The manufacturing sector (NAICS 31-33) is comprised of nearly 20 subsectors (see Table 5). In Wyoming, the subsectors with the highest average monthly employment in 2022Q3 were fabricated metal product manufacturing (1,797), chemical manufacturing (1,763), and petroleum & coal products manufacturing (1,041). Many of the manufacturing subsectors direcly support Wyoming's mining industry.
Manufacturing employment increased from 9,972 in 2021Q3 to 10,365 in 2022Q3 (393 new jobs, or 3.9%). At the subsector level, the greatest increases were seen in chemical manufacturing (169 new jobs, or 10.6%) and fabricated metal product manufacturing (168, or 10.3%).
As of 2022Q3, Wyoming's manufacturing sector experienced six consecutive quarters of over-the-year job growth. As illustrated in Figure 4 and Figure 5, manufacturing has not historically seen the rapid expansions and contractions as the mining industry. For example, Wyoming's mining sector lost more than 5,000 jobs (or 26.5% of the total) during the most recent downturn from 2020Q1 to 2021Q1. In contrast, manufacturing lost just over 200 jobs, or 2.1%.
In 2022Q3, manufacturing had $194.4 million in total wages, or 5.0% of the state's total wages. The average weekly wage for manufacturing was $1,442, higher than the statewide average of $1,083 and the second highest of all private industries behind mining.
County
All but six of Wyoming's 23 counties experienced over the-year job growth in 2022Q3 (see Table 6). The counties with the greatest increases in average monthly employment included Teton (1,581, or 6.6%), Natrona (1,437, or 3.9%), Campbell (1,292, or 5.6%), and Sweetwater (672, or 3.4%) counties. The greatest job losses were seen in Carbon (-627, or -8.5%) and Laramie (-442, or -0.9%) counties. Approximately two-thirds of Carbon County's job losses were in construction (Research & Planning, 2023a). In Laramie County, job growth in industries like manufacturing, wholesale trade, and retail trade were offset by substantial job losses in construction (Research & Planning, 2023b).
All but two counties (Carbon and Lincoln) saw over-the-year growth in total wages, with the greatest increases found in Natrona ($70.4 million, or 11.6%), Campbell ($59.2 million, or 15.6%), Sweetwater ($39.5 million, or 5.5%), and Laramie ($39.0 million, or 3.8%) counties.
Pre-Pandemic Levels
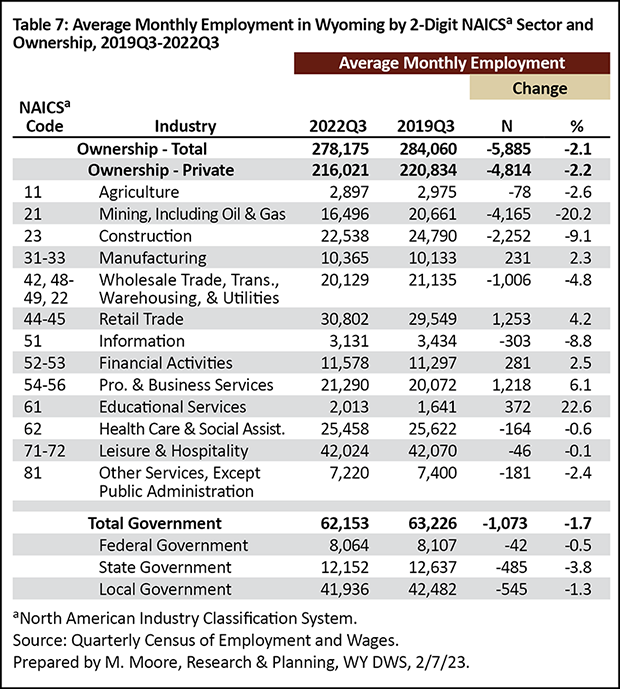
Wyoming has not returned to pre-pandemic employment levels, despite six consecutive quarters of over-the-year growth. In 2022Q3, Wyoming had 5,885 fewer jobs compared to 2019Q3 (-2.1%; see Table 7).
Industries that were noticeably lower than their pre-pandemic employment levels in 2022Q3 included mining (-4,165, or -20.2%), construction (-2,252, or -9.1%), and wholesale trade, transportation, warehousing, & utilities (-1,006, or -4.8%).
Some industries have surpassed their pre-pandemic employment levels, such as retail trade (1,253, or 4.2%), professional & business services (1,218, or 6.1%), educational services (372, or 22.6%), and manufacturing (231, or 2.3%).
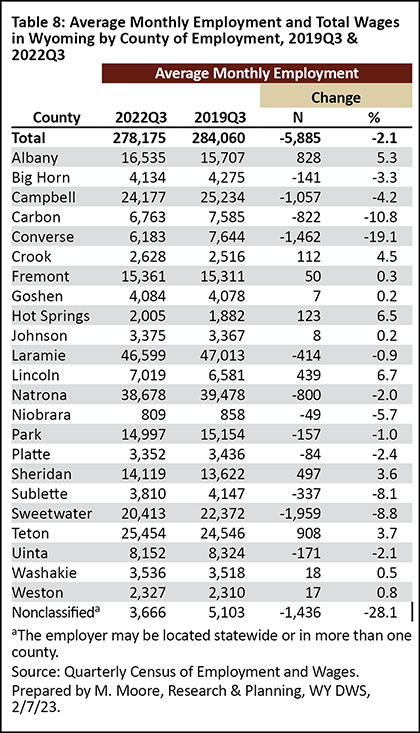
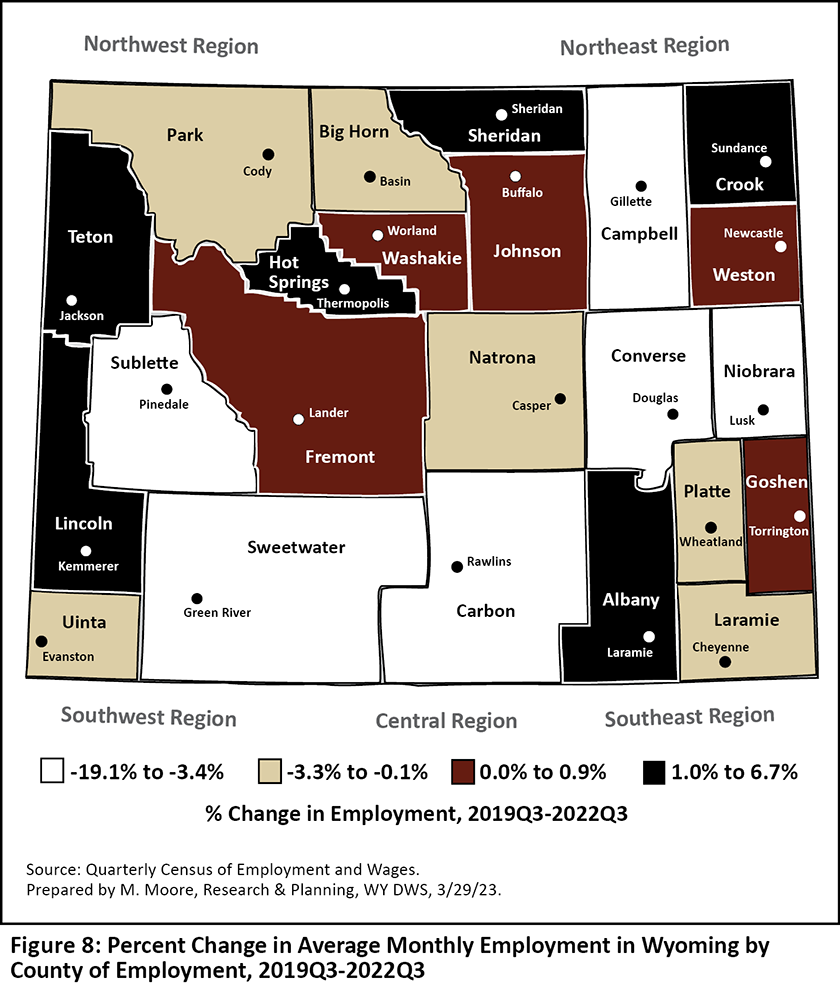
Approximately half (11, or 47.8%) of Wyoming's 23 counties surpassed their pre-pandemic average monthly employment in 2022Q3 (see Table 8 and Figure 8). Teton County, for example, had 908 more jobs (3.7%) in 2022Q3 than in 2019Q3. Other counties that surpassed their employment levels from 2019Q3 included Albany (828, or 5.3%), Sheridan (497, or 3.6%), and Lincoln (439, or 6.7%). Counties with fewer jobs in 2022Q3 compared to 2019Q3 included Sweetwater (-1,959, or -8.8%), Converse (-1,462, or -19.1%), and Campbell (-1,057, or -4.2%).
Conclusion
Wyoming added nearly 6,000 jobs and more than $330 million in total wages from 2021Q3 to 2022Q3, marking the state's sixth consecutive quarter of over-the-year job growth. The industries that added the most jobs included mining, leisure & hospitality, professional & business services, and retail trade.
Wyoming's total employment has not returned to pre-pandemic levels. However, some industries have seen an increase in the number of jobs since the start of the pandemic, including retail trade, professional & business services, educational services, and manufacturing, among others.
Quarterly employment and wage data for Wyoming from the QCEW are available online at https://doe.state.wy.us/LMI/toc_202.htm. Data for 2022Q4 will be released on May 5, 2023, with a feature article planned for the July 2023 issue of Wyoming Labor Force Trends.
References
Bullard, D. (2015). Local jobs and payroll in Wyoming in First Quarter 2015: Job losses appear in the oil & gas sector. Wyoming Labor Force Trends, 10(52). Retrieved December 5, 2022, from https://doe.state.wy.us/LMI/trends/1015/1015.pdf
Gallagher, T. (2016, April). Chapter 1: Economic analysis. Workforce Planning Report 2016, Wyoming Labor Force Trends, 53(4). Retrieved December 5, 2022, from https://doe.state.wy.us/LMI/trends/0416/a1.htm
Moore, M. (2019, May). Chapter 1: Introduction — Driven by demographics and downturns: Wyoming’s 2018 labor market at a glance. 2019 Wyoming Workforce Annual Report. Research & Planning, WY DWS. Retrieved December 6, 2022, from https://doe.state.wy.us/LMI/annual-report/2019/2019_Annual_Report.pdf
Moore, M. (2023, January). 2022Q2 quarterly update: Mining, leisure & hospitality drive job growth in Wyoming. Wyoming Labor Force Trends, 60(1). Retrieved March 21, 2023, from https://doe.state.wy.us/LMI/trends/0123/a1.htm
Research & Planning. (2023a, January). Wyoming Quarterly Census of Employment and Wages (QCEW), third quarter 2022 — Carbon County. Retrieved March 21, 2023, from https://doe.state.wy.us/LMI/22Q3_QCEW/t8.htm
Research & Planning. (2023b, January). Wyoming Quarterly Census of Employment and Wages (QCEW), third quarter 2022 — Laramie County. Retrieved March 21, 2023, from https://doe.state.wy.us/LMI/22Q3_QCEW/t15.htm


 Wyoming at Work
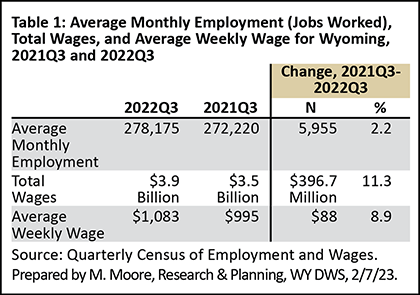