Wyoming Labor Force Trends
March 2026 | Volume 63, No. 3
Click Here for PDF
Return to Table of Contents
2025Q2 Quarterly Update
Minimal Job Growth Continues, Led by Constructionn
by: Michael Moore, Research Supervisor
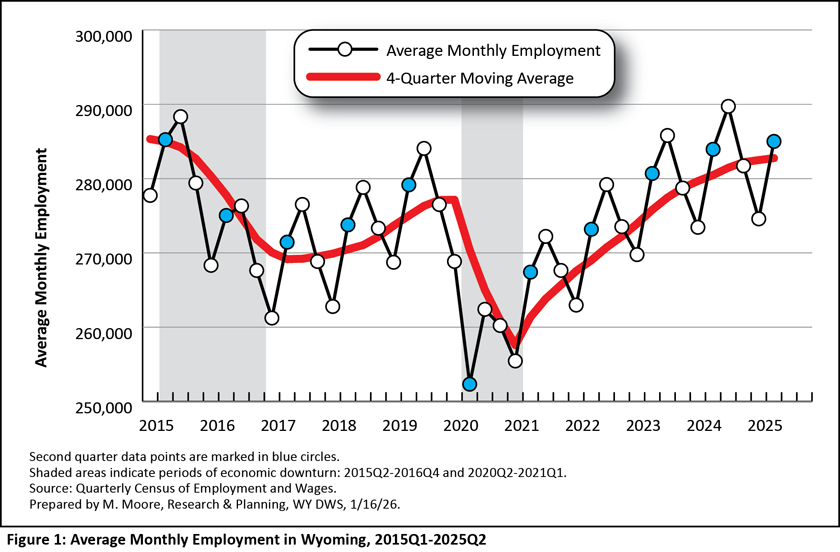
For the second consecutive quarter, Wyoming’s average monthly employment increased 0.4% over the year in second quarter 2025 (2025Q2; see Table 1). The over-the-year job growth of just 0.4% in each of the first two quarters of 2025 marked the slowest back-to-back job growth dating back to 2017Q3 and 2017Q4, when Wyoming was recovering from a lengthy economic downturn. Despite the slow growth, 2025Q2 marked the highest second quarter employment in Wyoming since 2015Q2 (see Figure 1).
This article looks at quarterly employment and wages at the county and industry levels for 2025Q2 in Wyoming.
The data discussed in this article are from the Quarterly Census of Employment and Wages (QCEW). Data from 2025Q2 are available at https://doe.state.wy.us/LMI/25Q2_QCEW/toc.htm.
Introduction
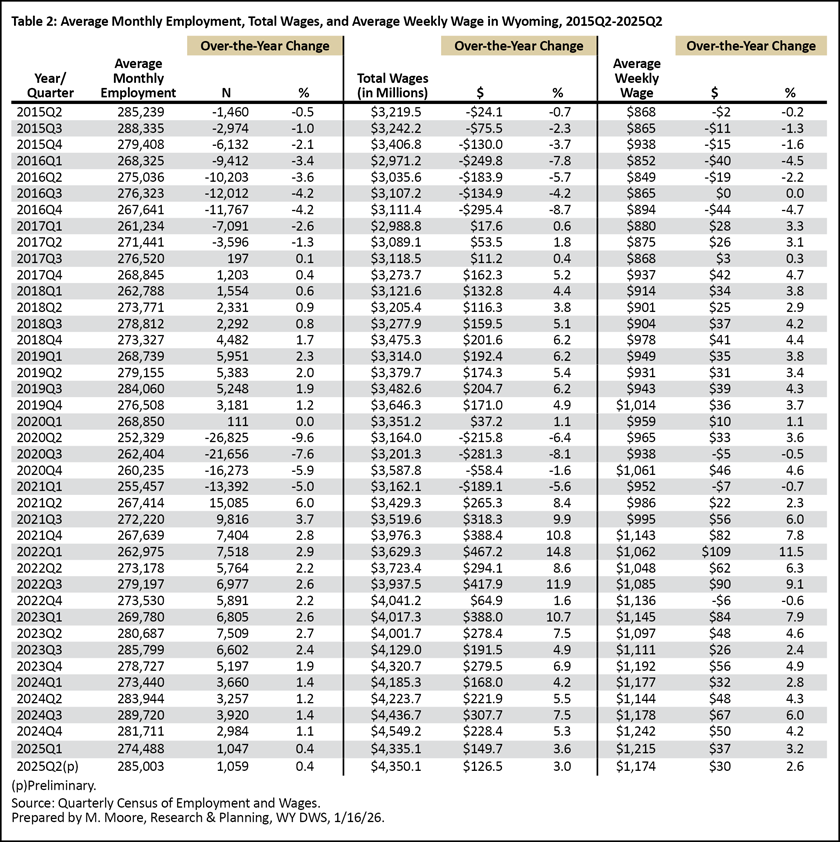
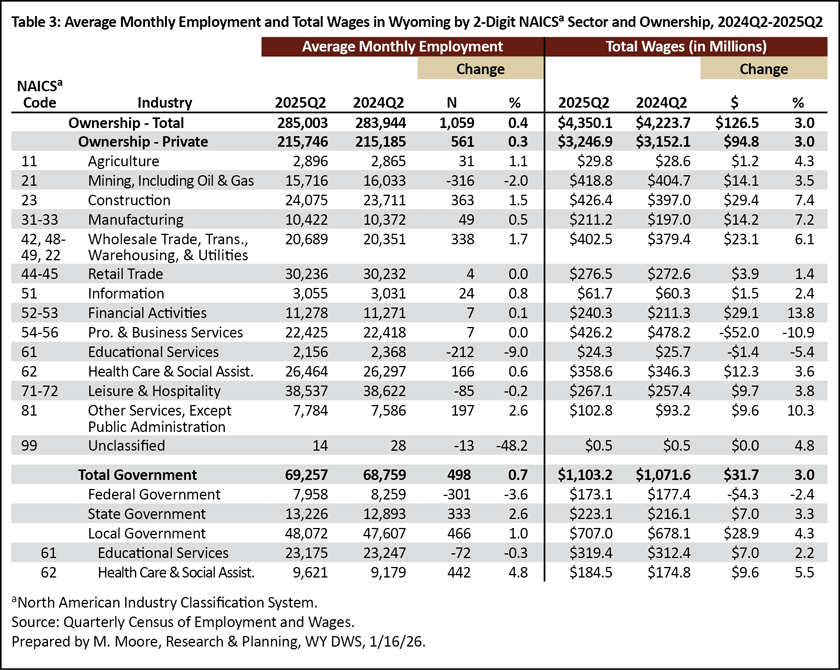
Wyoming’s average monthly employment in 2025Q2 was 285,003, an increase of 1,059 jobs (0.4%) compared to 2024Q2 (see Table 2). The state had $4.4 billion in total wages, up $126.5 million (3.0%) over the year. Wyoming's average weekly wage increased from $1,144 to $1,174 ($30, or 2.6%).
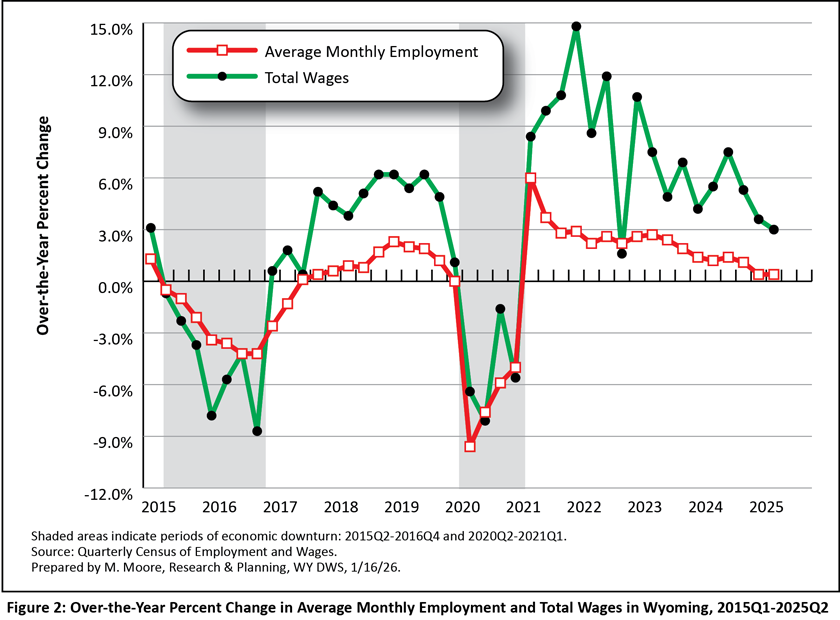
The shaded areas in the figures in this article represent periods of economic downturn. The Research & Planning (R&P) section of the Wyoming Department of Workforce Services has defined an economic downturn as a period of at least two consecutive quarters of over-the-year decreases in average monthly employment and total wages based on data from the QCEW. Wyoming has endured three such economic downturns since 2009: 2009Q1 to 2010Q1, 2015Q2 to 2016Q4, and 2020Q2 to 2021Q1 (see Figure 2). Wyoming’s most recent downturn was influenced by the COVID-19 pandemic and declines in the prices of and demand for the state’s energy resources. While each downturn had its own unique circumstances, declining energy prices preceded all three (Moore, 2019).
Industry
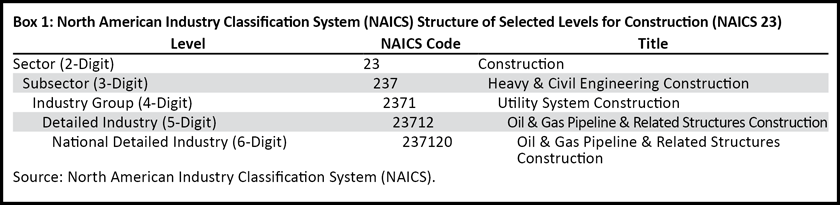
Industries are organized by the North American Industry Classification System (NAICS). A sample of the NAICS hierarchal structure for construction (NAICS 23) can be found in Box 1. This section of the article primarily discusses statewide employment and wages at the sector (or two-digit NAICS) level, along with a more detailed focus on Wyoming's mining (including oil & gas) and construction sectors.
As shown in Table 3, the private industries that added the most jobs over the year were construction (363 new jobs, or 1.5%); wholesale trade, transportation, & utilities (338, or 1.7%); health care & social assistance (166, or 0.6%); and other services, except public administration (197, or 2.6%). Job gains also were seen in local (466, or 1.0%) and state (333, or 2.6%) government.
Mining (including oil & gas) led all industries in job losses (-316, or -2.0%), followed by educational services (-212, or -9.0%), and leisure & hospitality -85, or -0.2%). Federal government employment decreased by 301 jobs (-3.6%).
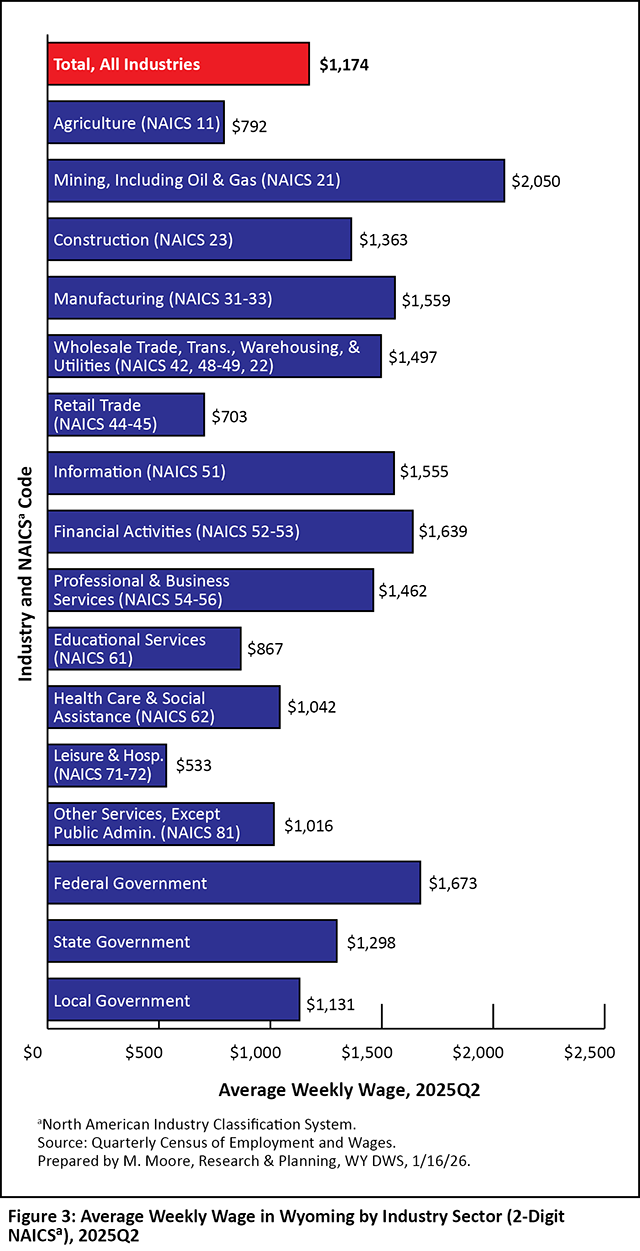
Wyoming's average weekly wage in 2025Q2 was $1,174 (see Figure 3). The highest wages were seen in mining, including oil & gas ($2,050); federal government ($1,673); financial activities (1,639); and manufacturing ($1,559). The lowest wages were found in leisure & hospitality ($533) and retail trade ($703).
Mining, Including Oil & Gas (NAICS 21)
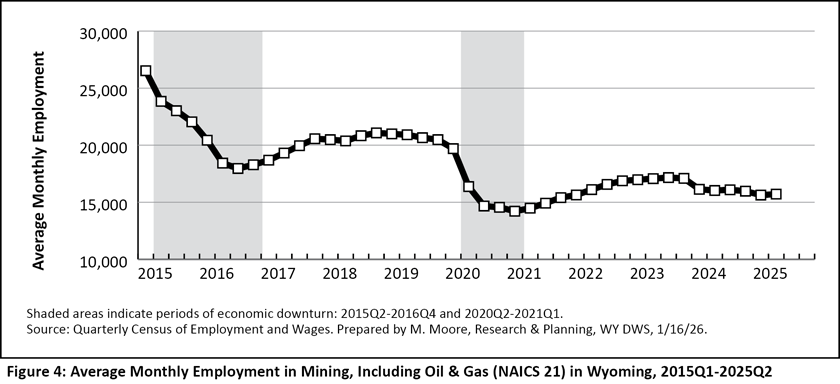
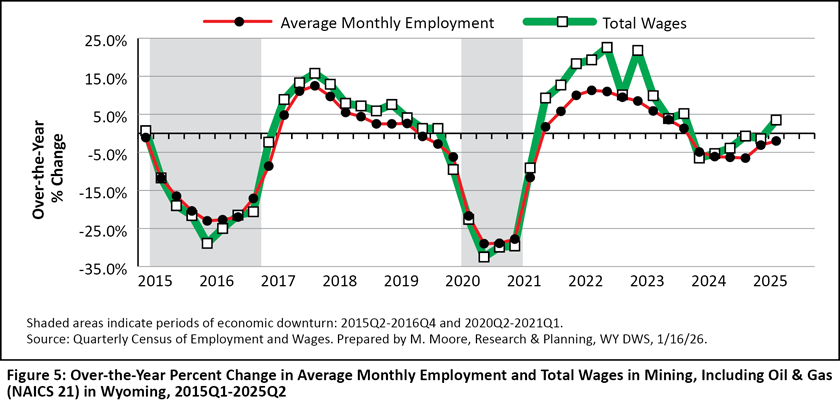
Wyoming's mining sector saw over-the-year job losses for six consecutive quarters from 2024Q1 to 2025Q2 (see Figure 4 and Figure 5). Throughout 2024, the majority of over-the-year job losses in mining were due to non-economic code changes (Moore, 2024). However, job losses continued in 2025Q1 and 2025Q2 even after those changes were no longer a factor.
Prior to 2024, mining experienced a near three-year period of over-the-year job growth; despite that growth, mining never returned to pre-pandemic employment levels. Figure 4 and Figure 5 show just how substantial the job losses were in mining during each of the past two economic downturns.
The height of employment in Wyoming's mining sector was during the period of rapid economic growth from 2004Q1 to 2008Q4 (Research & Planning, 2026a). The average monthly employment during that period was 25,190, with a peak of 30,372 in 2008Q4. From 2017Q1 to 2020Q1 between the two most recent downturns, the average monthly employment was 20,311, with a peak of 21,078 in 2018Q4. Then in 2021Q1, mining employment fell to a historical low of 14,216. Some job gains were seen following the recent downturn; however, the average monthly employment in mining from 2021Q2 to 2025Q2 was 16,111, with a peak of 17,165 in 2023Q3.
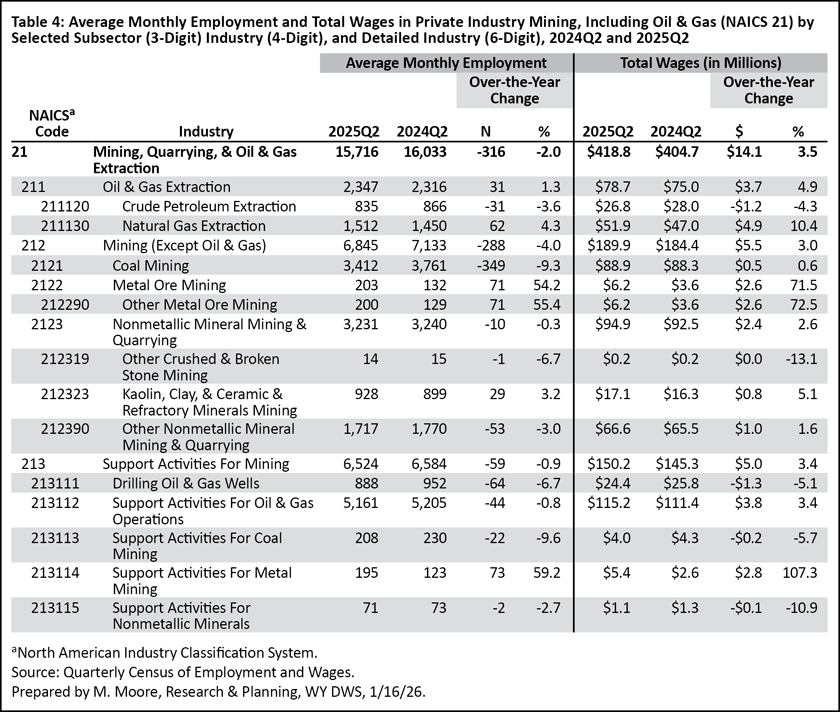
Wyoming's mining sector (NAICS 21) is made up of three subsectors (see Table 4): oil & gas extraction (NAICS 211); mining, except oil & gas (NAICS 212); and support activities for mining (NAICS 213). Oil & gas extraction and support activities for mining saw little change from 2024Q2 to 2025Q2 (1.3% and -0.9%, respectively). However, employment in mining (except oil & gas) lost 288 jobs (-4.0%). Most notably, coal mining lost 349 jobs (-9.3%) over the year.
Substantial, prolonged job losses occurred in Wyoming's coal mining industry (NAICS 2121) over the last 15 years. Coal mining employment was at its highest from 2008Q2 to 2012Q3, with an average monthly employment of 6,995 and a peak of 7,147 in 2009Q3 (Research & Planning, 2026a). Since then employment in coal mining has consistently decreased, especially during the 2015-2016 downturn and after. Employment in coal mining fell from its peak of 7,147 in 2009Q3 to a historical low of 3,412 in 2025Q2 — a loss of 3,735 jobs, or 52.3%. In other words, mining lost more than half of its jobs since its 2009Q3 peak.
Mining (including oil & gas) had $418.8 million in total wages in 2025Q2, up by $14.1 million (3.5%) compared to 2024Q2.
Over the last decade, mining (including oil & gas) has contributed a shrinking proportion of Wyoming's total jobs and wages. In 2025Q2, mining accounted for 5.5% of all jobs and 9.6% of the state's total wages. Going back to 2015Q2, mining contributed 8.4% of all jobs and 15.7% of total wages.
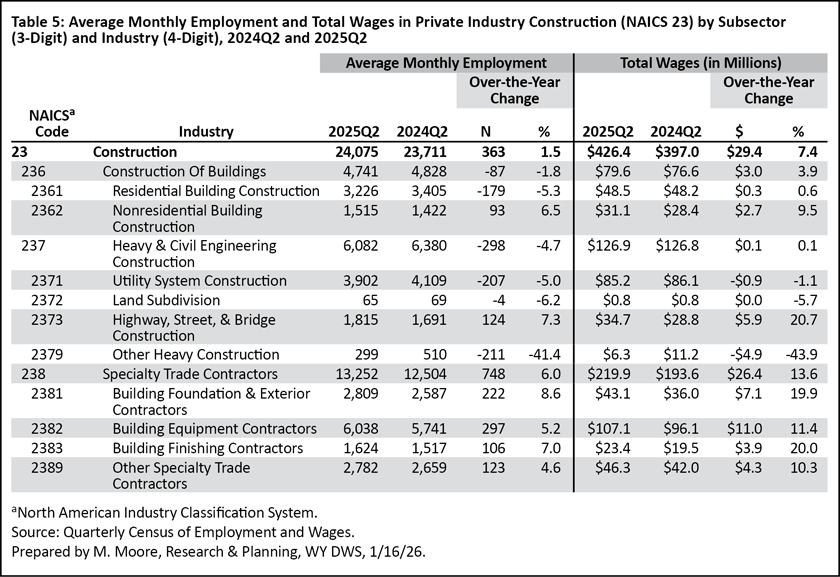
Construction (NAICS 23)
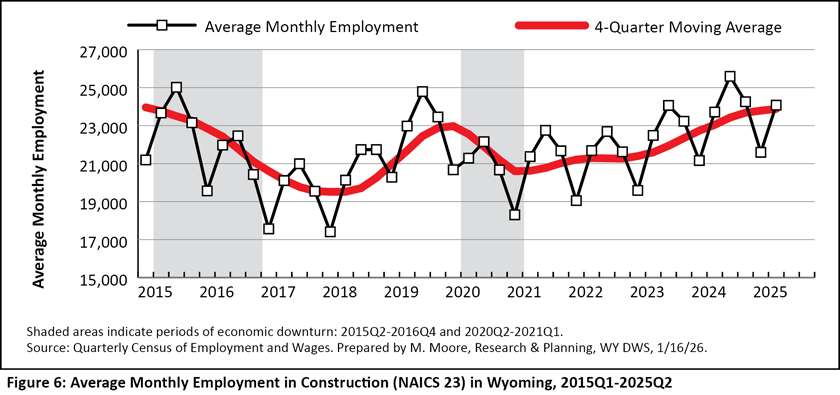
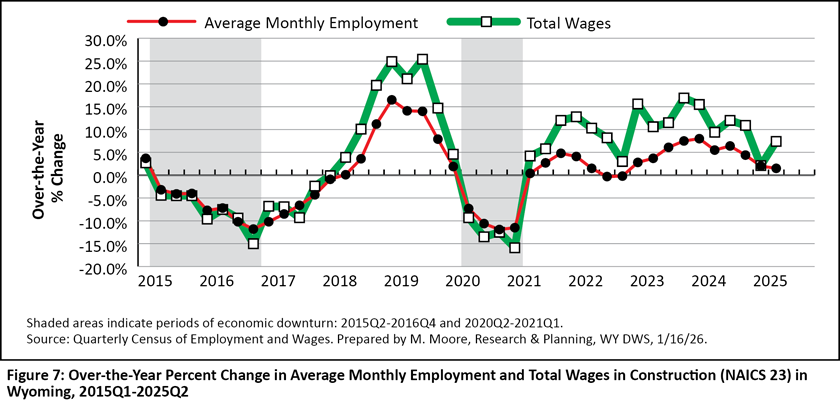
Since the end of the most recent economic downturn, Wyoming's construction sector has seen steady over-the-year growth in jobs and total wages (see Figure 6 and Figure 7). Construction led all sectors in job growth over the year with 363 (1.5%), increasing to 24,075. Total wages grew by $29.4 million (7.4%; see Table 5). Construction (NAICS 23) comprises three subsectors: construction of buildings (NAICS 236), heavy & civil engineering construction (NAICS 237), and specialty trade contractors (NAICS 238).
Employment in the construction of buildings subsector fell to 4,741 (-87, or -1.8%) in 2025Q2. Within this subsector, job gains were seen in nonresidential building construction, while job losses were seen in residential building construction.
Job losses also were seen in the heavy & civil engineering subsector, which fell from 6,380 to 6,082 (-298, or -4.7%) over the year. Employment fell in other heavy construction and utility system construction, but increased in highway, street, & bridge construction.
Overall job growth in construction was driven by the specialty trade contractors subsector, which increased from 12,504 to 13,252 (748, or 6.0%).
Employment increased in building equipment contractors, building foundation & exterior contractors, building finishing contractors, and other specialty trade contractors. Despite job losses in the other subsectors, employment in specialty trade contractors has increased from prior-year levels during each quarter since 2021Q2 (Research & Planning, 2026b).
In 2025Q2, Wyoming's construction sector accounted for 8.4% of all jobs and 9.8% of the state's total wages.
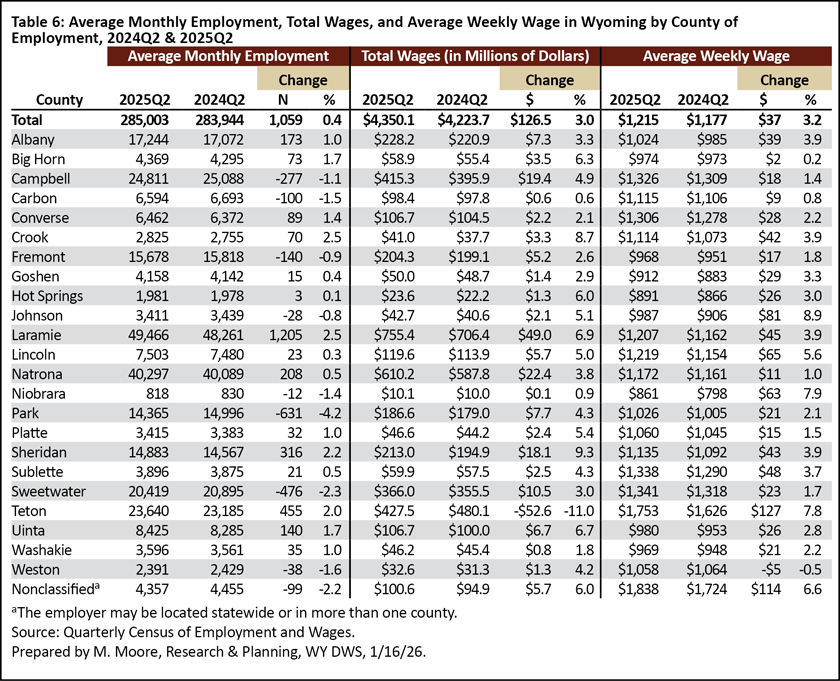
County
Over-the-year job growth occurred in 15 of Wyoming's 23 counties, while job losses were seen in eight (see Table 6). Laramie County added the greatest number of jobs (1,205, or 2.5%), followed by Teton (455, or 2.0%), Sheridan (316, or 2.2%), and Natrona (208, or 0.5%) counties. Notable job losses were seen in Park (-631, or -4.2%), Sweetwater (-476, or -2.3%), Campbell (-277, or -1.1%), Fremont (-140, or -0.9%), and Carbon (-100, or -1.5%).
Nearly all counties saw over-the-year increases in total wages, led by Laramie ($49.0 million, or 6.9%), Natrona ($22.4 million, or 3.8%), Campbell ($19.4 million, or 4.9%), Sheridan ($18.1 million, or 9.3%), and Sweetwater ($10.5 million, or 3.0%) counties.
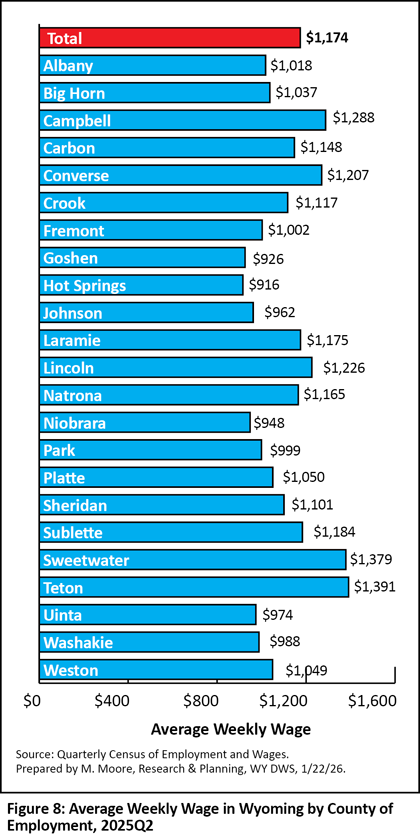
Teton County had the highest average weekly wage ($1,391), due in part to especially high wages in industries like management of companies & enterprises and financial activities (Research & Planning, 2026b). Many of the other counties with high wages were those with relatively large numbers of mining-related jobs, such as Sweetwater ($1,379), Campbell ($1,288), Converse ($1,207), and Sublette ($1,184; see Figure 8). The lowest average weekly wages were found in two of Wyoming's least populous counties: Hot Springs ($916) and Goshen ($926).
Conclusion
Second quarter 2025 marked the second consecutive quarter of just 0.4% over-the-year job growth, indicating a slowdown in Wyoming's economy.
Preliminary QCEW data for 2025Q3 seem to suggest over-the-year job losses, which would be the first time since 2021Q1. Data for 2025Q3 will be published in May 2026.
References
Moore, M. (2019, May). Chapter 1: Introduction — Driven by demographics and downturns: Wyoming’s 2018 labor market at a glance. 2019 Wyoming Workforce Annual Report. Research & Planning, WY DWS. Retrieved January 29, 2026, from https://tinyurl.com/426yehdh
Moore, M. (2024, October). 2024Q1 quarterly update: Wyoming jobs, total wages grow for 12th consecutive quarter. Wyoming Labor Force Trends, 61(10). Retrieved January 29, 2025, from https://doe.state.wy.us/LMI/trends/1024/a1.htm
Research & Planning. (2026a, January). Wyoming Quarterly Census of Employment and Wages summary statistics by industry. Retrieved January 29, 2026, from https://doe.state.wy.us/LMI/QCEW_OTY/toc.htm
Research & Planning. (2026b, January). Wyoming Quarterly Census of Employment and Wages, 2025Q2. Retrieved January 29, 2026, from https://doe.state.wy.us/LMI/25Q2_QCEW/toc.htm
 Hire Wyo
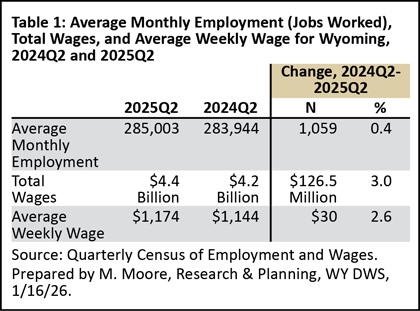