Wyoming Labor Force Trends
January 2026 | Volume 63, No. 1
Click Here for PDF
Return to Table of Contents
Exploring Average Weekly Hours Worked in the U.S. and Wyoming, 2007-2024
by: David Bullard, Senior Economist
The Current Employment Statistics Program produces estimates of average weekly hours worked for most industries in Wyoming. Reviewing these data from 2007 to 2024 reveals that the estimates for some industries (natural resources & mining; construction; trade, transportation, & utilities; and other services) appear consistent with economic trends in the state. In other sectors, such as professional & business services, education & health services, and leisure & hospitality, the movements in average weekly hours seem to reflect sampling error and other noise rather than real economic conditions.
Average weekly hours worked are an important economic indicator. As one analyst explained: “Average weekly hours are a sensitive barometer of labor demand. Employers generally prefer to increase or decrease hours worked before hiring or laying off workers” (Frumkin, 1990 p. 13). In other words, one would expect average hours to be a leading indicator.
This article presents annual data on average weekly hours for Wyoming and the U.S. from 2007 to 2024 for selected industry sectors. The estimates in this article are produced by the Current Employment Statistics program and are based on payroll reports submitted by a sample of employers. Because they are sample-based estimates, they are subject to sampling error and other possible errors. While some of the series are consistent with general economic trends within the state, other series have trends that are harder to explain.
Figure 1 shows average weekly hours at the total private level for the U.S. and Wyoming. During most of the period shown in the figure, average weekly hours were higher in Wyoming than in the U.S. This could reflect the different industry makeup of Wyoming’s economy, which has historically relied heavily on the mining sector.
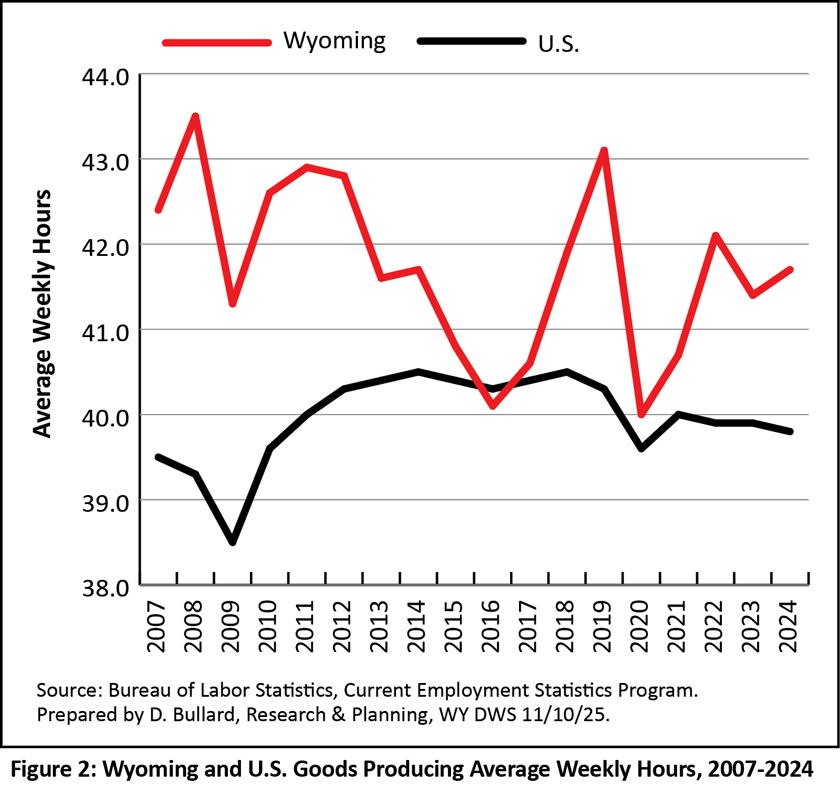
The goods-producing sector is shown in Figure 2. This includes natural resources & mining, construction, and manufacturing. Separate hours estimates are not produced for Wyoming’s manufacturing sector. Hours were much higher in Wyoming than in the U.S. for most of the time period shown. U.S. hours hit two low points: the Great Recession in 2009 (38.5) and the Covid-19 pandemic in 2020 (39.6). Wyoming hours were especially low in 2020 (40.0) and 2016 (40.1). Wyoming experienced an economic downturn in 2016 with layoffs in oil & gas and coal mining.
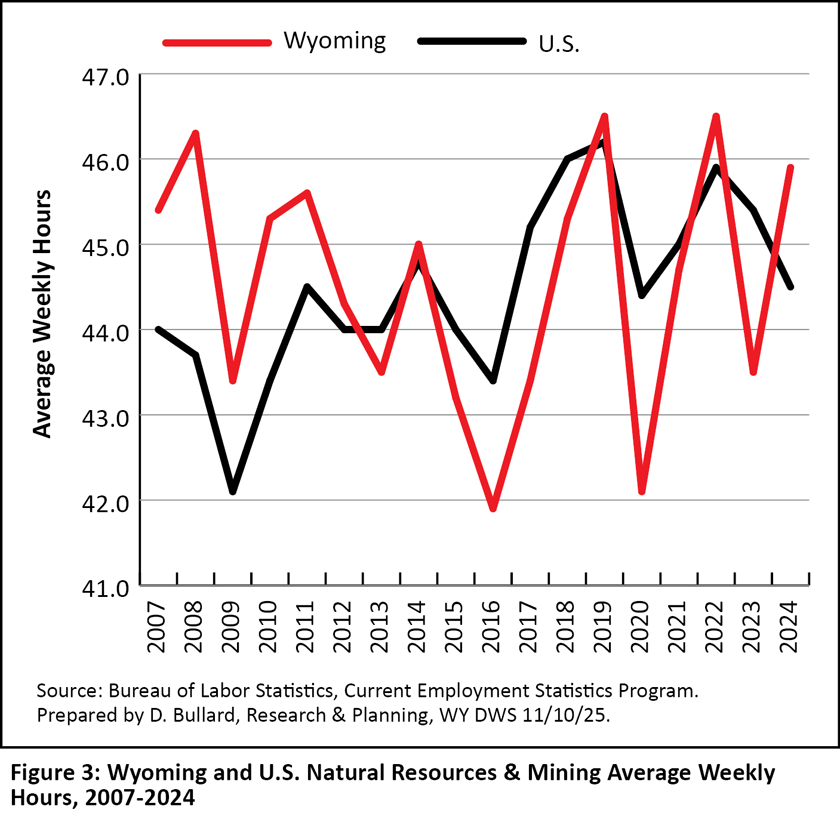
Average hours in Wyoming’s natural resources & mining sector experienced several sharp ups and downs over the years (see Figure 3). The lowest hours occurred in 2016 (41.9) and 2020 (42.1), while peaks were seen in 2019 and 2022 (46.5 in both years). While the levels were different, U.S. hours exhibited a similar pattern, with low points in 2009 (42.1), 2016 (43.4), and 2020 (44.4). The peak of the U.S. series occurred in 2019, at 46.2 hours. There seem to be two key takeaways from Figure 3. First, the natural resources & mining sector has high average hours, even during downturns (always remaining well above 40 hours). Second, there are wide swings in average hours from year to year.
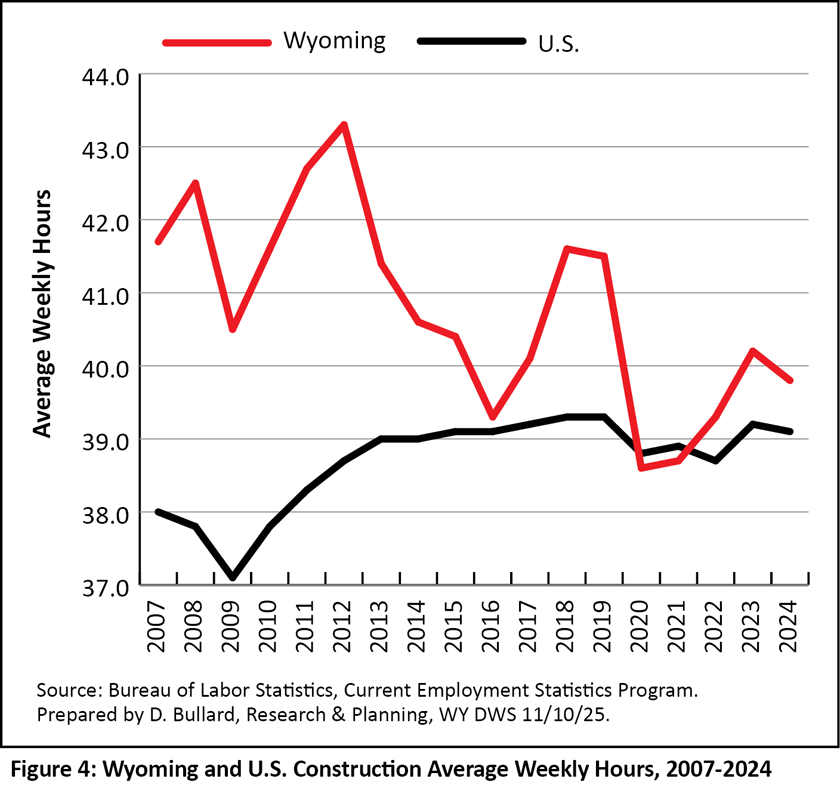
Figure 4 shows average weekly hours in the construction sector. From 2007 to 2019, hours worked were higher in Wyoming than the U.S. Average hours in Wyoming reached their lowest point in 2020 (38.6 hours) during the pandemic. U.S. hours were at their lowest point during the Great Recession (37.1 hours in 2009). It is somewhat interesting that when comparing the series over the entire time period, U.S. hours increased modestly (up from 38.0 in 2007 to 39.1 in 2024) while Wyoming hours decreased (down from 41.7 in 2007 to 39.8 in 2024).
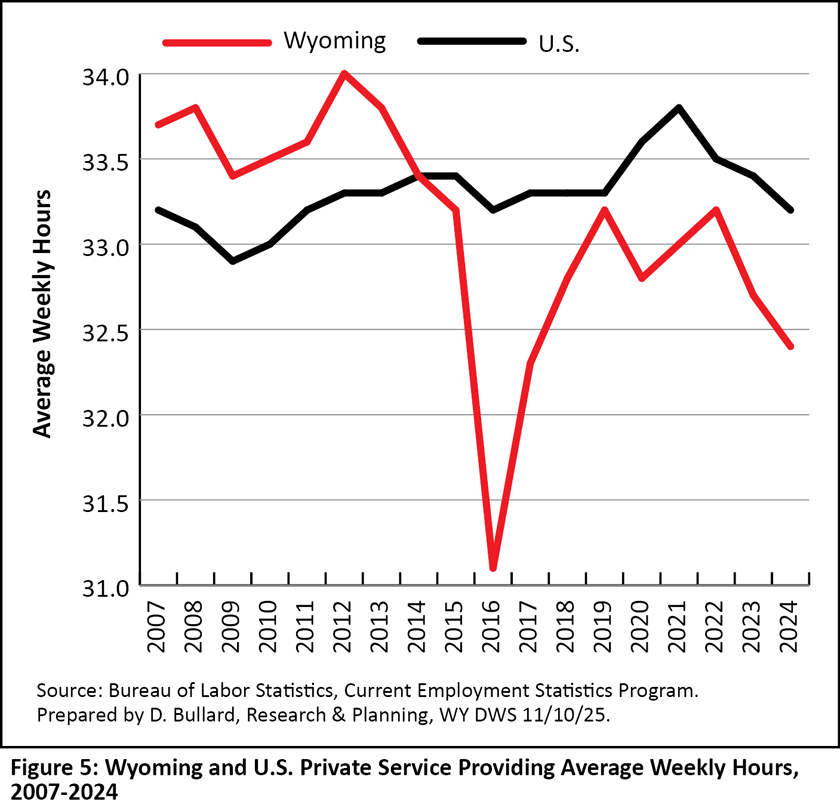
Average hours in the private service-providing sector are presented in Figure 5. This includes trade, transportation, & utilities; information; financial activities; professional & business services; education & health services; leisure & hospitality; and other services. Separate estimates are not available for information and financial activities because of sample size limitations. While U.S. hours remained fairly stable, average hours in Wyoming fell sharply from 33.2 in 2015 to 31.1 in 2016 as the state suffered an energy-related downturn.
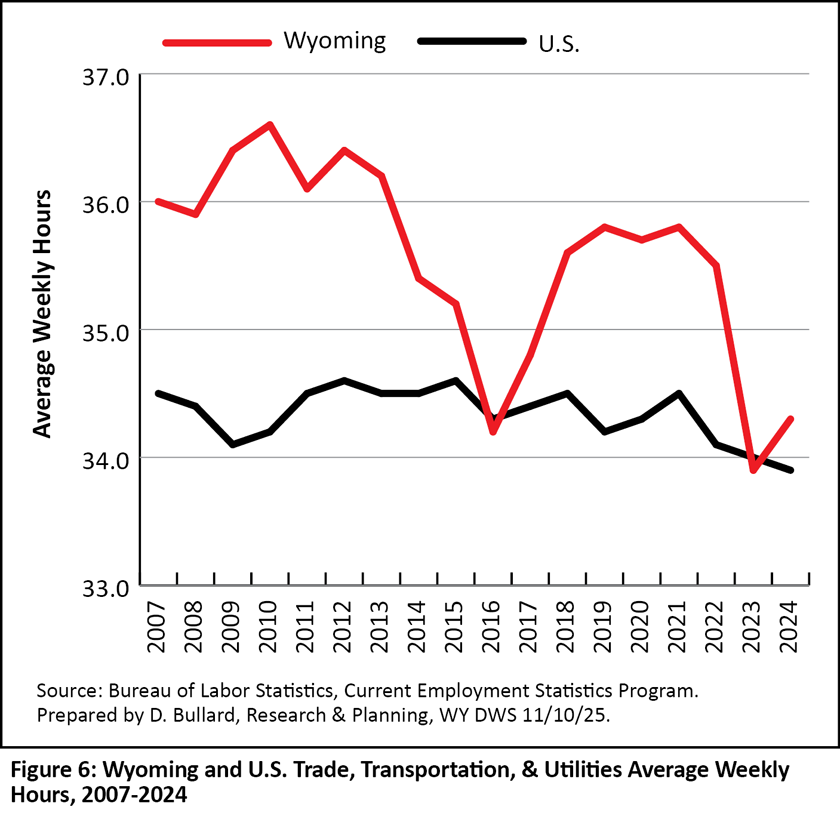
Figure 6 illustrates average hours in the trade, transportation & utilities sector. With only two exceptions (2016 and 2023), Wyoming hours were much higher than the U.S. average. While it is not entirely clear why Wyoming hours would be higher than the U.S. in this sector, it is possible that Wyoming has a different industry mix within this sector. Wyoming’s utilities industry (including coal-fired power plants) makes up a larger part of this sector than in the U.S., and probably has higher average hours.
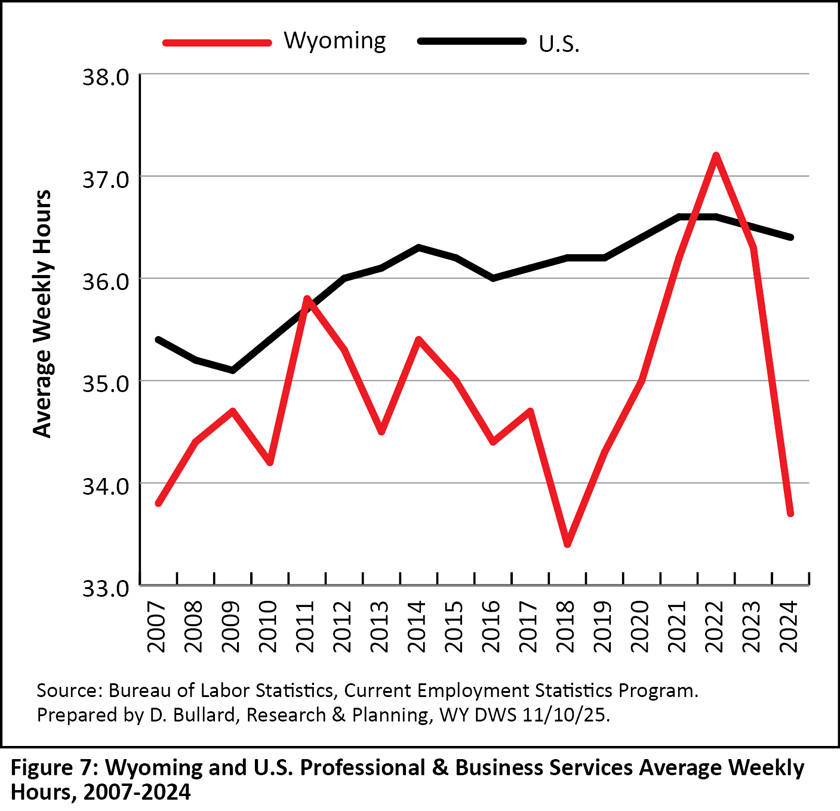
Hours in professional & business services are shown in Figure 7. Wyoming hours in this sector exhibit a different pattern than any other sector. The year 2018 marked a low point of 33.4 hours, while 2022 was the peak of 37.2 hours. U.S. hours were much more stable, with a general upward trend. Professional & business services includes a large number of different types of businesses from landscaping and lawn care, to temporary help agencies, to engineering firms, law firms, and accounting firms. It is possible that a change in the mix of these types of employers in the survey sample could affect the estimates in an unexpected way.
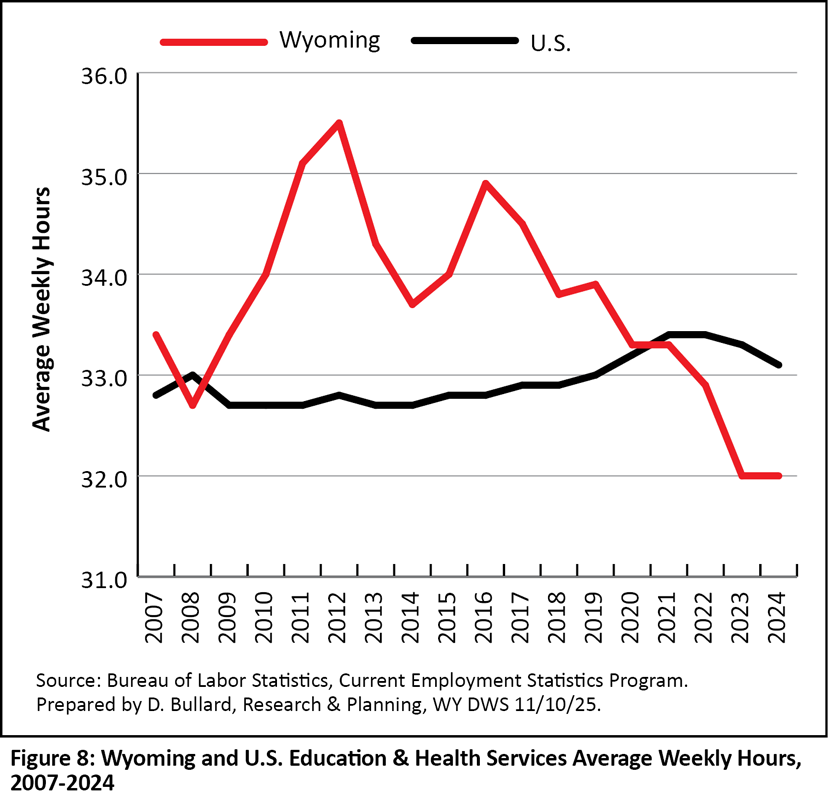
Wyoming hours in education & health services hit a high point in 2012 (35.5) and low points in 2023 and 2024 (32.0; see Figure 8). In contrast, U.S. hours remained quite stable over the entire period, staying between a low of 32.7 hours and a high of 33.4 hours. It is not clear why Wyoming hours peaked in 2012 and 2016.
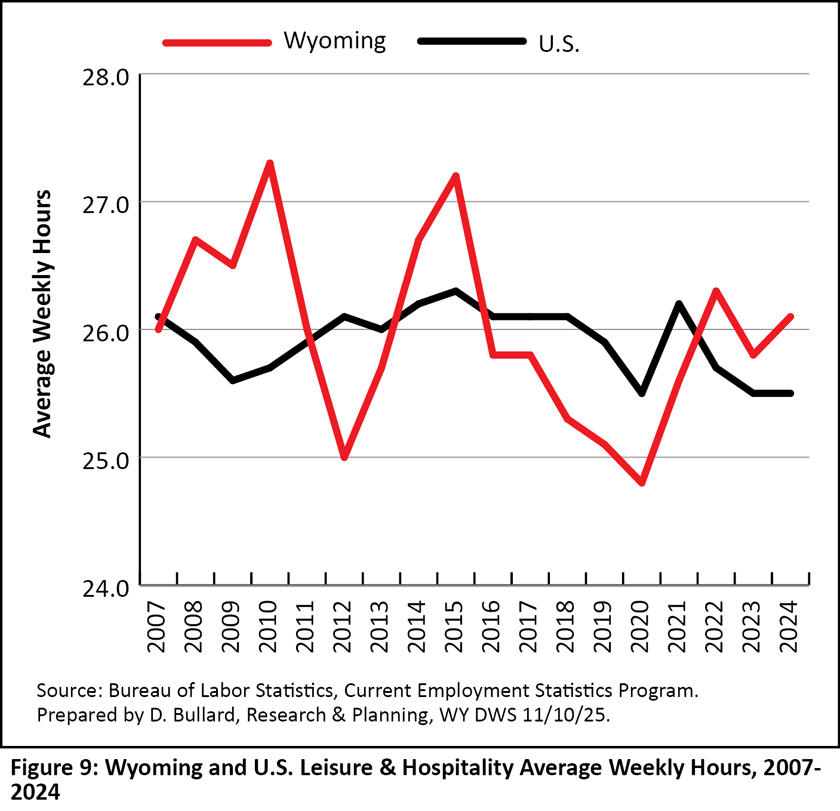
Figure 9 shows average weekly hours in leisure & hospitality. Not surprisingly, both the U.S. and Wyoming had low points in their series in 2020 when restaurants and hotels were affected by pandemic-related restrictions. However, the low point in the Wyoming series in 2012 and the high point in 2010 do not seem connected to any obvious economic events.
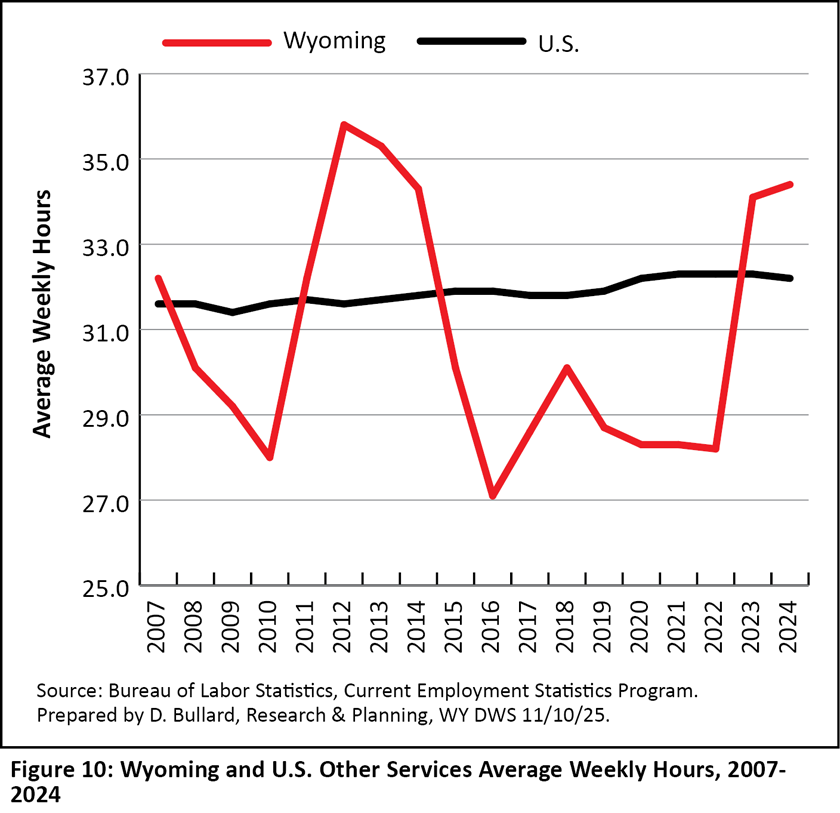
Figure 10 is similar to Figure 8 because U.S. hours were very stable in other services. Wyoming hours hit a peak in 2012 at 35.8 and then gradually fell to a low point of 27.1 in 2016. The economic downturn that Wyoming experienced in 2016 affected many different types of businesses. Within the other services sector, one detailed industry that saw large swings in employment and hours was commercial & industrial machinery & equipment repair & maintenance. These types of firms are often involved with short-term maintenance projects at refineries and power plants.
In summary, several sectors presented in this article had hours estimates that were consistent with general economic conditions in Wyoming. In particular, sharp downturns in hours are evident in 2016 in natural resources & mining; construction; private service providing; trade, transportation, & utilities; and other services. Given that the state’s economy was suffering through layoffs at that time, it makes sense that hours would be unusually low in 2016. Additionally, many series show decreases in hours worked in 2020, during the pandemic, and again, such results seem quite reasonable.
In other sectors, however, the swings in average hours defy economic explanation. It is possible that the patterns in average hours in professional & business services, education & health services, and leisure & hospitality simply reflect sampling error and other noise, rather than underlying economic conditions. Across almost every series, U.S. hours were much more stable than the estimates for Wyoming, and given the vastly different sample size, such a result is entirely understandable. In short, while the average hours estimates for several sectors appear reasonable, the estimates for professional & business services, education & health services, and leisure & hospitality are questionable.
Reference
Frumkin, N. (1990). Guide to economic indicators. Armonk, NY: M.E. Sharpe.
 Hire Wyo
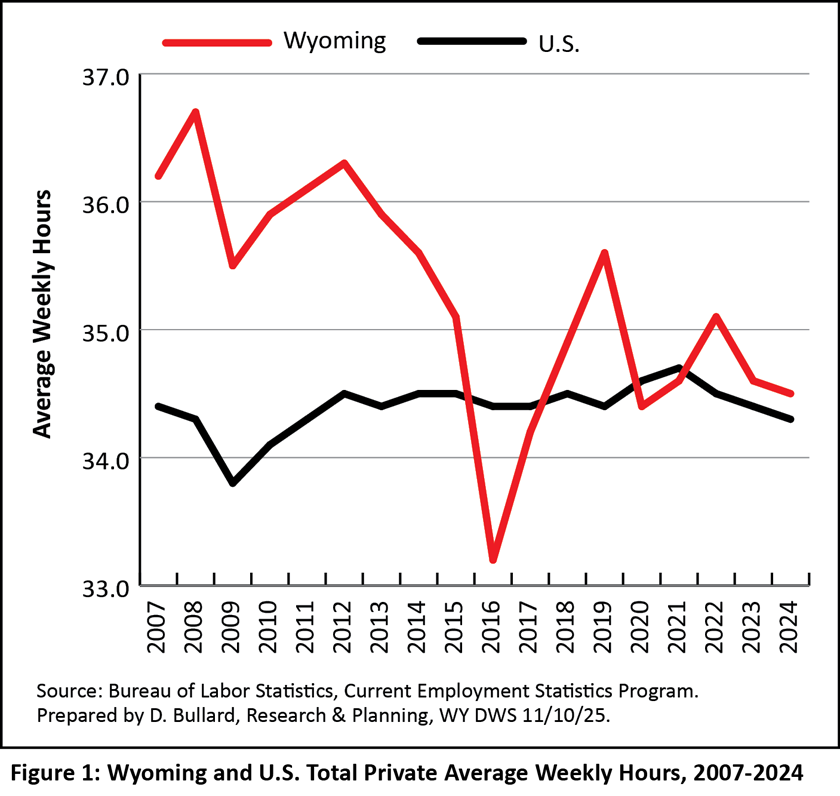