Wyoming Labor Force Trends
January 2024 | Volume 61, No. 1
Click Here for PDF
Return to Table of Contents
2023Q2 Quarterly Update:
Identifying Areas of Job Growth by County and Industry
by: Michael Moore, Research Supervisor
This article provides an overview of Wyoming’s employment and wages in second quarter 2023. The largest job growth occurred in professional & business services, local government (including public schools, colleges & hospitals), mining (including oil & gas), leisure & hospitality, and construction. Employment rose in 19 counties and fell in four counties.
Wyoming added more than 6,800 jobs and $266.8 million in total wages over the year in second quarter 2023 (2023Q2; see Table 1). This marked the ninth consecutive quarter of over-the-year job growth, and the second quarter that Wyoming returned to pre-pandemic employment levels.
What industries are driving Wyoming's job growth, and where are they located? This article provides a look at 20 industry subsectors by county to gain a greater understanding of where job growth occurred from 2022Q2 to 2023Q2.
The data discussed in this article are from the Quarterly Census of Employment and Wages (QCEW). Data from 2023Q2 are available at https://doe.state.wy.us/LMI/23Q2_QCEW/toc.htm.
Introduction
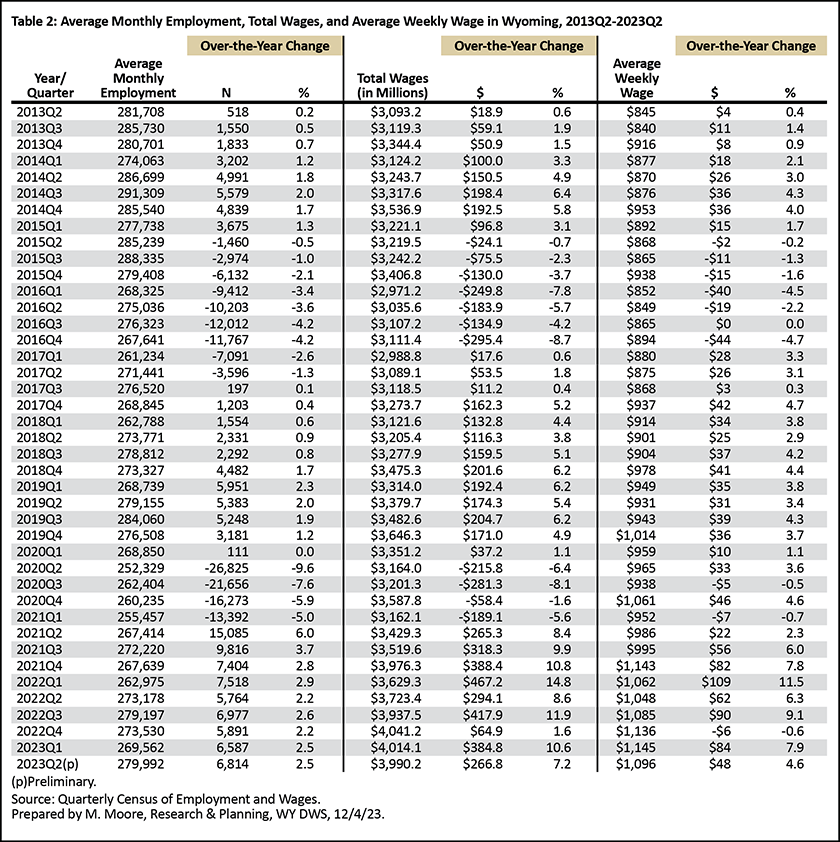
Wyoming’s average monthly employment in 2023Q2 was 279,992, an increase of 6,814 jobs (2.5%) compared to 2022Q2 (see Table 2). The state had $4.0 billion in total wages, up $266.8 million (7.2%) over the year. Wyoming's average weekly wage increased from $1,048 to $1,096 ($48, or 4.6%).
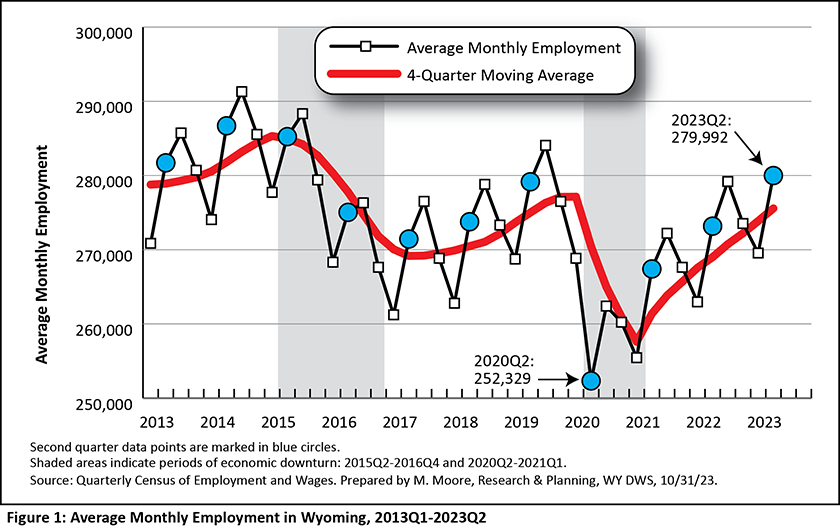
Wyoming employment typically increases from first quarter to second, before peaking in third quarter (see Figure 1). The shaded areas in the figures in this article represent periods of economic downturn. The Research & Planning (R&P) section of the Wyoming Department of Workforce Services has defined an economic downturn as a period of at least two consecutive quarters of over-the-year decreases in average monthly employment and total wages based on data from the QCEW. Wyoming has endured three such economic downturns since 2009: 2009Q1 to 2010Q1, 2015Q2 to 2016Q4, and 2020Q2 to 2021Q1. Wyoming’s most recent downturn was influenced by the COVID-19 pandemic and declines in the prices of and demand for the state’s energy resources. While each downturn had its own unique circumstances, declining energy prices preceded all three (Moore, 2019).
As illustrated in Figure 1, Wyoming's average monthly employment fell to a decade low of 252,329 during 2020Q2 at the start of the pandemic. From 2020Q2 to 2023Q2, employment increased by 27,663 jobs, or 11.0%. Also, 2023Q2 marked the second consecutive quarter of Wyoming returning to pre-pandemic employment levels. The state's average monthly employment of 279,992 was slightly higher than the 279,155 in 2019Q2 prior to the pandemic.
Industry
Industries are organized by the North American Industry Classification System (NAICS). A sample of the NAICS hierarchal structure for mining (NAICS 21) can be found in Box 1. This section of the article discusses statewide employment at the sector (or two-digit NAICS) level.
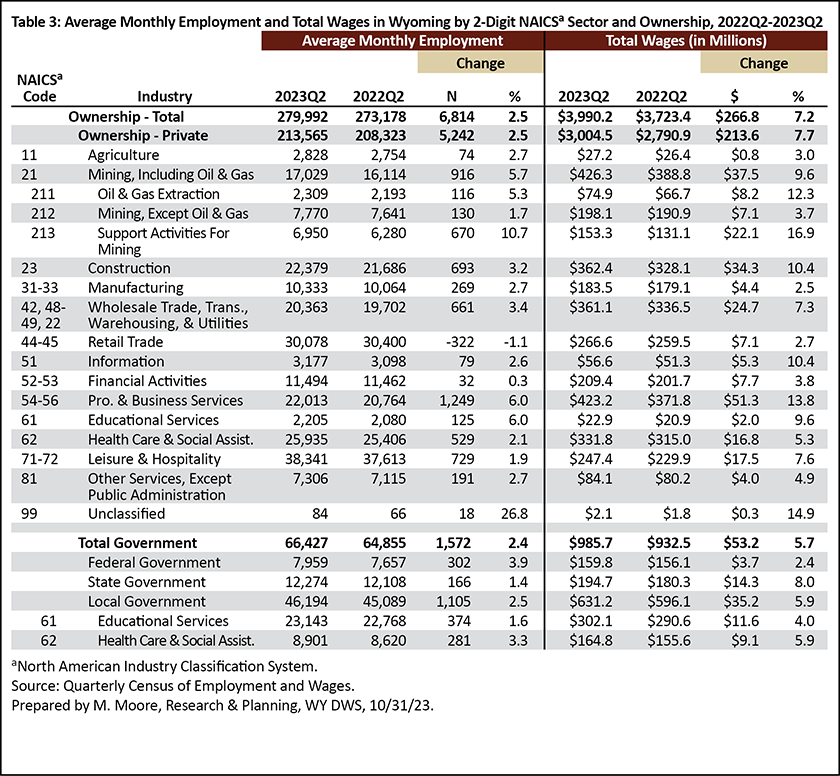
Table 3 shows employment and wages at the two-digit sector level. Nearly all industries showed substantial over-the-year employment gains, led by professional & business services (1,249, or 6.0%), local government, including public schools, colleges, & hospitals (1,105, or 2.5%), mining, including oil & gas (916, or 5.7%), leisure & hospitality (729, or 1.9%), and construction (693, or 3.2%). Within the mining sector, all three subsectors saw over-the-year job growth, with the greatest in support activities for mining (670, or 10.7%).
The only notable over-the-year job losses were seen in retail trade (-322, or -1.1%).
Wyoming's total wages increased from $3.7 billion in 2022Q2 to $4.0 billion in 2023Q2 ($266.8 million, or 7.2%). The greatest increases in total wages were seen in professional & business services ($51.3 million, or 13.8%), mining, including oil & gas ($37.5 million, or 9.6%), local government ($35.2 million, or 5.9%), and construction ($34.3 million, or 10.4%).
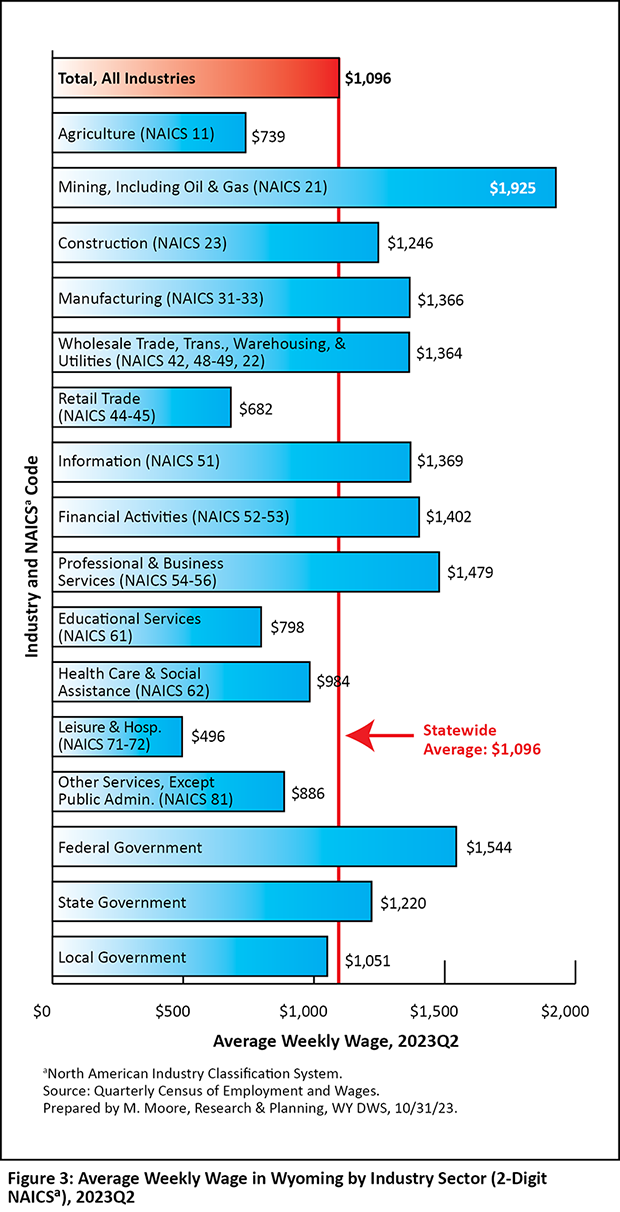
Across all industries, Wyoming's average weekly wage in 2023Q2 was $1,096 (see Figure 3). The highest weekly wages were found in mining, including oil & gas ($1,925), federal government ($1,544), professional & business services ($1,479), and financial activities ($1,402). The industries with the lowest average weekly wages were leisure & hospitality ($496), retail trade ($682), and agriculture ($739).
County
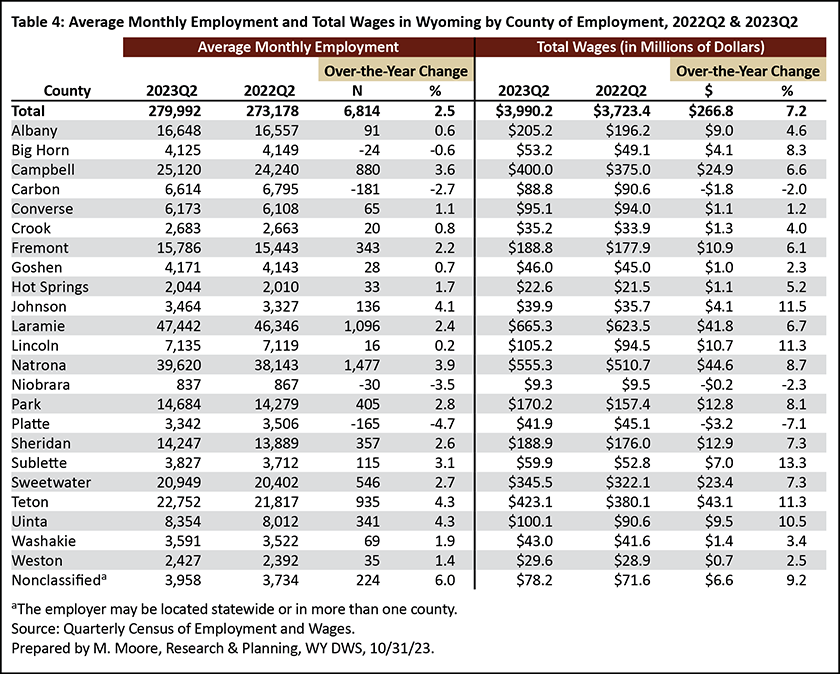
All but four of Wyoming's 23 counties experienced over the-year job growth in 2023Q2 (see Table 4). Natrona County added the greatest number of jobs (1,477, or 3.9%), followed by Laramie (1,096, or 2.4%), Teton (935, or 4.3%), and Campbell (880, or 3.6%) counties. These four counties have mostly shown job growth over the last eight quarters (Research & Planning, 2023; see Figure 4).
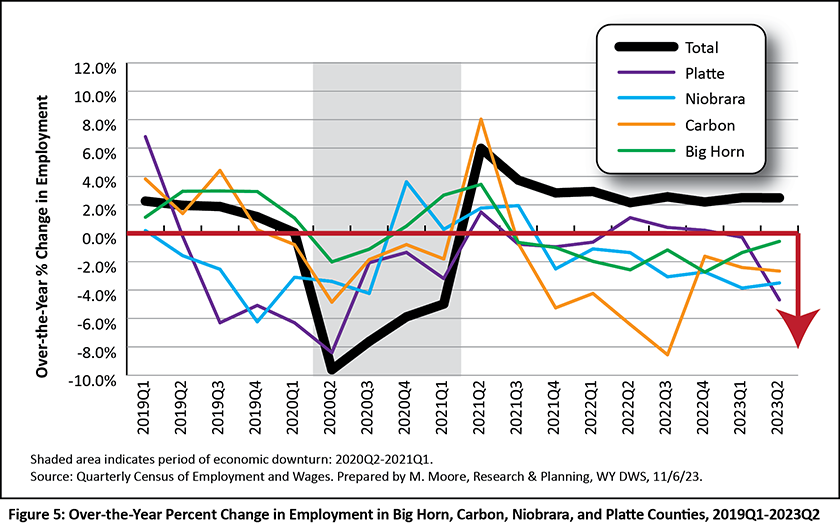
Job losses were seen in Carbon (-181, or -2.7%), Platte (-165, or -4.7%), Niobrara (-30, or -3.5%), and Big Horn (-24, or -0.6%) counties. These four counties have seen persistent over-the-year job losses, even as the state has continued to add jobs (Research & Planning, 2023; see Figure 5). For example, Big Horn and Carbon counties have both seen over-the-year job losses in each of the last eight quarters.
Natrona County also saw the greatest increase in total wages ($44.6 million, or 8.7%), followed by Teton ($43.1 million, or 11.3%), Laramie ($41.8 million, or 6.7%), Campbell ($24.9 million, or 6.6%), and Sweetwater ($23.4 million, or 7.3%) counties.
Over-the-year decreases in total wages were seen in Platte (-$3.2 million, or -7.1%), Carbon (-$1.8 million, or -2.0%), and Niobrara (-$0.2 million, or -2.3%) counties.
Where is the Job Growth?
Wyoming's job growth is often driven by a specific industry, such as mining (including oil & gas), construction, or leisure & hospitality. In the years since the pandemic, however, job growth has been more widespread. This section of the article looks to pinpoint that growth by examining the 20 industry subsectors (three-digit NAICS) that added the most jobs and the counties in which they were located.
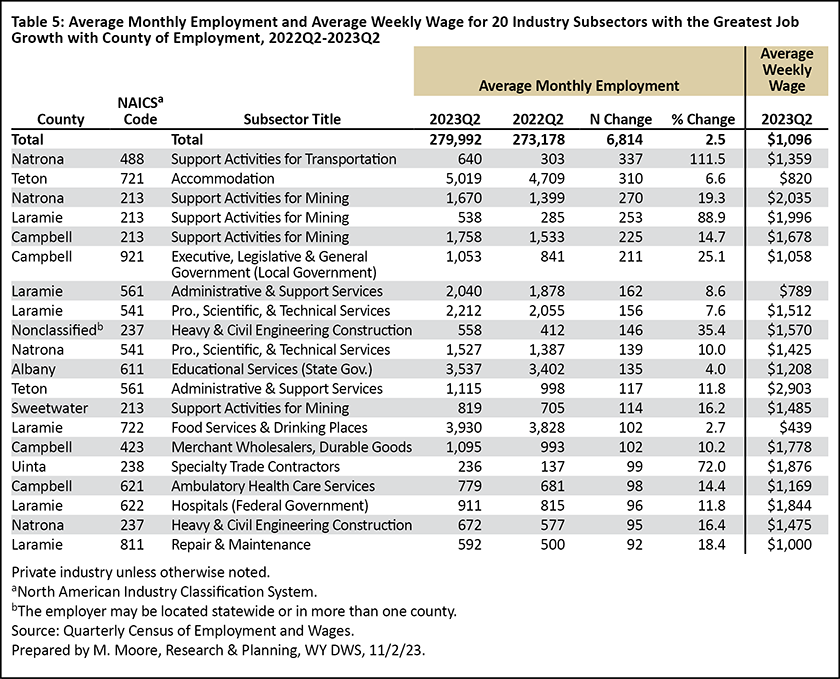
For example, Natrona County's support activities for transportation subsector (NAICS 488) added the most new jobs over the year (337, or an increase of 111.5%; see Table 5). This subsector falls within the transportation & utilities sector (NAICS 48-49); according to the U.S. Bureau of Labor Statistics (2023), businesses in this subsector "provide services which support transportation. These services may be provided to transportation carrier establishments or to the general public. This subsector includes a wide array of establishments, including air traffic control services, marine cargo handling, and motor vehicle towing."
Substantial job growth was seen in support activities for mining in three different counties: Natrona (270, or 19.3%), Laramie (253, or 88.9%), and Campbell (225, or 14.7%). Job growth in Laramie County also was seen in administrative & support services (162, or 8.6%) and professional, scientific, & technical services (156, or 7.6%). Heavy & civil engineering construction added 146 jobs (35.4%) and was listed in a nonclassified county; this indicates that many of these were large employers that were located statewide or in more than one county.
While the majority of job growth in Table 5 occurred in private industry, there were some exceptions. Campbell County's local government executive, legislative, & general government subsector added 211 jobs (25.1%). State government educational services in Albany County added 135 jobs (4.0%), while federal government hospitals in Laramie County added 96 (11.8%).
It is worth noting that the majority of the industries in Table 5 had higher wages than the statewide average of $1,096. For example, the average weekly wage for administrative & support services in Teton County was $2,903. In Natrona County's support activities for mining subsector, the average weekly wage was $2,035. The only subsectors in Table 5 with noticeably lower wages were administrative & support services in Laramie County ($789) and accommodation in Teton County ($820). The weighted average weekly wage for the industry subsectors in Table 5 was $1,255.
Conclusion
Second quarter 2023 marked the ninth consecutive quarter of over-the-year job growth for Wyoming, as the state added more than 6,800 jobs and $266 million in total wages. Job growth was seen in various industries around the state. In addition, 2023Q2 was the second consecutive quarter during which the state's average monthly employment returned to pre-pandemic levels.
Quarterly employment and wage data for Wyoming from the QCEW are available online at https://doe.state.wy.us/LMI/toc_202.htm. Data for 2023Q3 will be released on February 2, 2024, with a feature article planned for the April 2024 issue of Wyoming Labor Force Trends.
References
Moore, M. (2019, May). Chapter 1: Introduction — Driven by demographics and downturns: Wyoming’s 2018 labor market at a glance. 2019 Wyoming Workforce Annual Report. Research & Planning, WY DWS. Retrieved September 6, 2023, from https://doe.state.wy.us/LMI/annual-report/2019/2019_Annual_Report.pdf
Research & Planning. (2023, October). Summary statistics by Wyoming county of employment, 2001Q1-2023Q2. WY DWS. Retrieved November 3, 2023, from https://doe.state.wy.us/LMI/QCEW_OTY_County/county_toc.htm
U.S. Bureau of Labor Statistics. (2023, November). Industries at a glance — support activities for transportation: NAICS 488. Retrieved November 3, 2023, from https://www.bls.gov/iag/tgs/iag488.htm
 Hire Wyo
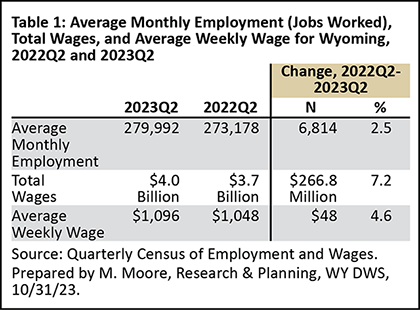