Wyoming Short-Term Industry and Occupational Employment Projections, 2022-2024
Click here to download Microsoft Excel file.
Click here to download the full publication (PDF).
New Short-Term Projections Show Continued Job
Growth
by: Laura Yetter, Senior Economist
Wyoming is projected to gain nearly 6,000 new jobs from second quarter 2022 (2022Q2) to second quarter 2024 (2024Q2) according to the newest short-term industry and occupational projections from the Research & Planning (R&P) section of the Wyoming Department of Workforce Services. This is a 2.1% increase in the number of jobs in Wyoming.
Projections are based on historical trends of how employment levels respond to market conditions. Wyoming experienced three periods of economic downturn over the last 13 years: 2009Q1 to 2010Q1, 2015Q2 to 2016Q4, and 2020Q2 to 2021Q1. An economic downturn is defined by R&P as a period of at least two consecutive quarters of over-the-year decrease in average monthly employment and total wages based on data from the Quarterly Census of Employment and Wages (QCEW).
The projections discussed in this article were prepared during a period of increased employment and wage growth for Wyoming. As the state recovered from the most recent economic downturn, over-the-year job growth in 2022 was seen in most industries, most notably mining and leisure & hospitality (Moore, 2023).
The mining sector drives Wyoming's overall economic health. The U.S. Energy Information Administration (2023) reported that oil regularly topped $100 per barrel during the spring and summer of 2022; in 2022Q2, which includes those months, Wyoming's mining sector added nearly 1,600 jobs compared to the prior year, an increase of 11.0% (Moore, 2022). The short-term projections discussed in this report show a projected increase of nearly 1,500 jobs in mining from 2022 to 2024.
Industry Projections
Industries are classified according to the North American Industry Classification System, (NAICS). The industry projections are developed at the three-digit NAICS subsector level and then summed to the two-digit major industries shown in Table 1. The full industry projections table with three-digit NAICS subsectors can be found in Table 6.
Short-term industry projections indicate that Wyoming’s employment is expected to increase from 274,224 in 2022Q2 to 279,997 in 2024Q2, an increase of 5,773 jobs, or 2.1%. At the two-digit sector level, the largest increases in employment are projected for mining, including oil & gas (1,466, or 9.1%), health care & social assistance (888, or 2.7%), and professional, scientific, & technical services (816, or 7.8%). The only notable projected decreases in private sector employment is found in utilities (-47, or -2.0%). Total government employment is projected to remain largely unchanged (-9, or 0.0%).
Occupational Projections
Occupations are classified using the Standard Occupational Classification, (SOC) system. This publication includes occupational projection tables for each two-digit major group (see Tables 7-29, pages 16-90 of the publication) and by educational requirement (see Tables 30-36, pages 91-131).
In addition to growth or decline, short-term occupational projections also take into consideration anticipated openings due to workers exiting the workforce (exits) or changing occupations (transfers) from 2022Q2 to 2024Q2. Total openings are the sum of projected growth or decline in the number of jobs in a given occupation, plus the number of exits and transfers.
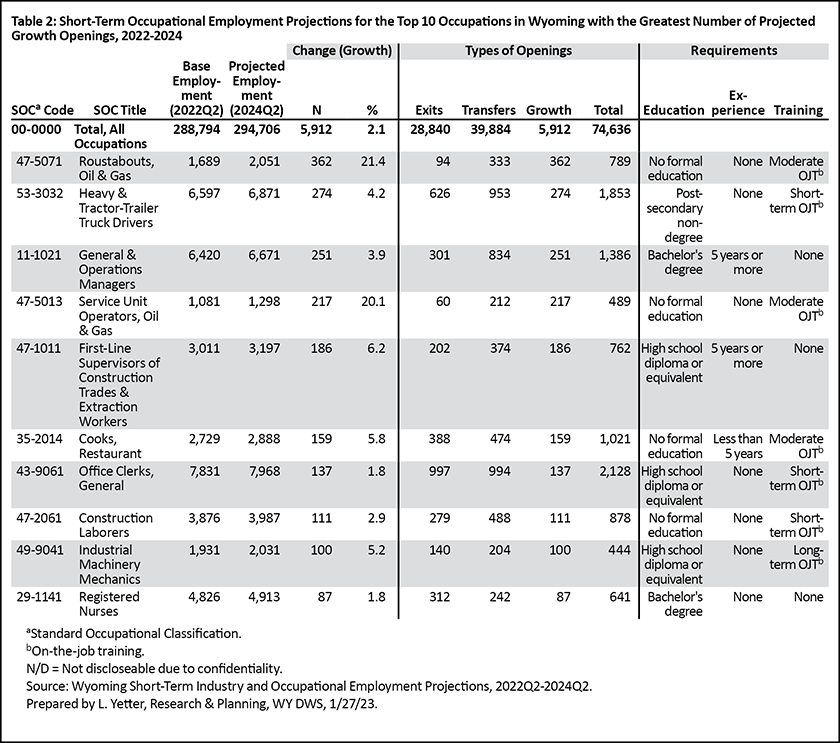
Projected growth or decline is a small component of total openings. In addition to the nearly 6,000 job openings due to growth, Wyoming is projected to have 28,840 openings due to exits and 39,884 openings due to transfers, or 74,636 total openings (see Table 2).
The 10 occupations with the greatest number of projected growth openings for Wyoming are shown in Table 2. Roustabouts, oil & gas is projected to add the greatest number of jobs (362, or 21.4%), followed by heavy & tractor-trailer truck drivers (274, or 4.2%), general & operations managers (251, or 3.9%), and service unit operators, oil & gas (217, or 20.1%). Of the 10 occupations with the greatest number of projected growth openings, only three (heavy & tractor-trailer truck drivers, general & operations managers and registered nurses) require some education beyond a high school diploma.
In contrast, Table 3 shows the 10 occupations with the greatest number of total projected openings. Many of these are relatively lower paying occupations with higher rates of turnover, such as fast food & counter workers (3,028 total openings), retail salespersons (2,551), cashiers (2,318), and waiters & waitresses (1,668). Eight of these occupations require no education beyond a high school diploma.
Of the 74,636 total projected openings, the majority require a high school diploma or less (see Table 4 and Figure 1). Jobs requiring no formal education make up 32.6% of all projected openings, while those requiring a high school diploma account for 39.8%, a combined 72.4%. In other words, jobs requiring some postsecondary education account for slightly over one-fourth (27.6%) of all projected openings. Occupations requiring a bachelor’s degree account for 13.6% of the total projected openings.
Table 5 shows the top five occupations by total projected openings for each educational requirement. Occupations with no formal educational requirement make up approximately one in three (32.6%) total job openings. The greatest projected openings in this group include fast food & counter workers (3,028), retail salespersons (2,551), and cashiers (2,318).
Occupations requiring a high school diploma or equivalent account for the largest proportion of total openings (39.8%). The greatest projected growth can be seen in occupations such as office clerks, general (2,128), stockers & order fillers (1,570), and home health & personal care aides (1,247).
Occupations requiring a post-secondary non-degree award or some college, no degree, make up approximately one in 10 (9.6%) total projected openings. Of the 7,132 projected openings in this group, approximately one in four (1,853) are heavy & tractor-trailer truck drivers. Other occupations requiring a post-secondary certificate or some college that have relatively large numbers of total projected openings include bookkeeping, accounting, & auditing clerks (1,061) and nursing assistants (891).
The occupations requiring an associate's degree account for 2.0% of total projected openings. The occupations with the greatest number of projected openings are preschool teachers, except special education (219), forest & conservation technicians (149), and paralegals & legal assistants (146).
Occupations requiring a bachelor's degree make up the greatest proportion of all occupations that require some post-secondary education, and account for 13.6% of all projected openings. General & operations managers show the greatest number of projected openings (1,386), followed by registered nurses (641) and short-term substitute teachers (636).
Occupations requiring a master's degree account for 1.2% of total projected openings. The occupations with the greatest projected openings are educational, guidance, school, & vocational counselors (123), followed by nurse practitioners (86) and education administrators, kindergarten through secondary (68).
Finally, occupations requiring a doctoral or professional degree represent the fewest projected openings (869) of all educational groups and make up 1.2% of all projected openings. Lawyers have the greatest number of projected openings (182), followed by physical therapists (84) and post-secondary teachers, all other (66).
Based on recent historical trends, Wyoming is projected to add approximately 6,000 new jobs from 2022 to 2024, an increase of 2.1%.
Current and historical industry and occupational projections for Wyoming are available online at https://doe.state.wy.us/LMI/projections.htm.
References
Moore, M. (2023, January). 2022Q2 quarterly update: Mining, leisure & hospitality drive job growth in Wyoming. Wyoming Labor Force Trends, 60(1). Research & Planning, WY DWS. Retrieved March 8, 2023, from https://doe.state.wy.us/LMI/trends/0123/a1.htm
Moore, M. (2022, October). Employment and wages by industry. Research & Planning, WY DWS. Retrieved March 8, 2023, from https://doe.state.wy.us/LMI/22Q2_QCEW/t3.htm
U.S. Energy Information Administration, Independent Statistics & Analysis, Petroleum & Other Liquids Data, Spot Prices, WTI- Cushing Oklahoma. Retrieved March 8, 2023, from https://www.eia.gov/dnav/pet/hist/RWTCD.htm


 Wyoming at Work
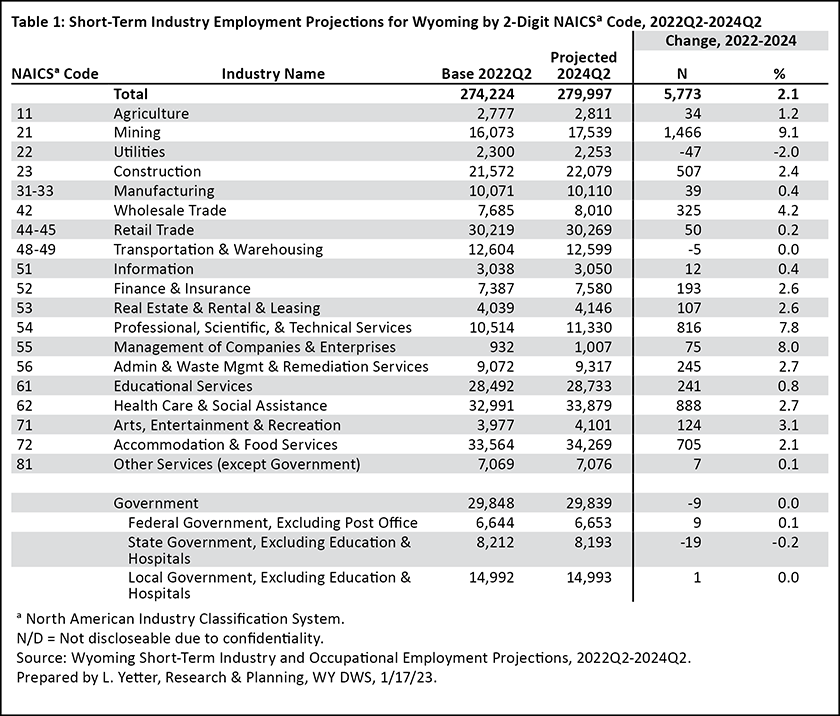