


Overview of the Occupational Employment Statistics (OES) Program
Note: The tables compiled for the Monitoring Education Costs project that were compiled using OES data can be found at http://doe.state.wy.us/LMI/education_costs.htm.
by Patrick Harris, Principal Economist
Research & Planning, Wyoming Department of Workforce Services
The Occupational Employment Statistics (OES) program’s primary responsibility is to conduct semi-annual surveys across all 50 states, the District of Columbia, and U.S. territories to produce estimates of employment and wages for approximately 800 separate occupations. The OES survey is a combination of federal-state efforts between the U.S. Department of Labor, U.S. Bureau of Labor Statistics (BLS), and state labor market information (LMI) offices. The BLS provides the procedures and technical support, draws the sample, and produces survey materials, while the state LMI office collects the data. The data are collected from approximately 200,000 establishments every six months, taking three years to fully collect the sample of 1.2 million establishments. These six-month surveys are referred to as panels, and two are completed each year (one in May and one in November). Data from self-employed persons are not collected and are not included in the estimates.
The BLS is mandated to collect the data by 29 USC 2, which states:
The Bureau of Labor Statistics, under the direction of the Secretary of Labor, shall collect, collate, and report at least once each year, or oftener if necessary, full and complete statistics of the conditions of labor and the products and distribution of the products of the same, and to this end said Secretary shall have power to employ any or either of the bureaus provided for his department and to rearrange such statistical work, and to distribute or consolidate the same as may be deemed desirable in the public interests; and said Secretary shall also have authority to call upon other departments of the Government for statistical data and results obtained by them; and said Secretary of Labor may collate, arrange, and publish such statistical information so obtained in such manner as to him may seem wise.
The employment and wage estimates are based on two different coding systems: industry and occupation. The BLS began using the North American Industry Classification System (NAICS) in 2002 and produces estimates for more than 450 industry classifications. The NAICS was developed in conjunction with three North American countries: the U.S., Canada, and Mexico. The NAICS uses a six-digit coding system, with the first two digits designating the sector, the third designating the subsector, the fourth designating the industry group, and the fifth designating the NAICS industry. The sixth digit allows for the three countries to include country-specific details. To illustrate the coding system for the NAICS, an example of Health Care and Social Assistance is provided in Figure 1.
Figure 1 shows that an individual working in a psychiatric and substance abuse hospital regardless of her actual occupation within that hospital 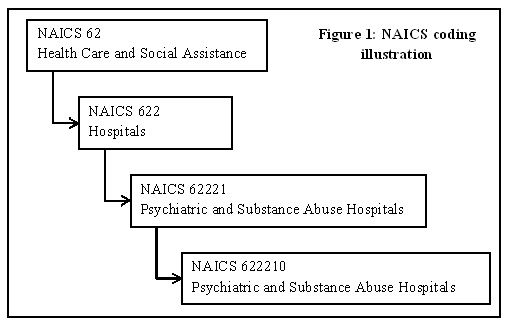 (e.g., psychiatrist, building maintenance), would be classified at the six-digit NAICS level 622210. The distinction between a classification of 62221 (five-digit) and 622210 (six-digit) is that at the five-digit level there is comparability between the three countries, while the sixth digit represents country-specific detail (in this case, the NIACS industry and the U.S. industry are the same).
In contrast to industry classification, the BLS began using the Standard 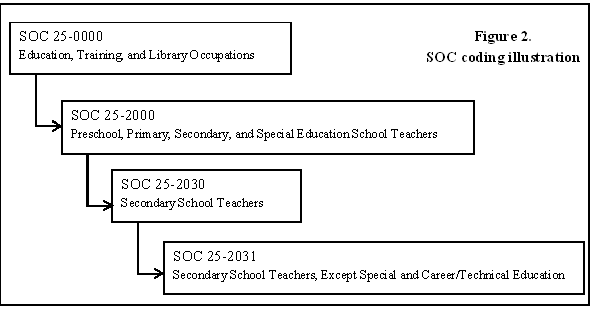 Occupational Classification (SOC) system in 1999. This is used to classify occupations in which work is performed. To illustrate the coding system for the SOC, an example of education, training, and library occupations is provided in Figure 2.
Figure 2 shows that SOC 25-2031 (secondary school teachers, except special and career/technical education) includes a broad range of secondary (high school) teachers. This may include biology, French, or English teachers. Any individual working as a teacher in a high school (with exceptions, such as special and career/technical) would be classified as SOC 25-2031.
As can be seen in Figure 3, the major occupational groups within SOC 25-0000 (education, training, and library occupations) made up more than 50%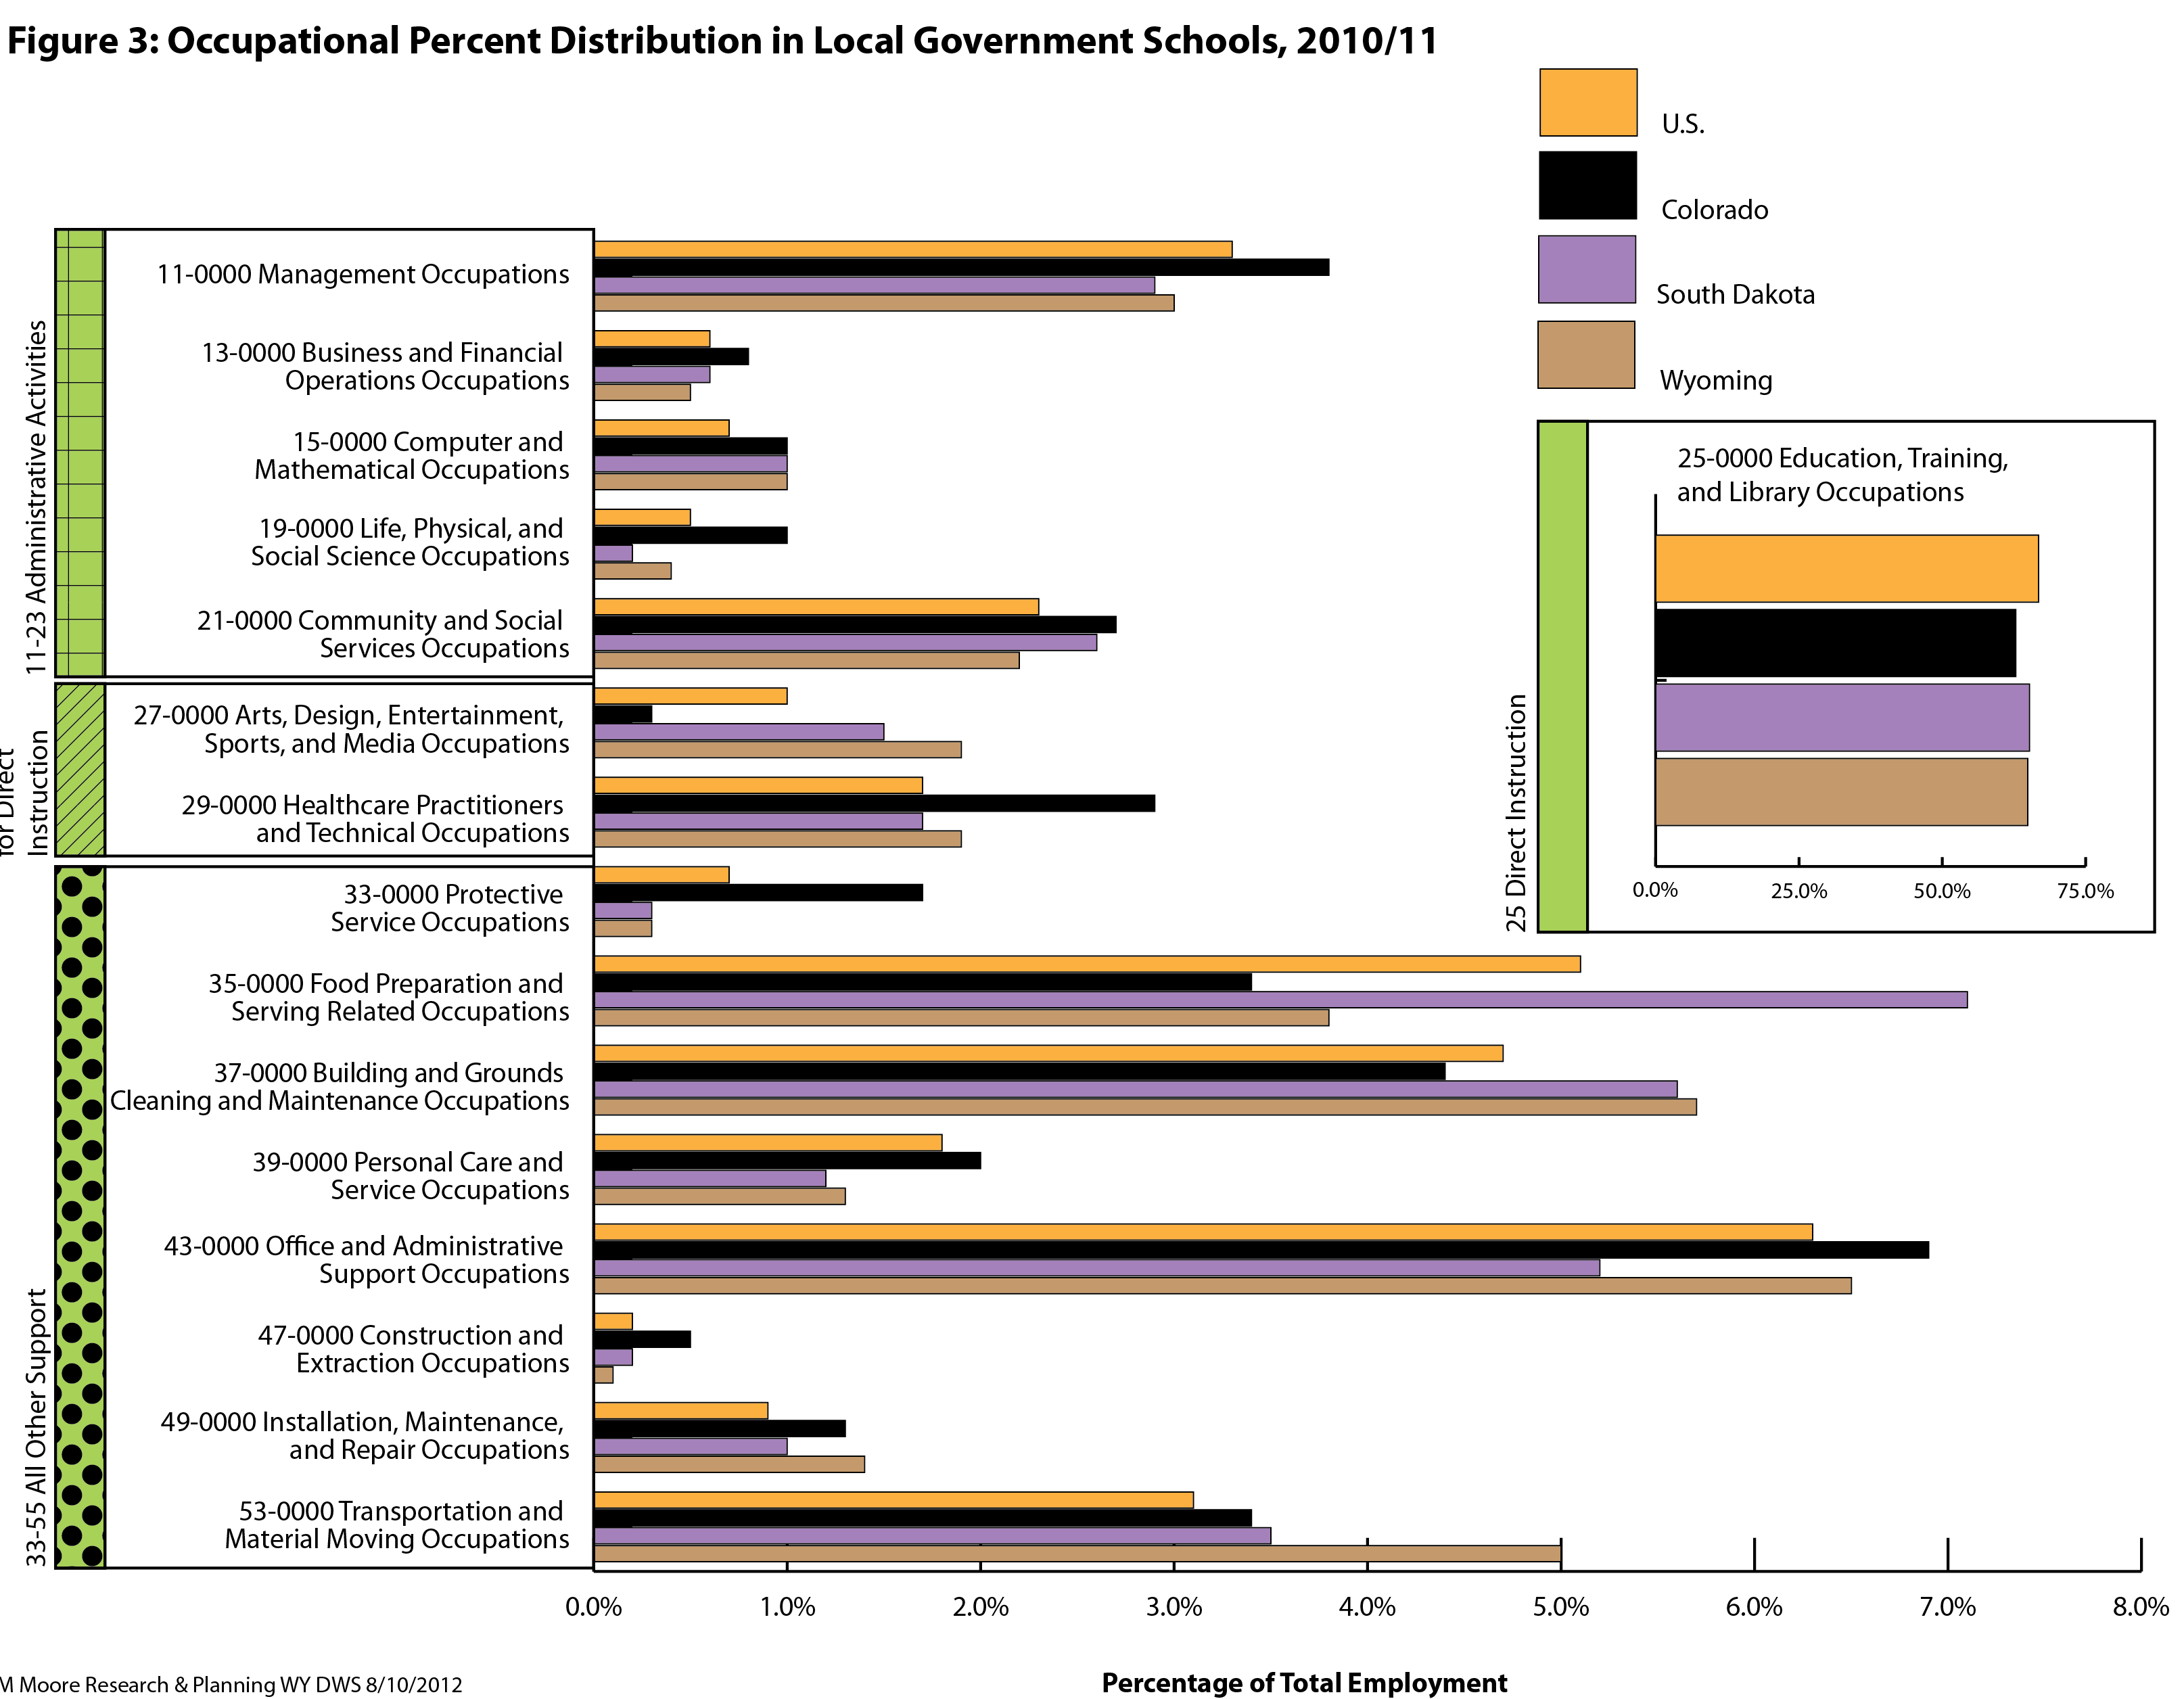 of the employment in public schools in the U.S., Wyoming, and selected surrounding states in 2011. By comparison, those classified as SOC 53-0000 (transportation and material moving occupations) accounted for only 5% of the total employment in public schools in Wyoming in 2011.
Figure 3 allows for complete comparability across geography and occupations. For example, Wyoming has a higher percentage of transportation and material moving occupations compared to the U.S, Colorado, and South Dakota, while South Dakota has a higher percentage of food preparation and serving related occupations compared to the U.S. and the other two states.
Both the NAICS and SOC coding systems are hierarchical in nature. The advantages of using a hierarchical coding system are to organize industry activities and occupational work into the most specific level of classification and to produce classifications that are statistically comparable. Combining the coding systems for both the SOC and NAICS allows for specific analyses to be performed. An explanation and illustrative examples of the benefits of this type of combination is discussed at the end of this document.
The OES Survey begins from a sample drawn from the BLS national office, which sends the survey to the selected sample members. The sample is produced from establishments that file unemployment insurance (UI) reports to the state workforce agencies. Employers are required by law to file these reports to the state where the establishment is located. The BLS began selecting the state samples to ensure that a proper amount of sample overlap or non-overlap from one survey period to the next was obtained. Further, the sample selection is also intended to minimize the likelihood that small businesses are sampled every year, thus minimizing survey burden.
The BLS office is responsible for developing the survey materials and arranges for the surveys to be mailed from a central printing office. An establishment (or business) with 10 or more employees is sent a structured form that is at least 16 pages in length. The structured form contains a list of occupations that are selected for specific three- or four-digit NAICS industries. An establishment with fewer than 10 employees is sent an unstructured form, which does not contain occupational titles or definitions. The unstructured form simply asks respondents to list the types of occupations at the establishment and the employment and wage information for each occupation listed.
The selected respondents complete the surveys and send the form to the state LMI office. The respondents have the opportunity to call the state LMI office with any questions or concerns regarding the forms during the process. Once the state LMI office reviews and checks the survey data received, the data is entered and uploaded into a national central server for processing.
The BLS has a comprehensive overview of the OES program, along with national and state data organized and arranged by occupation, available at http://www.bls.gov/oes/. The Research & Planning section of the Wyoming Department of Workforce Services provides specific to Wyoming and each of its 23 counties at http://doe.state.wy.us/LMI/EDSMarch2012/TOC000.htm.
Common Uses of OES Estimates
The OES estimates are broadly used in determining reasons for 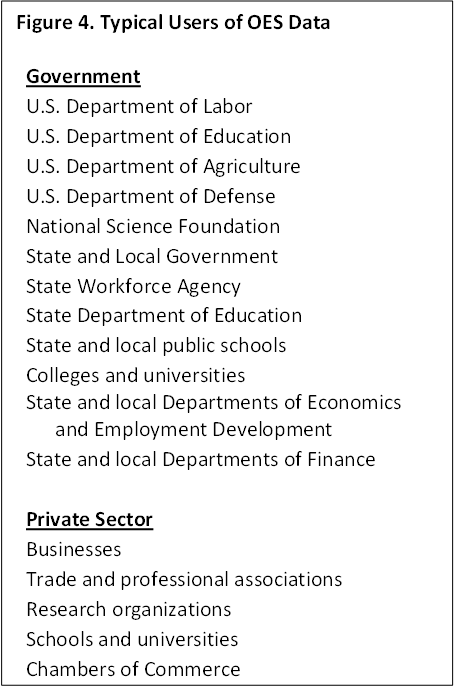 employment changes including the impact of technology, availability of specific types of skilled workers, and new product development. A list of typical users of OES data can be found in Figure 4. The U.S. Department of Labor, Employment and Training Administration’s Foreign Labor Certification program uses OES data to determine prevailing wage rates for employers applying for permits to hire aliens in the U.S. America’s Labor Market Information System uses OES data to help job seekers explore different career opportunities and for personnel assisting in the career decision process. Educators use OES data to identify the relative importance of occupations in program curricula to reflect the current needs for skills and changing job opportunities.
R&P has produced several documents using OES data; examples of these are the Wyoming Career Explorer 2011 and the Occupational Information for Environmental Health & Safety Programs: Industry Demand, Wages, and Skills – A Report to Central Wyoming College.