
Wage Records in Wyoming, 2000-2016
Males, Younger Workers Were the Most Affected by the Recent Economic Downturn
by: Michael Moore, Editor
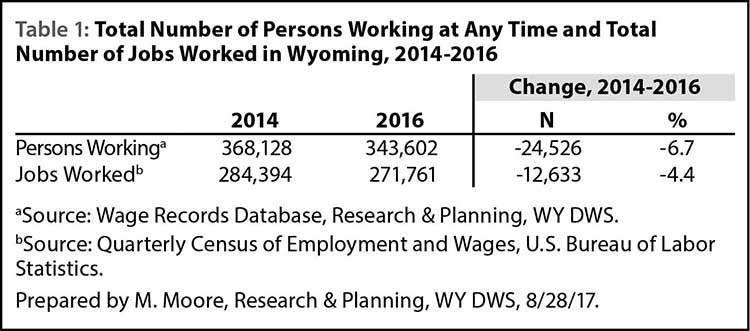
Beginning in second quarter 2015 (2015Q2), Wyoming entered an extended period of economic downturn based on the “substantial decline in the prices of oil, an extended period of low natural gas prices, and the erosion in the price of coal” (Gallagher, 2016). As shown in Figure 1, the total number of persons working in Wyoming at any time declined for the second consecutive year; since 2014, the total number of persons working in Wyoming at any time has decreased from 368,128 to 343,602 – a difference of -24,526 individuals, or -6.7% (see Table 1).

According to data collected through the Quarterly Census of Employment and Wages (QCEW), over-the-year job losses began to occur in 2015Q2 and continued through at least 2017Q1. The total number of jobs worked in Wyoming decreased from an annual average of 284,394 in 2014 to 271,761 in 2016 — a loss of 12,633 jobs, or -4.4% (see Table 1).
This article details the change in number of persons working in Wyoming at any time by industry, county of employment, gender, and age. The full tables from which these data were extracted are available at http://doe.state.wy.us/LMI/earnings_
tables.htm.
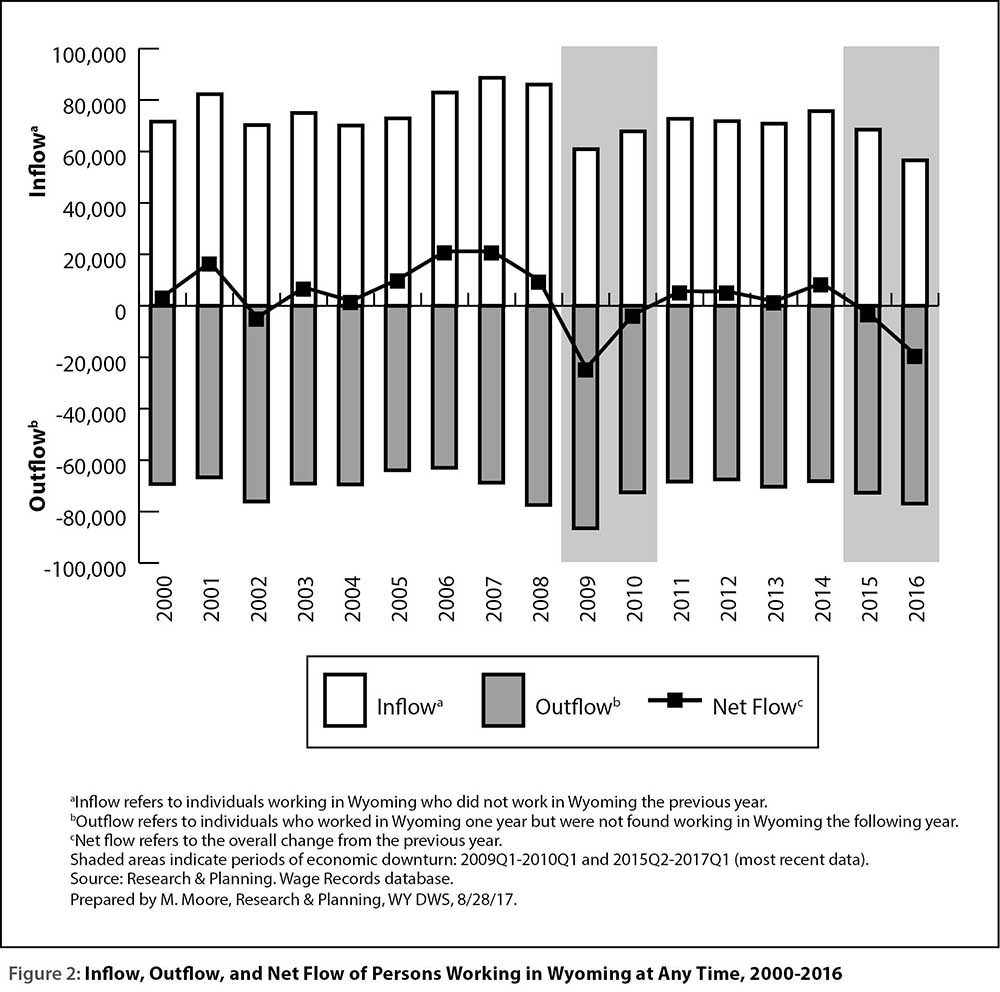
It is important to understand the dynamics of how individuals move in and out of Wyoming’s labor market. During times of rapid economic expansion — such as Wyoming experienced from 2005 to 2008 — more people work in Wyoming. But during times of economic contraction — such as the recent downturn from 2015Q2 to 2017Q1 — fewer people work in Wyoming.
Table 2 and Figure 2 illustrate the change in persons working in Wyoming from year to year. For this article, inflow refers to individuals who worked in Wyoming in one calendar year, but did not work in Wyoming during the previous year. For example, an individual who worked in Wyoming in 2016 but not in 2015 would be considered inflow in 2016. Conversely, outflow refers to individuals who worked in Wyoming in one calendar year, but not the following year. For example, an individual who worked in Wyoming in 2014 but not 2015 would be considered outflow in 2015. Net flow refers to the overall change in the number of persons working from one year for the next. As shown in Table 2 and illustrated in Figure 2, Wyoming’s inflow in 2016 was 56,560 individuals, compared to an outflow of 76,907 individuals. Therefore, the net flow for Wyoming in 2016 was -20,347.

Industry
As previously mentioned, Wyoming entered its most recent economic downturn in 2015 based on a shortage of demand and lower prices for coal, oil, and natural gas. This is reflected in Table 3, which shows that the greatest change in the number of persons working was seen in Wyoming’s mining industry.
The total number of persons working in mining at any time decreased from 35,313 in 2014 to 23,710 in 2016 (-11,603, or -32.9%). Percentagewise, the change in the number of persons working (-32.9%) was similar to the change in the number of jobs worked in mining from 2014Q3 to 2016Q3 (-35.1%; Wen, 2017).

Substantial declines in the numbers of persons working were also seen in construction (-7,538, or -17.7%); wholesale trade, transportation, & utilities (-2,888, or -11.0%); professional & business services (-1,291, or -4.9%); and manufacturing (-1,008, or -8.0%). The growth and contraction of those industries are often tied to Wyoming’s mining industry, which is reflected in these numbers. Gallagher (2017) noted that the manufacturing industry, in particular, is “vulnerable to contractions in energy prices in bad times, or becomes a donor of labor to the mining industry during boom times.”
While most industries experienced a decline in the number of persons working from 2014 to 2016, some experienced growth. The most substantial increase was seen in health care & social assistance (1,056, or 2.9%). This is due in large part to an older population that requires more health care services. In 2015, 28.3% of Wyoming’s population was age 55 and older, and smaller counties such as Hot Springs (41.3%), Platte (39.3%), and Johnson (37.5%) had even greater proportions of older workers (Knapp, 2017).
As shown in Table 3, other industries experienced moderate increases from 2014, including leisure & hospitality (635, or 1.2%), retail trade (297, or 0.7%), and educational services (138, or 0.4%).
County of Employment
From 2014 to 2016, 20 of Wyoming’s 23 counties experienced a decrease in the number of persons working. The most substantial decreases were seen in counties with a high concentration of jobs in mining: Natrona (-5,694, or -10.7%), Campbell (-4,502, or -12.6%), and Sweetwater (-3,570, or -11.5%) counties (see Table 4).
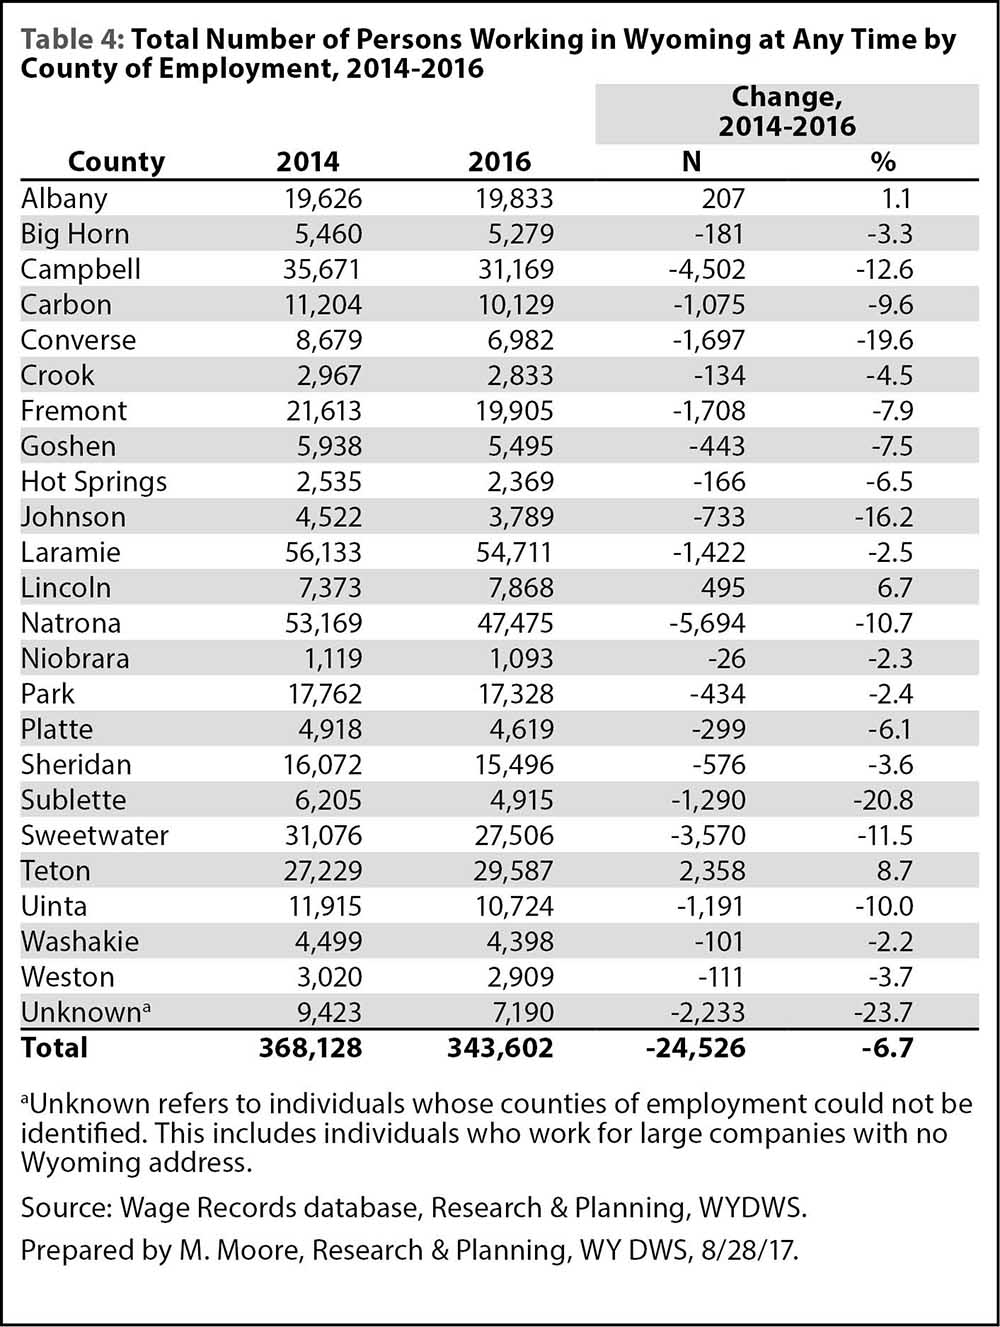
The only counties that experienced an increase in the number of persons working were Teton (2,358, or 8.7%), Lincoln (495, or 6.7%), and Albany (207, or 1.1%). The increase in persons working in Teton County coincides with the increase in persons working in leisure & hospitality, as approximately half of all jobs in Teton County are in the leisure & hospitality industry (Brennan, 2017).
Gender and Age
Table 5 shows the change in the number of persons working by gender and age group from 2014 to 2016. During this period, there was a greater decrease in males (-19,152 individuals, or -10.6%) than females (-7,542, or -5.2%). The more sizeable decrease in males is likely due to the loss of approximately one-third of all jobs in the mining industry (Wen, 2017); these higher paying mining jobs are more often worked by males than females.
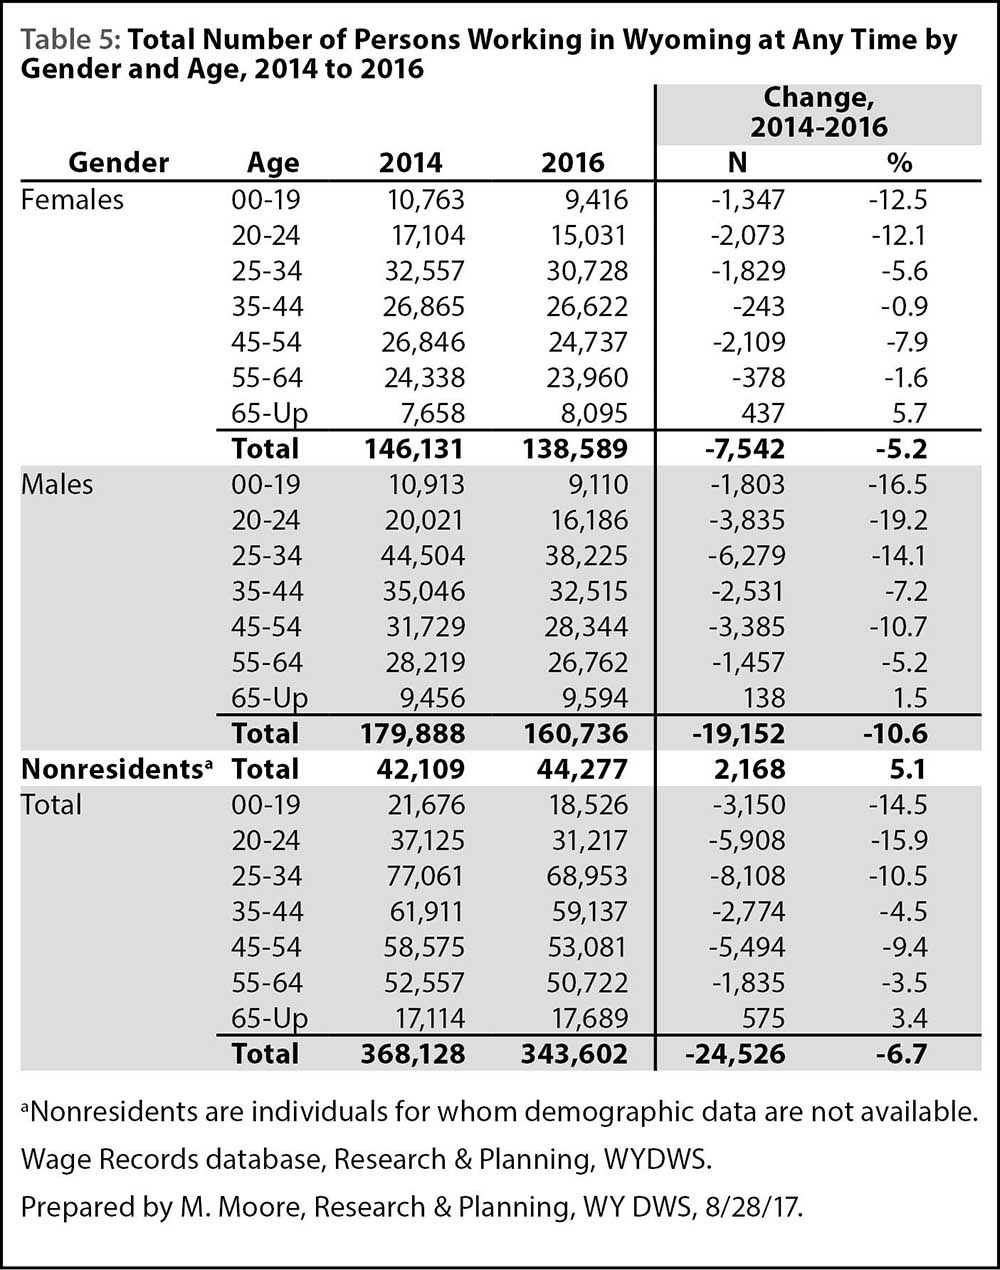
As noted by Harris (2013), younger workers are more likely to be affected by job loss during times of economic downturn than older workers. This can be seen in Table 5, which shows that the most significant change of persons working in Wyoming was in individuals younger than age 35. This may be an indication that during times of economic downturn, employers tend to retain older, more experienced workers and let go of younger workers with less experience.
Nonresidents – individuals for whom demographic data are not available – have historically made up a substantial portion of Wyoming’s workforce (Jones, 2002). Nonresidents are often individuals from another state who work in Wyoming without establishing residency. Table 5 shows that in 2016, there were 44,277 nonresidents working in Wyoming, an increase of 2,168 individuals (5.1%) from 2014.
Conclusion
Since the beginning of the recent economic downturn in 2015Q2, the number of persons working in Wyoming at any time has decreased substantially. From 2014 to 2016, the total number of persons working declined by 6.7%, or -24,526 individuals. This is consistent with the decrease in the number of jobs worked (12,633 jobs, or -4.4%) from 2014 to 2016.
During this recent downturn, younger male workers were the most likely to be affected by job loss. The number of males under age 35 working in Wyoming at any time decreased from 75,438 in 2014 to 63,521 in 2016 (-11,917 individuals, or -26.8%).
The information presented in this article was taken from a series of comprehensive tables available at http://doe.state.wy.us/LMI/earnings_tables.htm.
References
Brennan, N. (2017, July). Table 92: Wyoming employing units, employment, & wages by NAICS subsector for Teton County-Southwest Region, fourth quarter 2016. Quarterly Census of Employment and Wages. Retrieved August 28, 2017, from http://doe.state.wy.us/LMI/16Q4_QCEW/16q4t92.htm
Gallagher, T. (2017, April). Manufacturing Workforce in Wyoming: Economically Needed Diversity Options for Wyoming (ENDOW). Retrieved September 5, 2017, from http://doe.state.wy.us/LMI/Manufacturing_
Workforce_2017.pdf
Jones, S. (2002). Defining residency for the Wyoming workforce. Wyoming Labor Force Trends, 39(11). Retrieved May 23, 2013, from http://doe.state.wy.us/LMI/1102/a1.htm
Knapp, L. (2017, June). Chapter 2: Analysis of Wyoming’s demographics and the health care workforce. Health Care Workforce Needs in Wyoming: Update 2017. Retrieved September 5, 2017, from http://doe.state.wy.us/LMI/health/2017/chapter2.htm
This article was originally published in the August 2017 issue of Wyoming Labor Force Trends.