Wyoming QCEW Summary Statistics by Industry, 2001-2025
Transportation, Warehousing, & Utilities (NAICSa 48-49, 22), 2025Q3
Average Monthly Employment: 12,904
Total Wages: $262,120,893
Average Weekly Wage: $1,563
aNorth American Industry Classification System.
Published April 2026.
| Table: Over-the-Year Change in Private Transportation & Warehousing & Utilities Supersector (NAICSa Sectors 48-49, 22) Average Monthly Employment (AME), Total Wages, and Average Weekly Wage (AWW) Changes by Year/Quarter in Wyoming |
| Published April 2026. |
|
|
|
|
|
|
|
|
|
|
|
|
|
Average Monthly Employment |
Total Wages |
Average Weekly Wage |
| Year/Quarter |
N |
% Change |
$ |
% Change |
$ |
% Change |
| 2001Q1 |
8,335 |
|
$76,343,199 |
|
$705 |
|
| 2001Q2 |
8,435 |
|
$81,026,005 |
|
$739 |
|
| 2001Q3 |
8,627 |
|
$80,432,860 |
|
$717 |
|
| 2001Q4 |
8,526 |
|
$81,916,283 |
|
$739 |
|
| 2002Q1 |
8,455 |
1.4 |
$76,975,478 |
0.8 |
$700 |
-0.6 |
| 2002Q2 |
8,624 |
2.2 |
$87,066,566 |
7.5 |
$777 |
5.1 |
| 2002Q3 |
8,840 |
2.5 |
$84,339,850 |
4.9 |
$734 |
2.3 |
| 2002Q4 |
8,889 |
4.3 |
$90,019,012 |
9.9 |
$779 |
5.4 |
| 2003Q1 |
8,917 |
5.5 |
$81,509,695 |
5.9 |
$703 |
0.4 |
| 2003Q2 |
9,026 |
4.7 |
$92,606,106 |
6.4 |
$789 |
1.6 |
| 2003Q3 |
9,258 |
4.7 |
$89,318,194 |
5.9 |
$742 |
1.1 |
| 2003Q4 |
9,198 |
3.5 |
$96,870,630 |
7.6 |
$810 |
4.0 |
| 2004Q1 |
9,222 |
3.4 |
$87,002,751 |
6.7 |
$726 |
3.2 |
| 2004Q2 |
9,547 |
5.8 |
$98,084,863 |
5.9 |
$790 |
0.1 |
| 2004Q3 |
9,745 |
5.3 |
$97,323,105 |
9.0 |
$768 |
3.5 |
| 2004Q4 |
9,572 |
4.1 |
$104,759,067 |
8.1 |
$842 |
3.9 |
| 2005Q1 |
9,609 |
4.2 |
$93,655,514 |
7.6 |
$750 |
3.3 |
| 2005Q2 |
9,992 |
4.7 |
$108,209,101 |
10.3 |
$833 |
5.4 |
| 2005Q3 |
10,200 |
4.7 |
$113,874,917 |
17.0 |
$859 |
11.8 |
| 2005Q4 |
10,318 |
7.8 |
$114,437,356 |
9.2 |
$853 |
1.3 |
| 2006Q1 |
10,461 |
8.9 |
$115,843,994 |
23.7 |
$852 |
13.6 |
| 2006Q2 |
10,725 |
7.3 |
$125,745,441 |
16.2 |
$902 |
8.3 |
| 2006Q3 |
10,964 |
7.5 |
$119,286,600 |
4.8 |
$837 |
-2.5 |
| 2006Q4 |
10,974 |
6.4 |
$136,381,816 |
19.2 |
$956 |
12.0 |
| 2007Q1 |
11,167 |
6.7 |
$126,097,315 |
8.9 |
$869 |
2.0 |
| 2007Q2 |
11,502 |
7.2 |
$140,473,884 |
11.7 |
$939 |
4.2 |
| 2007Q3 |
12,045 |
9.9 |
$139,267,072 |
16.7 |
$889 |
6.3 |
| 2007Q4 |
12,126 |
10.5 |
$156,303,848 |
14.6 |
$992 |
3.7 |
| 2008Q1 |
11,813 |
5.8 |
$140,975,362 |
11.8 |
$918 |
5.7 |
| 2008Q2 |
11,934 |
3.8 |
$148,754,712 |
5.9 |
$959 |
2.1 |
| 2008Q3 |
12,151 |
0.9 |
$150,996,238 |
8.4 |
$956 |
7.5 |
| 2008Q4 |
12,033 |
-0.8 |
$165,232,525 |
5.7 |
$1,056 |
6.5 |
| 2009Q1 |
11,825 |
0.1 |
$141,126,997 |
0.1 |
$918 |
0.0 |
| 2009Q2 |
11,537 |
-3.3 |
$141,952,084 |
-4.6 |
$946 |
-1.3 |
| 2009Q3 |
11,490 |
-5.4 |
$139,174,785 |
-7.8 |
$932 |
-2.5 |
| 2009Q4 |
11,211 |
-6.8 |
$152,148,327 |
-7.9 |
$1,044 |
-1.2 |
| 2010Q1 |
10,958 |
-7.3 |
$133,397,210 |
-5.5 |
$936 |
2.0 |
| 2010Q2 |
11,113 |
-3.7 |
$143,961,711 |
1.4 |
$996 |
5.3 |
| 2010Q3 |
11,674 |
1.6 |
$151,375,698 |
8.8 |
$997 |
7.0 |
| 2010Q4 |
11,655 |
4.0 |
$164,880,259 |
8.4 |
$1,088 |
4.2 |
| 2011Q1 |
11,485 |
4.8 |
$145,203,154 |
8.9 |
$972 |
3.9 |
| 2011Q2 |
11,746 |
5.7 |
$156,229,687 |
8.5 |
$1,023 |
2.7 |
| 2011Q3 |
12,050 |
3.2 |
$169,557,134 |
12.0 |
$1,082 |
8.5 |
| 2011Q4 |
12,036 |
3.3 |
$168,109,049 |
2.0 |
$1,074 |
-1.3 |
| 2012Q1 |
11,905 |
3.7 |
$158,331,273 |
9.0 |
$1,023 |
5.2 |
| 2012Q2 |
11,939 |
1.6 |
$160,580,120 |
2.8 |
$1,035 |
1.1 |
| 2012Q3 |
12,111 |
0.5 |
$162,992,009 |
-3.9 |
$1,035 |
-4.4 |
| 2012Q4 |
12,131 |
0.8 |
$172,191,627 |
2.4 |
$1,092 |
1.6 |
| 2013Q1 |
12,097 |
1.6 |
$158,659,158 |
0.2 |
$1,009 |
-1.4 |
| 2013Q2 |
12,164 |
1.9 |
$165,162,176 |
2.9 |
$1,044 |
1.0 |
| 2013Q3 |
12,419 |
2.5 |
$170,441,739 |
4.6 |
$1,056 |
2.0 |
| 2013Q4 |
12,405 |
2.3 |
$181,004,952 |
5.1 |
$1,122 |
2.8 |
| 2014Q1 |
12,628 |
4.4 |
$171,954,722 |
8.4 |
$1,047 |
3.8 |
| 2014Q2 |
12,790 |
5.1 |
$174,355,831 |
5.6 |
$1,049 |
0.4 |
| 2014Q3 |
13,210 |
6.4 |
$186,237,546 |
9.3 |
$1,084 |
2.7 |
| 2014Q4 |
13,455 |
8.5 |
$202,874,901 |
12.1 |
$1,160 |
3.3 |
| 2015Q1 |
13,410 |
6.2 |
$185,242,142 |
7.7 |
$1,063 |
1.4 |
| 2015Q2 |
12,974 |
1.4 |
$180,299,742 |
3.4 |
$1,069 |
1.9 |
| 2015Q3 |
13,000 |
-1.6 |
$183,832,867 |
-1.3 |
$1,088 |
0.3 |
| 2015Q4 |
12,797 |
-4.9 |
$194,116,480 |
-4.3 |
$1,167 |
0.6 |
| 2016Q1 |
12,400 |
-7.5 |
$166,170,650 |
-10.3 |
$1,031 |
-3.0 |
| 2016Q2 |
11,927 |
-8.1 |
$166,143,232 |
-7.9 |
$1,072 |
0.2 |
| 2016Q3 |
12,010 |
-7.6 |
$177,136,609 |
-3.6 |
$1,135 |
4.3 |
| 2016Q4 |
12,036 |
-5.9 |
$172,681,022 |
-11.0 |
$1,104 |
-5.4 |
| 2017Q1 |
11,852 |
-4.4 |
$171,084,233 |
3.0 |
$1,110 |
7.7 |
| 2017Q2 |
11,802 |
-1.1 |
$175,037,948 |
5.4 |
$1,141 |
6.5 |
| 2017Q3 |
12,117 |
0.9 |
$170,156,826 |
-3.9 |
$1,080 |
-4.8 |
| 2017Q4 |
12,180 |
1.2 |
$189,121,844 |
9.5 |
$1,194 |
8.2 |
| 2018Q1 |
12,221 |
3.1 |
$180,118,735 |
5.3 |
$1,134 |
2.1 |
| 2018Q2 |
12,196 |
3.3 |
$183,461,412 |
4.8 |
$1,157 |
1.4 |
| 2018Q3 |
12,402 |
2.4 |
$188,969,176 |
11.1 |
$1,172 |
8.5 |
| 2018Q4 |
12,511 |
2.7 |
$203,191,593 |
7.4 |
$1,249 |
4.6 |
| 2019Q1 |
12,397 |
1.4 |
$194,229,212 |
7.8 |
$1,205 |
6.3 |
| 2019Q2 |
12,542 |
2.8 |
$194,757,901 |
6.2 |
$1,194 |
3.2 |
| 2019Q3 |
12,712 |
2.5 |
$196,927,767 |
4.2 |
$1,192 |
1.7 |
| 2019Q4 |
12,699 |
1.5 |
$208,466,825 |
2.6 |
$1,263 |
1.1 |
| 2020Q1 |
12,502 |
0.8 |
$193,616,012 |
-0.3 |
$1,191 |
-1.2 |
| 2020Q2 |
12,058 |
-3.9 |
$182,275,484 |
-6.4 |
$1,163 |
-2.6 |
| 2020Q3 |
11,947 |
-6.0 |
$187,091,988 |
-5.0 |
$1,205 |
1.1 |
| 2020Q4 |
12,276 |
-3.3 |
$206,669,205 |
-0.9 |
$1,295 |
2.6 |
| 2021Q1 |
12,351 |
-1.2 |
$185,363,082 |
-4.3 |
$1,154 |
-3.1 |
| 2021Q2 |
12,293 |
1.9 |
$195,052,260 |
7.0 |
$1,221 |
5.0 |
| 2021Q3 |
12,427 |
4.0 |
$204,253,132 |
9.2 |
$1,264 |
4.9 |
| 2021Q4 |
12,508 |
1.9 |
$223,190,624 |
8.0 |
$1,373 |
6.0 |
| 2022Q1 |
12,107 |
-2.0 |
$201,168,088 |
8.5 |
$1,278 |
10.7 |
| 2022Q2 |
12,009 |
-2.3 |
$202,633,375 |
3.9 |
$1,298 |
6.3 |
| 2022Q3 |
12,320 |
-0.9 |
$222,059,138 |
8.7 |
$1,386 |
9.7 |
| 2022Q4 |
12,394 |
-0.9 |
$221,595,854 |
-0.7 |
$1,375 |
0.1 |
| 2023Q1 |
12,413 |
2.5 |
$231,097,806 |
14.9 |
$1,432 |
12.1 |
| 2023Q2 |
12,430 |
3.5 |
$218,139,732 |
7.7 |
$1,350 |
4.0 |
| 2023Q3 |
12,653 |
2.7 |
$227,051,382 |
2.2 |
$1,380 |
-0.4 |
| 2023Q4 |
12,701 |
2.5 |
$241,672,842 |
9.1 |
$1,464 |
6.5 |
| 2024Q1 |
12,217 |
-1.6 |
$238,446,449 |
3.2 |
$1,501 |
4.8 |
| 2024Q2 |
12,298 |
-1.1 |
$229,904,630 |
5.4 |
$1,438 |
6.5 |
| 2024Q3 |
12,498 |
-1.2 |
$242,032,325 |
6.6 |
$1,490 |
8.0 |
| 2024Q4 |
12,754 |
0.4 |
$276,363,209 |
14.4 |
$1,667 |
13.9 |
| 2025Q1 |
12,757 |
4.4 |
$255,055,823 |
7.0 |
$1,538 |
2.5 |
| 2025Q2 |
12,669 |
3.0 |
$246,007,796 |
7.0 |
$1,494 |
3.9 |
| 2025Q3b |
12,904 |
3.2 |
$262,120,893 |
8.3 |
$1,563 |
4.9 |
|
|
|
|
|
|
|
|
|
|
|
|
|
|
| aNorth American Industry Classification System. |
|
|
|
|
| bPreliminary. |
|
|
|
|
|
|
| Source: Quarterly Census of Employment and Wages. |
|
|
|
|
| Prepared by M. Moore, Research & Planning, WY DWS, 4/3/26. |
|
|
|
|
Figure: Average Monthly Employment in Transportation, Warehousing, & Utilities (NAICS 48-49, 22) in Wyoming, 2001Q1-2025Q3
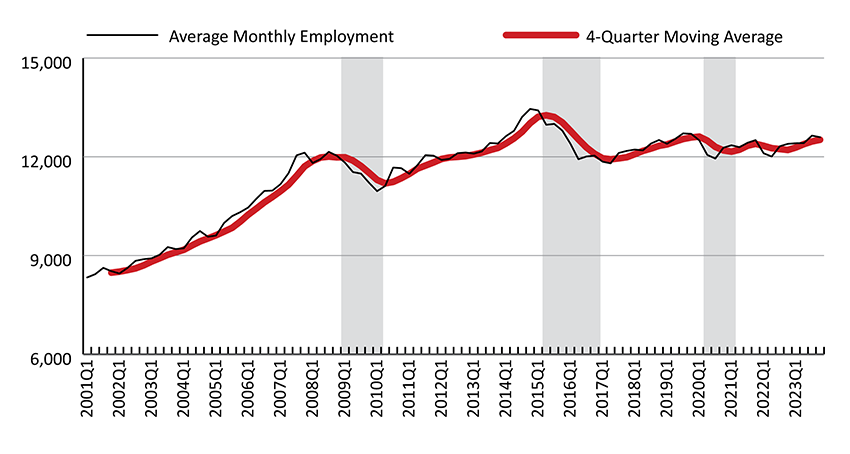
Figure: Over-the-Year Percent Change in Average Monthly Employment and Total Wages in Transportation, Warehousing, & Utilities (NAICS 48-49, 22) in Wyoming, 2002Q1-2025Q3
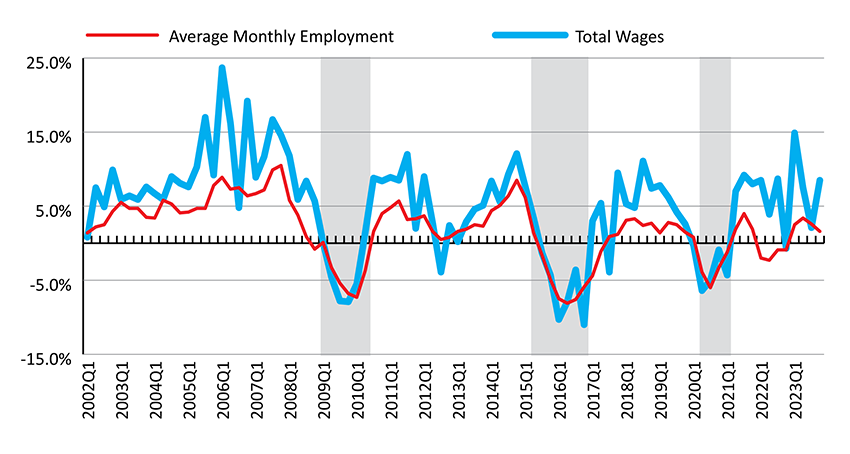
Shaded areas indicate periods of economic downturn: 2009Q1-2010Q1, 2015Q2-2016Q4, and 2020Q2-2021Q1.
Source: Quarterly Census of Employment and Wages.
Prepared by M. Moore, Research & Planning, WY DWS, 4/3/26.
 Hire Wyo