Wyoming QCEW Summary Statistics by Industry, 2001-2025
State Government, 2025Q3
Average Monthly Employment: 13,152
Total Wages :$228,284,151
Average Weekly Wage: $1,335
Published April 2026.
| Table: Over-the-Year Change in State Government (Ownership 20) Average Monthly Employment (AME), Total Wages, and Average Weekly Wage (AWW) Changes by Year/Quarter in Wyoming |
| Published April 2026. |
|
|
|
|
|
|
|
|
|
|
|
|
|
Average Monthly Employment |
Total Wages |
Average Weekly Wage |
| Year/Quarter |
N |
% Change |
$ |
% Change |
$ |
% Change |
| 2001Q1 |
11,859 |
|
$93,406,731 |
|
$606 |
|
| 2001Q2 |
12,059 |
|
$96,356,850 |
|
$615 |
|
| 2001Q3 |
12,218 |
|
$106,689,021 |
|
$672 |
|
| 2001Q4 |
12,063 |
|
$103,270,601 |
|
$659 |
|
| 2002Q1 |
12,158 |
2.5 |
$105,376,416 |
12.8 |
$667 |
10.0 |
| 2002Q2 |
12,377 |
2.6 |
$107,100,092 |
11.1 |
$666 |
8.3 |
| 2002Q3 |
12,510 |
2.4 |
$113,204,364 |
6.1 |
$696 |
3.6 |
| 2002Q4 |
12,513 |
3.7 |
$112,132,546 |
8.6 |
$689 |
4.7 |
| 2003Q1 |
12,587 |
3.5 |
$113,146,647 |
7.4 |
$691 |
3.7 |
| 2003Q2 |
12,700 |
2.6 |
$116,123,765 |
8.4 |
$703 |
5.7 |
| 2003Q3 |
12,807 |
2.4 |
$116,579,336 |
3.0 |
$700 |
0.6 |
| 2003Q4 |
12,714 |
1.6 |
$118,920,591 |
6.1 |
$720 |
4.4 |
| 2004Q1 |
14,108 |
12.1 |
$117,659,161 |
4.0 |
$642 |
-7.2 |
| 2004Q2 |
14,421 |
13.5 |
$121,311,629 |
4.5 |
$647 |
-8.0 |
| 2004Q3 |
14,380 |
12.3 |
$126,175,222 |
8.2 |
$675 |
-3.6 |
| 2004Q4 |
14,318 |
12.6 |
$119,576,346 |
0.6 |
$642 |
-10.7 |
| 2005Q1 |
12,535 |
-11.1 |
$119,761,828 |
1.8 |
$735 |
14.6 |
| 2005Q2 |
12,706 |
-11.9 |
$123,409,790 |
1.7 |
$747 |
15.5 |
| 2005Q3 |
12,722 |
-11.5 |
$127,680,669 |
1.2 |
$772 |
14.4 |
| 2005Q4 |
12,514 |
-12.6 |
$125,121,760 |
4.6 |
$769 |
19.7 |
| 2006Q1 |
12,319 |
-1.7 |
$126,392,988 |
5.5 |
$789 |
7.4 |
| 2006Q2 |
12,537 |
-1.3 |
$129,642,584 |
5.1 |
$795 |
6.5 |
| 2006Q3 |
12,413 |
-2.4 |
$134,514,153 |
5.4 |
$834 |
8.0 |
| 2006Q4 |
12,297 |
-1.7 |
$132,311,258 |
5.7 |
$828 |
7.6 |
| 2007Q1 |
12,449 |
1.1 |
$134,748,173 |
6.6 |
$833 |
5.5 |
| 2007Q2 |
12,740 |
1.6 |
$137,581,567 |
6.1 |
$831 |
4.4 |
| 2007Q3 |
12,625 |
1.7 |
$147,934,696 |
10.0 |
$901 |
8.1 |
| 2007Q4 |
12,487 |
1.5 |
$145,905,703 |
10.3 |
$899 |
8.6 |
| 2008Q1 |
12,576 |
1.0 |
$148,361,703 |
10.1 |
$907 |
9.0 |
| 2008Q2 |
12,906 |
1.3 |
$150,719,537 |
9.5 |
$898 |
8.1 |
| 2008Q3 |
12,913 |
2.3 |
$158,032,484 |
6.8 |
$941 |
4.4 |
| 2008Q4 |
12,942 |
3.6 |
$157,558,063 |
8.0 |
$936 |
4.2 |
| 2009Q1 |
13,235 |
5.2 |
$159,924,338 |
7.8 |
$929 |
2.4 |
| 2009Q2 |
13,424 |
4.0 |
$162,406,703 |
7.8 |
$931 |
3.6 |
| 2009Q3 |
13,471 |
4.3 |
$167,290,338 |
5.9 |
$955 |
1.5 |
| 2009Q4 |
13,283 |
2.6 |
$164,703,436 |
4.5 |
$954 |
1.8 |
| 2010Q1 |
13,172 |
-0.5 |
$166,672,553 |
4.2 |
$973 |
4.7 |
| 2010Q2 |
13,387 |
-0.3 |
$171,020,001 |
5.3 |
$983 |
5.6 |
| 2010Q3 |
13,552 |
0.6 |
$171,647,004 |
2.6 |
$974 |
2.0 |
| 2010Q4 |
13,244 |
-0.3 |
$168,880,522 |
2.5 |
$981 |
2.8 |
| 2011Q1 |
13,278 |
0.8 |
$169,511,804 |
1.7 |
$982 |
0.9 |
| 2011Q2 |
13,454 |
0.5 |
$172,017,888 |
0.6 |
$984 |
0.1 |
| 2011Q3 |
13,587 |
0.3 |
$175,481,845 |
2.2 |
$993 |
2.0 |
| 2011Q4 |
13,200 |
-0.3 |
$171,840,475 |
1.8 |
$1,001 |
2.1 |
| 2012Q1 |
13,252 |
-0.2 |
$172,406,562 |
1.7 |
$1,001 |
1.9 |
| 2012Q2 |
13,413 |
-0.3 |
$174,431,346 |
1.4 |
$1,000 |
1.7 |
| 2012Q3 |
13,552 |
-0.3 |
$175,282,859 |
-0.1 |
$995 |
0.1 |
| 2012Q4 |
13,156 |
-0.3 |
$171,361,710 |
-0.3 |
$1,002 |
0.1 |
| 2013Q1 |
13,238 |
-0.1 |
$172,286,846 |
-0.1 |
$1,001 |
0.0 |
| 2013Q2 |
13,386 |
-0.2 |
$174,675,617 |
0.1 |
$1,004 |
0.3 |
| 2013Q3 |
13,432 |
-0.9 |
$174,287,731 |
-0.6 |
$998 |
0.3 |
| 2013Q4 |
13,015 |
-1.1 |
$172,969,946 |
0.9 |
$1,022 |
2.0 |
| 2014Q1 |
13,068 |
-1.3 |
$171,361,268 |
-0.5 |
$1,009 |
0.8 |
| 2014Q2 |
13,162 |
-1.7 |
$172,715,868 |
-1.1 |
$1,009 |
0.6 |
| 2014Q3 |
13,364 |
-0.5 |
$176,866,480 |
1.5 |
$1,018 |
2.0 |
| 2014Q4 |
12,816 |
-1.5 |
$172,548,365 |
-0.2 |
$1,036 |
1.3 |
| 2015Q1 |
12,873 |
-1.5 |
$172,858,176 |
0.9 |
$1,033 |
2.4 |
| 2015Q2 |
13,170 |
0.1 |
$176,883,555 |
2.4 |
$1,033 |
2.4 |
| 2015Q3 |
13,606 |
1.8 |
$183,388,317 |
3.7 |
$1,037 |
1.8 |
| 2015Q4 |
12,898 |
0.6 |
$178,858,035 |
3.7 |
$1,067 |
3.0 |
| 2016Q1 |
12,909 |
0.3 |
$177,885,936 |
2.9 |
$1,060 |
2.6 |
| 2016Q2 |
13,130 |
-0.3 |
$181,054,535 |
2.4 |
$1,061 |
2.7 |
| 2016Q3 |
13,135 |
-3.5 |
$180,692,809 |
-1.5 |
$1,058 |
2.1 |
| 2016Q4 |
12,569 |
-2.5 |
$173,366,931 |
-3.1 |
$1,061 |
-0.5 |
| 2017Q1 |
12,696 |
-1.7 |
$174,650,734 |
-1.8 |
$1,058 |
-0.2 |
| 2017Q2 |
12,938 |
-1.5 |
$177,738,035 |
-1.8 |
$1,057 |
-0.4 |
| 2017Q3 |
12,964 |
-1.3 |
$181,136,542 |
0.2 |
$1,075 |
1.6 |
| 2017Q4 |
12,351 |
-1.7 |
$172,082,835 |
-0.7 |
$1,072 |
1.0 |
| 2018Q1 |
12,368 |
-2.6 |
$172,630,546 |
-1.2 |
$1,074 |
1.5 |
| 2018Q2 |
12,599 |
-2.6 |
$175,948,092 |
-1.0 |
$1,074 |
1.7 |
| 2018Q3 |
12,857 |
-0.8 |
$176,998,900 |
-2.3 |
$1,059 |
-1.5 |
| 2018Q4 |
12,289 |
-0.5 |
$173,759,263 |
1.0 |
$1,088 |
1.5 |
| 2019Q1 |
12,299 |
-0.6 |
$174,172,829 |
0.9 |
$1,089 |
1.5 |
| 2019Q2 |
12,626 |
0.2 |
$177,984,899 |
1.2 |
$1,084 |
0.9 |
| 2019Q3 |
12,637 |
-1.7 |
$180,818,373 |
2.2 |
$1,101 |
3.9 |
| 2019Q4 |
12,345 |
0.5 |
$179,438,382 |
3.3 |
$1,118 |
2.8 |
| 2020Q1 |
12,436 |
1.1 |
$177,665,605 |
2.0 |
$1,099 |
0.9 |
| 2020Q2 |
12,681 |
0.4 |
$183,413,655 |
3.1 |
$1,113 |
2.6 |
| 2020Q3 |
12,639 |
0.0 |
$181,606,740 |
0.4 |
$1,105 |
0.4 |
| 2020Q4 |
12,293 |
-0.4 |
$178,466,891 |
-0.5 |
$1,117 |
-0.1 |
| 2021Q1 |
12,317 |
-1.0 |
$176,637,737 |
-0.6 |
$1,103 |
0.4 |
| 2021Q2 |
12,438 |
-1.9 |
$181,295,465 |
-1.2 |
$1,121 |
0.8 |
| 2021Q3 |
12,436 |
-1.6 |
$180,729,817 |
-0.5 |
$1,118 |
1.1 |
| 2021Q4 |
12,043 |
-2.0 |
$175,573,130 |
-1.6 |
$1,121 |
0.4 |
| 2022Q1 |
12,001 |
-2.6 |
$174,451,770 |
-1.2 |
$1,118 |
1.4 |
| 2022Q2 |
12,108 |
-2.7 |
$180,348,130 |
-0.5 |
$1,146 |
2.2 |
| 2022Q3 |
12,160 |
-2.2 |
$189,559,261 |
4.9 |
$1,199 |
7.3 |
| 2022Q4 |
11,929 |
-0.9 |
$188,026,475 |
7.1 |
$1,212 |
8.1 |
| 2023Q1 |
11,968 |
-0.3 |
$190,819,379 |
9.4 |
$1,227 |
9.7 |
| 2023Q2 |
12,274 |
1.4 |
$194,686,130 |
8.0 |
$1,220 |
6.5 |
| 2023Q3 |
12,296 |
1.1 |
$210,648,918 |
11.1 |
$1,318 |
9.9 |
| 2023Q4 |
12,401 |
4.0 |
$206,909,989 |
10.0 |
$1,283 |
5.9 |
| 2024Q1 |
12,543 |
4.8 |
$209,679,272 |
9.9 |
$1,286 |
4.8 |
| 2024Q2 |
12,893 |
5.0 |
$216,059,409 |
11.0 |
$1,289 |
5.7 |
| 2024Q3 |
12,870 |
4.7 |
$220,833,184 |
4.8 |
$1,320 |
0.2 |
| 2024Q4 |
12,975 |
4.6 |
$215,619,062 |
4.2 |
$1,278 |
-0.4 |
| 2025Q1 |
12,787 |
1.9 |
$218,653,744 |
4.3 |
$1,315 |
2.3 |
| 2025Q2 |
13,226 |
2.6 |
$223,096,234 |
3.3 |
$1,298 |
0.7 |
| 2025Q3b |
13,152 |
2.2 |
$228,284,151 |
3.4 |
$1,335 |
1.2 |
|
|
|
|
|
|
|
|
|
|
|
|
|
|
| aPreliminary. |
|
|
|
|
|
|
| Source: Quarterly Census of Employment and Wages. |
|
|
|
|
| Prepared by M. Moore, Research & Planning, WY DWS, 4/3/26. |
|
|
|
|
Figure: Average Monthly Employment in State Government in Wyoming, 2001Q1-2025Q3
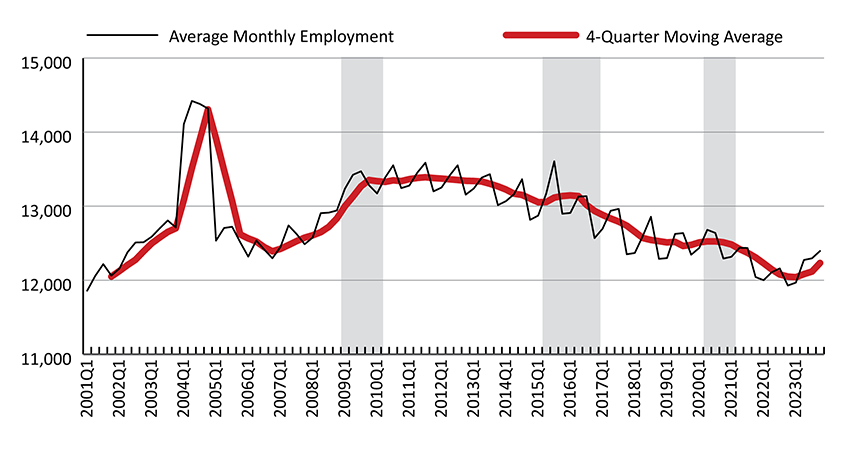
Figure: Over-the-Year Percent Change in Average Monthly Employment and Total Wages in State Government in Wyoming, 2002Q1-2025Q3
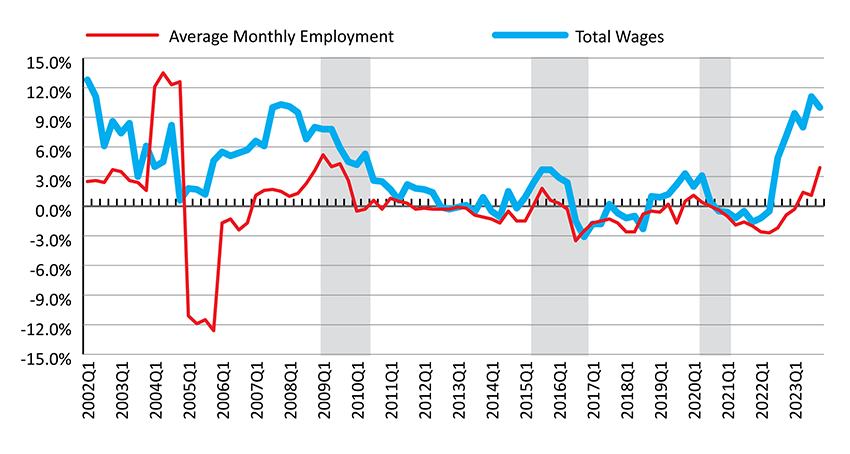
Shaded areas indicate periods of economic downturn: 2009Q1-2010Q1, 2015Q2-2016Q4, and 2020Q2-2021Q1.
Source: Quarterly Census of Employment and Wages.
Prepared by M. Moore, Research & Planning, WY DWS, 4/3/26.
 Hire Wyo