Wyoming QCEW Summary Statistics by Industry, 2001-2025
Leisure & Hospitality (NAICSa 71-72), 2025Q3
Average Monthly Employment: 43,289
Total Wages: $341,150,772
Average Weekly Wage: $606
aNorth American Industry Classification System.
Published April 2026.
| Table: Over-the-Year Change in Private Leisure & Hospitality Supersector (NAICSa Sectors 71 & 72) Average Monthly Employment (AME), Total Wages, and Average Weekly Wage (AWW) Changes by Year/Quarter in Wyoming |
| Published April 2026. |
|
|
|
|
|
|
|
|
|
|
|
|
|
Average Monthly Employment |
Total Wages |
Average Weekly Wage |
| Year/Quarter |
N |
% Change |
$ |
% Change |
$ |
% Change |
| 2001Q1 |
26,564 |
|
$71,904,672 |
|
$208 |
|
| 2001Q2 |
30,249 |
|
$79,351,504 |
|
$202 |
|
| 2001Q3 |
34,419 |
|
$101,984,198 |
|
$228 |
|
| 2001Q4 |
27,231 |
|
$80,032,079 |
|
$226 |
|
| 2002Q1 |
26,900 |
1.3 |
$75,528,674 |
5.0 |
$216 |
3.7 |
| 2002Q2 |
30,754 |
1.7 |
$84,684,665 |
6.7 |
$212 |
5.0 |
| 2002Q3 |
35,286 |
2.5 |
$110,089,665 |
7.9 |
$240 |
5.3 |
| 2002Q4 |
28,140 |
3.3 |
$84,506,768 |
5.6 |
$231 |
2.2 |
| 2003Q1 |
27,565 |
2.5 |
$81,841,347 |
8.4 |
$228 |
5.7 |
| 2003Q2 |
31,201 |
1.5 |
$87,383,937 |
3.2 |
$215 |
1.7 |
| 2003Q3 |
35,575 |
0.8 |
$114,899,208 |
4.4 |
$248 |
3.5 |
| 2003Q4 |
28,710 |
2.0 |
$89,543,627 |
6.0 |
$240 |
3.9 |
| 2004Q1 |
28,381 |
3.0 |
$91,314,139 |
11.6 |
$247 |
8.4 |
| 2004Q2 |
31,962 |
2.4 |
$95,509,285 |
9.3 |
$230 |
6.7 |
| 2004Q3 |
36,005 |
1.2 |
$122,228,174 |
6.4 |
$261 |
5.1 |
| 2004Q4 |
29,656 |
3.3 |
$97,384,552 |
8.8 |
$253 |
5.3 |
| 2005Q1 |
28,938 |
2.0 |
$98,600,890 |
8.0 |
$262 |
5.9 |
| 2005Q2 |
32,404 |
1.4 |
$101,695,134 |
6.5 |
$241 |
5.0 |
| 2005Q3 |
36,786 |
2.2 |
$134,186,999 |
9.8 |
$281 |
7.5 |
| 2005Q4 |
30,035 |
1.3 |
$103,856,242 |
6.6 |
$266 |
5.3 |
| 2006Q1 |
29,757 |
2.8 |
$107,424,220 |
8.9 |
$278 |
5.9 |
| 2006Q2 |
32,759 |
1.1 |
$108,332,002 |
6.5 |
$254 |
5.4 |
| 2006Q3 |
37,120 |
0.9 |
$199,660,794 |
48.8 |
$414 |
47.5 |
| 2006Q4 |
30,800 |
2.5 |
$115,799,479 |
11.5 |
$289 |
8.7 |
| 2007Q1 |
30,883 |
3.8 |
$117,937,108 |
9.8 |
$294 |
5.8 |
| 2007Q2 |
33,487 |
2.2 |
$120,891,335 |
11.6 |
$278 |
9.2 |
| 2007Q3 |
37,912 |
2.1 |
$156,400,157 |
-21.7 |
$317 |
-23.3 |
| 2007Q4 |
31,594 |
2.6 |
$139,184,127 |
20.2 |
$339 |
17.2 |
| 2008Q1 |
31,971 |
3.5 |
$129,580,224 |
9.9 |
$312 |
6.1 |
| 2008Q2 |
34,853 |
4.1 |
$130,813,429 |
8.2 |
$289 |
4.0 |
| 2008Q3 |
39,004 |
2.9 |
$168,986,624 |
8.0 |
$333 |
5.0 |
| 2008Q4 |
32,123 |
1.7 |
$133,791,292 |
-3.9 |
$320 |
-5.5 |
| 2009Q1 |
30,988 |
-3.1 |
$122,158,963 |
-5.7 |
$303 |
-2.7 |
| 2009Q2 |
33,082 |
-5.1 |
$124,510,320 |
-4.8 |
$290 |
0.3 |
| 2009Q3 |
37,458 |
-4.0 |
$165,339,634 |
-2.2 |
$340 |
1.9 |
| 2009Q4 |
30,135 |
-6.2 |
$125,387,908 |
-6.3 |
$320 |
-0.1 |
| 2010Q1 |
29,538 |
-4.7 |
$116,094,673 |
-5.0 |
$302 |
-0.3 |
| 2010Q2 |
32,569 |
-1.6 |
$124,024,834 |
-0.4 |
$293 |
1.2 |
| 2010Q3 |
37,672 |
0.6 |
$167,626,371 |
1.4 |
$342 |
0.8 |
| 2010Q4 |
30,714 |
1.9 |
$132,124,448 |
5.4 |
$331 |
3.4 |
| 2011Q1 |
29,936 |
1.3 |
$119,445,110 |
2.9 |
$307 |
1.5 |
| 2011Q2 |
32,679 |
0.3 |
$128,166,866 |
3.3 |
$302 |
3.0 |
| 2011Q3 |
38,225 |
1.5 |
$174,930,518 |
4.4 |
$352 |
2.8 |
| 2011Q4 |
31,394 |
2.2 |
$133,475,780 |
1.0 |
$327 |
-1.2 |
| 2012Q1 |
30,782 |
2.8 |
$135,282,254 |
13.3 |
$338 |
10.1 |
| 2012Q2 |
33,728 |
3.2 |
$135,197,812 |
5.5 |
$308 |
2.2 |
| 2012Q3 |
38,924 |
1.8 |
$178,177,600 |
1.9 |
$352 |
0.0 |
| 2012Q4 |
32,247 |
2.7 |
$140,339,453 |
5.1 |
$335 |
2.4 |
| 2013Q1 |
31,461 |
2.2 |
$151,300,479 |
11.8 |
$370 |
9.4 |
| 2013Q2 |
34,465 |
2.2 |
$141,508,677 |
4.7 |
$316 |
2.4 |
| 2013Q3 |
39,758 |
2.1 |
$185,331,906 |
4.0 |
$359 |
1.8 |
| 2013Q4 |
32,749 |
1.6 |
$144,491,672 |
3.0 |
$339 |
1.4 |
| 2014Q1 |
32,157 |
2.2 |
$148,098,961 |
-2.1 |
$354 |
-4.2 |
| 2014Q2 |
35,353 |
2.6 |
$150,372,429 |
6.3 |
$327 |
3.6 |
| 2014Q3 |
40,430 |
1.7 |
$197,290,510 |
6.5 |
$375 |
4.7 |
| 2014Q4 |
33,429 |
2.1 |
$157,065,535 |
8.7 |
$361 |
6.5 |
| 2015Q1 |
33,281 |
3.5 |
$156,429,830 |
5.6 |
$362 |
2.1 |
| 2015Q2 |
36,378 |
2.9 |
$157,892,971 |
5.0 |
$334 |
2.0 |
| 2015Q3 |
41,234 |
2.0 |
$206,434,789 |
4.6 |
$385 |
2.6 |
| 2015Q4 |
33,659 |
0.7 |
$163,856,944 |
4.3 |
$374 |
3.6 |
| 2016Q1 |
32,834 |
-1.3 |
$155,563,876 |
-0.6 |
$364 |
0.8 |
| 2016Q2 |
35,950 |
-1.2 |
$162,419,287 |
2.9 |
$348 |
4.1 |
| 2016Q3 |
41,090 |
-0.3 |
$214,264,155 |
3.8 |
$401 |
4.2 |
| 2016Q4 |
33,596 |
-0.2 |
$162,006,544 |
-1.1 |
$371 |
-0.9 |
| 2017Q1 |
33,138 |
0.9 |
$160,747,415 |
3.3 |
$373 |
2.4 |
| 2017Q2 |
36,366 |
1.2 |
$168,656,097 |
3.8 |
$357 |
2.7 |
| 2017Q3 |
41,552 |
1.1 |
$221,039,420 |
3.2 |
$409 |
2.0 |
| 2017Q4 |
34,088 |
1.5 |
$170,374,338 |
5.2 |
$384 |
3.6 |
| 2018Q1 |
33,457 |
1.0 |
$176,713,858 |
9.9 |
$406 |
8.9 |
| 2018Q2 |
36,831 |
1.3 |
$179,343,070 |
6.3 |
$375 |
5.0 |
| 2018Q3 |
41,196 |
-0.9 |
$235,457,248 |
6.5 |
$440 |
7.4 |
| 2018Q4 |
34,125 |
0.1 |
$182,802,882 |
7.3 |
$412 |
7.2 |
| 2019Q1 |
33,930 |
1.4 |
$188,804,768 |
6.8 |
$428 |
5.4 |
| 2019Q2 |
37,136 |
0.8 |
$189,523,212 |
5.7 |
$393 |
4.8 |
| 2019Q3 |
42,070 |
2.1 |
$244,058,578 |
3.7 |
$446 |
1.5 |
| 2019Q4 |
35,029 |
2.7 |
$192,307,708 |
5.2 |
$422 |
2.5 |
| 2020Q1 |
34,568 |
1.9 |
$203,265,743 |
7.7 |
$452 |
5.7 |
| 2020Q2 |
26,816 |
-27.8 |
$139,289,413 |
-26.5 |
$400 |
1.9 |
| 2020Q3 |
35,963 |
-14.5 |
$210,789,657 |
-13.6 |
$451 |
1.0 |
| 2020Q4 |
31,870 |
-9.0 |
$190,954,963 |
-0.7 |
$461 |
9.2 |
| 2021Q1 |
31,932 |
-7.6 |
$177,645,626 |
-12.6 |
$428 |
-5.4 |
| 2021Q2 |
36,063 |
34.5 |
$207,237,192 |
48.8 |
$442 |
10.5 |
| 2021Q3 |
40,792 |
13.4 |
$270,238,699 |
28.2 |
$510 |
13.1 |
| 2021Q4 |
34,535 |
8.4 |
$226,248,790 |
18.5 |
$504 |
9.3 |
| 2022Q1 |
34,782 |
8.9 |
$239,234,115 |
34.7 |
$529 |
23.6 |
| 2022Q2 |
37,613 |
4.3 |
$229,879,717 |
10.9 |
$470 |
6.3 |
| 2022Q3 |
42,014 |
3.0 |
$301,382,983 |
11.5 |
$552 |
8.2 |
| 2022Q4 |
35,426 |
2.6 |
$234,558,144 |
3.7 |
$509 |
1.0 |
| 2023Q1 |
35,387 |
1.7 |
$238,865,630 |
-0.2 |
$519 |
-1.9 |
| 2023Q2 |
38,511 |
2.4 |
$247,998,850 |
7.9 |
$495 |
5.3 |
| 2023Q3 |
43,280 |
3.0 |
$313,762,743 |
4.1 |
$558 |
1.1 |
| 2023Q4 |
35,792 |
1.0 |
$249,190,196 |
6.2 |
$536 |
5.3 |
| 2024Q1 |
35,101 |
-0.8 |
$247,356,938 |
3.6 |
$542 |
4.4 |
| 2024Q2 |
38,622 |
0.3 |
$257,405,535 |
3.8 |
$513 |
3.6 |
| 2024Q3 |
43,655 |
0.9 |
$332,032,961 |
5.8 |
$585 |
4.8 |
| 2024Q4 |
35,971 |
0.5 |
$260,305,976 |
4.5 |
$557 |
3.9 |
| 2025Q1 |
35,115 |
0.0 |
$253,344,115 |
2.4 |
$555 |
2.4 |
| 2025Q2 |
38,571 |
-0.1 |
$267,183,233 |
3.8 |
$533 |
3.9 |
| 2025Q3b |
43,289 |
-0.8 |
$341,150,772 |
2.7 |
$606 |
3.6 |
|
|
|
|
|
|
|
|
|
|
|
|
|
|
| aNorth American Industry Classification System. |
|
|
|
|
| bPreliminary. |
|
|
|
|
|
|
| Source: Quarterly Census of Employment and Wages. |
|
|
|
|
| Prepared by M. Moore, Research & Planning, WY DWS, 4/3/26. |
|
|
|
|
Figure: Average Monthly Employment in Leisure & Hospitality (NAICS 71-72) in Wyoming, 2001Q1-2025Q3
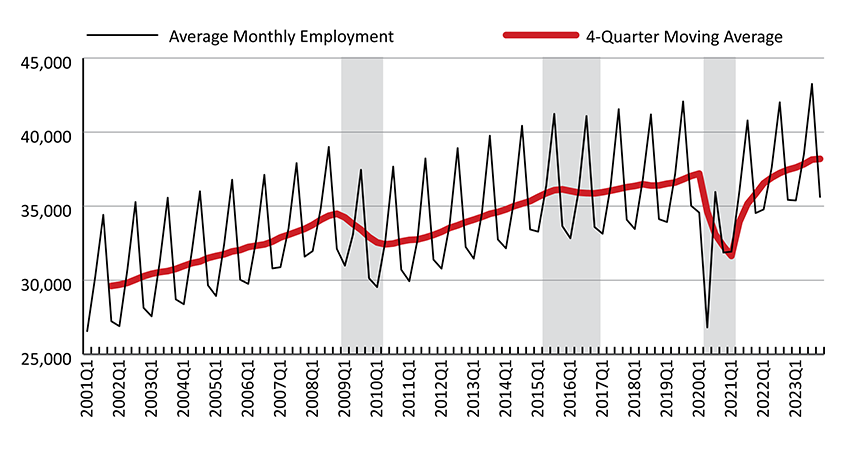
Figure: Over-the-Year Percent Change in Average Monthly Employment and Total Wages in Leisure & Hospitality (NAICS 71-72) in Wyoming, 2002Q1-2025Q3
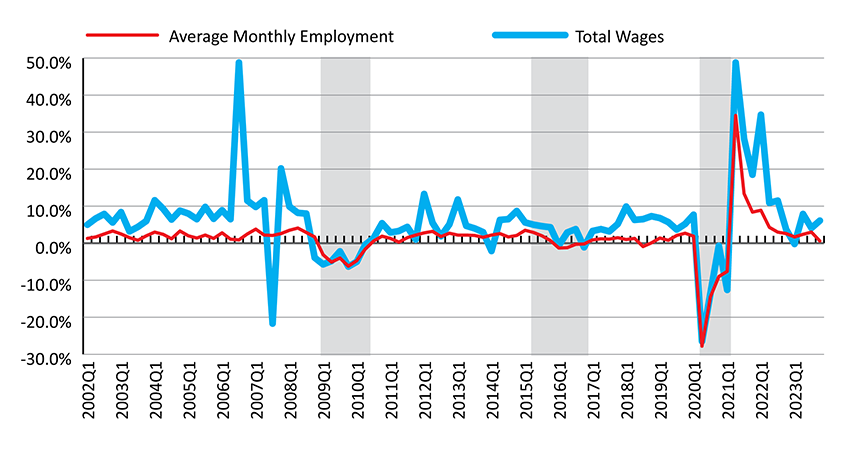
Shaded areas indicate periods of economic downturn: 2009Q1-2010Q1, 2015Q2-2016Q4, and 2020Q2-2021Q1.
Source: Quarterly Census of Employment and Wages.
Prepared by M. Moore, Research & Planning, WY DWS, 4/3/26.
 Hire Wyo