Wyoming QCEW Summary Statistics by Industry, 2001-2025
Information (NAICSa 51), 2025Q3
Average Monthly Employment: 3,085
Total Wages: $62,787,327
Average Weekly Wage: $1,566
aNorth American Industry Classification System.
Published April 2026.
| Table: Over-the-Year Change in Information Sector (NAICSa Sector 51) Average Monthly Employment (AME), Total Wages, and Average Weekly Wage (AWW) Changes by Year/Quarter in Wyoming |
| Published April 2026. |
|
|
|
|
|
|
|
|
|
|
|
|
|
Average Monthly Employment |
Total Wages |
Average Weekly Wage |
| Year/Quarter |
N |
% Change |
$ |
% Change |
$ |
% Change |
| 2001Q1 |
3,949 |
|
$29,039,666 |
|
$566 |
|
| 2001Q2 |
3,975 |
|
$28,844,622 |
|
$558 |
|
| 2001Q3 |
4,045 |
|
$27,802,589 |
|
$529 |
|
| 2001Q4 |
3,977 |
|
$31,255,567 |
|
$604 |
|
| 2002Q1 |
4,251 |
7.7 |
$29,627,819 |
2.0 |
$536 |
-5.2 |
| 2002Q2 |
4,157 |
4.6 |
$29,579,698 |
2.5 |
$547 |
-1.9 |
| 2002Q3 |
4,113 |
1.7 |
$28,597,026 |
2.9 |
$535 |
1.2 |
| 2002Q4 |
4,067 |
2.3 |
$30,892,942 |
-1.2 |
$584 |
-3.3 |
| 2003Q1 |
4,154 |
-2.3 |
$28,912,363 |
-2.4 |
$535 |
-0.1 |
| 2003Q2 |
4,191 |
0.8 |
$30,438,797 |
2.9 |
$559 |
2.1 |
| 2003Q3 |
4,181 |
1.7 |
$30,047,390 |
5.1 |
$553 |
3.4 |
| 2003Q4 |
4,170 |
2.5 |
$31,591,347 |
2.3 |
$583 |
-0.3 |
| 2004Q1 |
4,268 |
2.8 |
$32,517,449 |
12.5 |
$586 |
9.5 |
| 2004Q2 |
4,251 |
1.4 |
$32,150,498 |
5.6 |
$582 |
4.1 |
| 2004Q3 |
4,399 |
5.2 |
$33,112,314 |
10.2 |
$579 |
4.7 |
| 2004Q4 |
4,293 |
2.9 |
$34,860,904 |
10.3 |
$625 |
7.2 |
| 2005Q1 |
4,285 |
0.4 |
$30,860,443 |
-5.1 |
$554 |
-5.5 |
| 2005Q2 |
4,326 |
1.8 |
$31,435,087 |
-2.2 |
$559 |
-3.9 |
| 2005Q3 |
4,286 |
-2.6 |
$33,738,492 |
1.9 |
$605 |
4.6 |
| 2005Q4 |
4,286 |
-0.2 |
$33,857,274 |
-2.9 |
$608 |
-2.7 |
| 2006Q1 |
4,238 |
-1.1 |
$34,597,907 |
12.1 |
$628 |
13.4 |
| 2006Q2 |
4,157 |
-3.9 |
$34,049,555 |
8.3 |
$630 |
12.7 |
| 2006Q3 |
4,168 |
-2.8 |
$34,227,452 |
1.4 |
$632 |
4.3 |
| 2006Q4 |
4,123 |
-3.8 |
$35,690,459 |
5.4 |
$666 |
9.6 |
| 2007Q1 |
3,988 |
-5.9 |
$36,758,052 |
6.2 |
$709 |
12.9 |
| 2007Q2 |
4,034 |
-3.0 |
$35,084,240 |
3.0 |
$669 |
6.2 |
| 2007Q3 |
4,026 |
-3.4 |
$35,976,903 |
5.1 |
$687 |
8.8 |
| 2007Q4 |
4,031 |
-2.2 |
$37,969,906 |
6.4 |
$725 |
8.8 |
| 2008Q1 |
3,982 |
-0.2 |
$38,110,273 |
3.7 |
$736 |
3.8 |
| 2008Q2 |
4,004 |
-0.7 |
$35,405,808 |
0.9 |
$680 |
1.7 |
| 2008Q3 |
4,057 |
0.8 |
$37,372,201 |
3.9 |
$709 |
3.1 |
| 2008Q4 |
3,971 |
-1.5 |
$37,613,394 |
-0.9 |
$729 |
0.5 |
| 2009Q1 |
3,982 |
0.0 |
$37,329,241 |
-2.0 |
$721 |
-2.1 |
| 2009Q2 |
3,993 |
-0.3 |
$36,313,641 |
2.6 |
$700 |
2.9 |
| 2009Q3 |
3,952 |
-2.6 |
$36,910,537 |
-1.2 |
$718 |
1.4 |
| 2009Q4 |
3,882 |
-2.2 |
$38,440,956 |
2.2 |
$762 |
4.5 |
| 2010Q1 |
3,886 |
-2.4 |
$35,198,820 |
-5.7 |
$697 |
-3.4 |
| 2010Q2 |
3,895 |
-2.5 |
$35,994,558 |
-0.9 |
$711 |
1.6 |
| 2010Q3 |
3,906 |
-1.2 |
$38,004,177 |
3.0 |
$748 |
4.2 |
| 2010Q4 |
3,836 |
-1.2 |
$41,381,069 |
7.6 |
$830 |
9.0 |
| 2011Q1 |
3,822 |
-1.7 |
$37,249,186 |
5.8 |
$750 |
7.6 |
| 2011Q2 |
3,849 |
-1.2 |
$37,747,536 |
4.9 |
$754 |
6.1 |
| 2011Q3 |
3,865 |
-1.1 |
$40,460,996 |
6.5 |
$805 |
7.6 |
| 2011Q4 |
3,851 |
0.4 |
$40,255,423 |
-2.7 |
$804 |
-3.1 |
| 2012Q1 |
3,898 |
2.0 |
$40,235,758 |
8.0 |
$794 |
5.9 |
| 2012Q2 |
3,922 |
1.9 |
$40,267,570 |
6.7 |
$790 |
4.7 |
| 2012Q3 |
3,939 |
1.9 |
$39,719,709 |
-1.8 |
$776 |
-3.7 |
| 2012Q4 |
3,845 |
-0.2 |
$42,073,678 |
4.5 |
$842 |
4.7 |
| 2013Q1 |
3,785 |
-2.9 |
$39,564,150 |
-1.7 |
$804 |
1.2 |
| 2013Q2 |
3,777 |
-3.7 |
$39,709,683 |
-1.4 |
$809 |
2.4 |
| 2013Q3 |
3,825 |
-2.9 |
$39,662,525 |
-0.1 |
$798 |
2.8 |
| 2013Q4 |
3,806 |
-1.0 |
$42,920,418 |
2.0 |
$867 |
3.0 |
| 2014Q1 |
3,751 |
-0.9 |
$40,102,102 |
1.4 |
$822 |
2.3 |
| 2014Q2 |
3,771 |
-0.2 |
$41,267,921 |
3.9 |
$842 |
4.1 |
| 2014Q3 |
3,809 |
-0.4 |
$40,823,770 |
2.9 |
$824 |
3.4 |
| 2014Q4 |
3,768 |
-1.0 |
$44,285,636 |
3.2 |
$904 |
4.2 |
| 2015Q1 |
3,759 |
0.2 |
$42,319,470 |
5.5 |
$866 |
5.3 |
| 2015Q2 |
3,804 |
0.9 |
$41,737,915 |
1.1 |
$844 |
0.3 |
| 2015Q3 |
3,794 |
-0.4 |
$41,710,752 |
2.2 |
$846 |
2.6 |
| 2015Q4 |
3,728 |
-1.0 |
$45,712,991 |
3.2 |
$943 |
4.3 |
| 2016Q1 |
3,758 |
0.0 |
$42,090,258 |
-0.5 |
$862 |
-0.5 |
| 2016Q2 |
3,757 |
-1.2 |
$41,364,550 |
-0.9 |
$847 |
0.3 |
| 2016Q3 |
3,742 |
-1.4 |
$44,214,574 |
6.0 |
$909 |
7.5 |
| 2016Q4 |
3,714 |
-0.4 |
$42,607,088 |
-6.8 |
$882 |
-6.4 |
| 2017Q1 |
3,677 |
-2.2 |
$45,196,761 |
7.4 |
$946 |
9.8 |
| 2017Q2 |
3,704 |
-1.4 |
$40,751,323 |
-1.5 |
$846 |
-0.1 |
| 2017Q3 |
3,710 |
-0.9 |
$41,871,365 |
-5.3 |
$868 |
-4.5 |
| 2017Q4 |
3,626 |
-2.4 |
$42,839,700 |
0.5 |
$909 |
3.0 |
| 2018Q1 |
3,623 |
-1.5 |
$42,809,620 |
-5.3 |
$909 |
-3.9 |
| 2018Q2 |
3,585 |
-3.2 |
$41,332,945 |
1.4 |
$887 |
4.8 |
| 2018Q3 |
3,552 |
-4.3 |
$41,699,146 |
-0.4 |
$903 |
4.0 |
| 2018Q4 |
3,458 |
-4.6 |
$42,641,172 |
-0.5 |
$948 |
4.4 |
| 2019Q1 |
3,430 |
-5.3 |
$41,861,798 |
-2.2 |
$939 |
3.3 |
| 2019Q2 |
3,446 |
-3.9 |
$41,519,184 |
0.5 |
$927 |
4.5 |
| 2019Q3 |
3,434 |
-3.3 |
$42,291,107 |
1.4 |
$947 |
4.9 |
| 2019Q4 |
3,385 |
-2.1 |
$42,203,712 |
-1.0 |
$959 |
1.1 |
| 2020Q1 |
3,239 |
-5.6 |
$40,786,177 |
-2.6 |
$969 |
3.2 |
| 2020Q2 |
2,886 |
-16.2 |
$38,238,324 |
-7.9 |
$1,019 |
9.9 |
| 2020Q3 |
2,948 |
-14.2 |
$40,886,447 |
-3.3 |
$1,067 |
12.6 |
| 2020Q4 |
2,926 |
-13.5 |
$42,978,819 |
1.8 |
$1,130 |
17.8 |
| 2021Q1 |
2,908 |
-10.2 |
$40,964,335 |
0.4 |
$1,084 |
11.9 |
| 2021Q2 |
2,941 |
1.9 |
$49,747,704 |
30.1 |
$1,301 |
27.7 |
| 2021Q3 |
3,001 |
1.8 |
$44,846,686 |
9.7 |
$1,150 |
7.8 |
| 2021Q4 |
3,010 |
2.8 |
$48,011,647 |
11.7 |
$1,227 |
8.6 |
| 2022Q1 |
3,041 |
4.6 |
$50,003,538 |
22.1 |
$1,265 |
16.7 |
| 2022Q2 |
3,098 |
5.3 |
$51,250,424 |
3.0 |
$1,273 |
-2.2 |
| 2022Q3 |
3,173 |
5.7 |
$58,594,930 |
30.7 |
$1,420 |
23.6 |
| 2022Q4 |
3,137 |
4.2 |
$57,027,082 |
18.8 |
$1,399 |
14.0 |
| 2023Q1 |
3,174 |
4.4 |
$56,454,176 |
12.9 |
$1,368 |
8.2 |
| 2023Q2 |
3,206 |
3.5 |
$57,586,929 |
12.4 |
$1,382 |
8.6 |
| 2023Q3 |
3,214 |
1.3 |
$55,797,792 |
-4.8 |
$1,336 |
-6.0 |
| 2023Q4 |
3,132 |
-0.1 |
$60,705,888 |
6.5 |
$1,491 |
6.6 |
| 2024Q1 |
3,045 |
-4.1 |
$60,491,502 |
7.2 |
$1,528 |
11.7 |
| 2024Q2 |
3,031 |
-5.5 |
$60,275,433 |
4.7 |
$1,530 |
10.7 |
| 2024Q3 |
3,020 |
-6.0 |
$58,271,608 |
4.4 |
$1,484 |
11.1 |
| 2024Q4 |
3,045 |
-2.8 |
$62,954,840 |
3.7 |
$1,590 |
6.7 |
| 2025Q1 |
3,039 |
-0.2 |
$67,507,121 |
11.6 |
$1,709 |
11.8 |
| 2025Q2 |
3,058 |
0.9 |
$61,835,034 |
2.6 |
$1,556 |
1.7 |
| 2025Q3b |
3,085 |
2.2 |
$62,787,327 |
7.7 |
$1,566 |
5.5 |
|
|
|
|
|
|
|
|
|
|
|
|
|
|
| aNorth American Industry Classification System. |
|
|
|
|
| bPreliminary. |
|
|
|
|
|
|
| Source: Quarterly Census of Employment and Wages. |
|
|
|
|
| Prepared by M. Moore, Research & Planning, WY DWS, 4/3/26. |
|
|
|
|
Figure: Average Monthly Employment in Information (NAICS 51) in Wyoming, 2001Q1-2025Q3
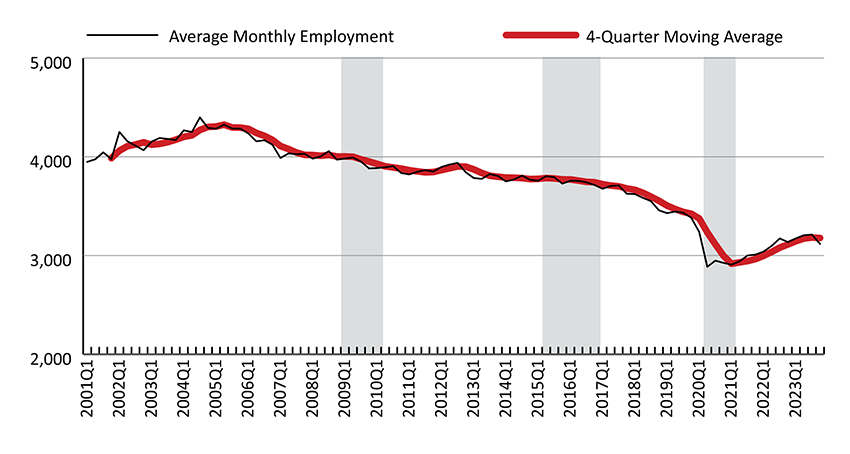
Figure: Over-the-Year Percent Change in Average Monthly Employment and Total Wages in Information (NAICS 51) in Wyoming, 2002Q1-2025Q3
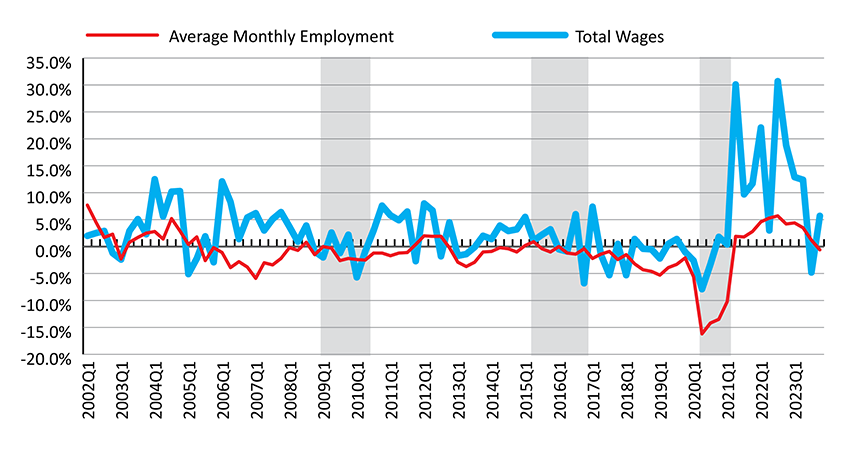
Shaded areas indicate periods of economic downturn: 2009Q1-2010Q1, 2015Q2-2016Q4, and 2020Q2-2021Q1.
Source: Quarterly Census of Employment and Wages.
Prepared by M. Moore, Research & Planning, WY DWS, 4/3/26.
 Hire Wyo