Wyoming QCEW Summary Statistics by Industry, 2001-2025
Financial Activities (NAICSa 52-53), 2025Q3
Average Monthly Employment: 11,426
Total Wages: $232,154,871
Average Weekly Wage: $1,563
aNorth American Industry Classification System.
Published April 2026.
| Table: Over-the-Year Change in Financial Activities Supersector (NAICSa Sectors 52-53) Average Monthly Employment (AME), Total Wages, and Average Weekly Wage (AWW) Changes by Year/Quarter in Wyoming |
| Published April 2026. |
|
|
|
|
|
|
|
|
|
|
|
|
|
Average Monthly Employment |
Total Wages |
Average Weekly Wage |
| Year/Quarter |
N |
% Change |
$ |
% Change |
$ |
% Change |
| 2001Q1 |
9,050 |
|
$70,741,613 |
|
$601 |
|
| 2001Q2 |
9,468 |
|
$69,994,000 |
|
$569 |
|
| 2001Q3 |
9,769 |
|
$72,296,258 |
|
$569 |
|
| 2001Q4 |
9,592 |
|
$89,059,402 |
|
$714 |
|
| 2002Q1 |
9,689 |
7.1 |
$77,470,171 |
9.5 |
$615 |
2.3 |
| 2002Q2 |
10,066 |
6.3 |
$75,410,904 |
7.7 |
$576 |
1.3 |
| 2002Q3 |
10,331 |
5.8 |
$77,501,502 |
7.2 |
$577 |
1.4 |
| 2002Q4 |
9,957 |
3.8 |
$84,599,799 |
-5.0 |
$654 |
-8.5 |
| 2003Q1 |
9,785 |
1.0 |
$87,246,734 |
12.6 |
$686 |
11.5 |
| 2003Q2 |
10,099 |
0.3 |
$77,885,718 |
3.3 |
$593 |
2.9 |
| 2003Q3 |
10,295 |
-0.3 |
$81,224,756 |
4.8 |
$607 |
5.2 |
| 2003Q4 |
10,234 |
2.8 |
$88,989,427 |
5.2 |
$669 |
2.3 |
| 2004Q1 |
10,267 |
4.9 |
$88,558,585 |
1.5 |
$663 |
-3.3 |
| 2004Q2 |
10,490 |
3.9 |
$83,771,018 |
7.6 |
$614 |
3.6 |
| 2004Q3 |
10,609 |
3.1 |
$84,916,942 |
4.5 |
$616 |
1.4 |
| 2004Q4 |
10,495 |
2.6 |
$98,777,781 |
11.0 |
$724 |
8.2 |
| 2005Q1 |
10,481 |
2.1 |
$94,403,551 |
6.6 |
$693 |
4.4 |
| 2005Q2 |
10,804 |
3.0 |
$93,813,290 |
12.0 |
$668 |
8.7 |
| 2005Q3 |
10,946 |
3.2 |
$95,423,804 |
12.4 |
$671 |
8.9 |
| 2005Q4 |
10,853 |
3.4 |
$107,829,230 |
9.2 |
$764 |
5.6 |
| 2006Q1 |
10,921 |
4.2 |
$105,365,012 |
11.6 |
$742 |
7.1 |
| 2006Q2 |
11,138 |
3.1 |
$101,419,805 |
8.1 |
$700 |
4.9 |
| 2006Q3 |
11,214 |
2.5 |
$101,999,057 |
6.9 |
$700 |
4.3 |
| 2006Q4 |
11,196 |
3.2 |
$125,230,509 |
16.1 |
$860 |
12.6 |
| 2007Q1 |
11,029 |
1.0 |
$118,958,968 |
12.9 |
$830 |
11.8 |
| 2007Q2 |
11,388 |
2.2 |
$115,608,127 |
14.0 |
$781 |
11.5 |
| 2007Q3 |
11,640 |
3.8 |
$114,570,875 |
12.3 |
$757 |
8.2 |
| 2007Q4 |
11,554 |
3.2 |
$136,462,469 |
9.0 |
$908 |
5.6 |
| 2008Q1 |
11,396 |
3.3 |
$126,526,211 |
6.4 |
$854 |
2.9 |
| 2008Q2 |
11,624 |
2.1 |
$121,034,529 |
4.7 |
$801 |
2.6 |
| 2008Q3 |
11,851 |
1.8 |
$137,539,982 |
20.0 |
$893 |
17.9 |
| 2008Q4 |
11,636 |
0.7 |
$135,007,938 |
-1.1 |
$893 |
-1.8 |
| 2009Q1 |
11,306 |
-0.8 |
$122,739,368 |
-3.0 |
$835 |
-2.2 |
| 2009Q2 |
11,302 |
-2.8 |
$114,235,294 |
-5.6 |
$778 |
-2.9 |
| 2009Q3 |
11,265 |
-4.9 |
$112,086,968 |
-18.5 |
$765 |
-14.3 |
| 2009Q4 |
10,930 |
-6.1 |
$124,978,738 |
-7.4 |
$880 |
-1.5 |
| 2010Q1 |
10,714 |
-5.2 |
$115,850,336 |
-5.6 |
$832 |
-0.4 |
| 2010Q2 |
10,869 |
-3.8 |
$113,297,390 |
-0.8 |
$802 |
3.1 |
| 2010Q3 |
10,828 |
-3.9 |
$113,547,789 |
1.3 |
$807 |
5.4 |
| 2010Q4 |
10,760 |
-1.6 |
$133,167,402 |
6.6 |
$952 |
8.2 |
| 2011Q1 |
10,601 |
-1.1 |
$122,512,488 |
5.8 |
$889 |
6.9 |
| 2011Q2 |
10,749 |
-1.1 |
$122,213,135 |
7.9 |
$875 |
9.1 |
| 2011Q3 |
10,774 |
-0.5 |
$121,459,084 |
7.0 |
$867 |
7.5 |
| 2011Q4 |
10,654 |
-1.0 |
$131,255,327 |
-1.4 |
$948 |
-0.5 |
| 2012Q1 |
10,592 |
-0.1 |
$127,729,616 |
4.3 |
$928 |
4.3 |
| 2012Q2 |
10,702 |
-0.4 |
$128,287,635 |
5.0 |
$922 |
5.4 |
| 2012Q3 |
10,898 |
1.1 |
$126,680,808 |
4.3 |
$894 |
3.1 |
| 2012Q4 |
10,816 |
1.5 |
$145,289,083 |
10.7 |
$1,033 |
9.0 |
| 2013Q1 |
10,873 |
2.7 |
$140,032,489 |
9.6 |
$991 |
6.8 |
| 2013Q2 |
11,108 |
3.8 |
$134,242,030 |
4.6 |
$930 |
0.8 |
| 2013Q3 |
11,354 |
4.2 |
$134,461,379 |
6.1 |
$911 |
1.9 |
| 2013Q4 |
11,204 |
3.6 |
$148,991,087 |
2.5 |
$1,023 |
-1.0 |
| 2014Q1 |
11,029 |
1.4 |
$149,653,787 |
6.9 |
$1,044 |
5.4 |
| 2014Q2 |
11,183 |
0.7 |
$140,938,572 |
5.0 |
$969 |
4.3 |
| 2014Q3 |
11,373 |
0.2 |
$140,512,693 |
4.5 |
$950 |
4.3 |
| 2014Q4 |
11,343 |
1.2 |
$160,766,274 |
7.9 |
$1,090 |
6.6 |
| 2015Q1 |
11,199 |
1.5 |
$153,305,668 |
2.4 |
$1,053 |
0.9 |
| 2015Q2 |
11,095 |
-0.8 |
$142,044,225 |
0.8 |
$985 |
1.6 |
| 2015Q3 |
11,178 |
-1.7 |
$139,612,637 |
-0.6 |
$961 |
1.1 |
| 2015Q4 |
11,027 |
-2.8 |
$160,139,538 |
-0.4 |
$1,117 |
2.5 |
| 2016Q1 |
10,850 |
-3.1 |
$142,918,177 |
-6.8 |
$1,013 |
-3.8 |
| 2016Q2 |
10,820 |
-2.5 |
$132,195,655 |
-6.9 |
$940 |
-4.6 |
| 2016Q3 |
10,913 |
-2.4 |
$141,203,508 |
1.1 |
$995 |
3.6 |
| 2016Q4 |
10,754 |
-2.5 |
$151,519,356 |
-5.4 |
$1,084 |
-3.0 |
| 2017Q1 |
10,739 |
-1.0 |
$148,187,520 |
3.7 |
$1,061 |
4.8 |
| 2017Q2 |
10,868 |
0.4 |
$142,491,689 |
7.8 |
$1,009 |
7.3 |
| 2017Q3 |
11,056 |
1.3 |
$139,282,894 |
-1.4 |
$969 |
-2.6 |
| 2017Q4 |
11,088 |
3.1 |
$168,107,439 |
10.9 |
$1,166 |
7.6 |
| 2018Q1 |
10,907 |
1.6 |
$161,414,056 |
8.9 |
$1,138 |
7.2 |
| 2018Q2 |
11,112 |
2.2 |
$151,916,697 |
6.6 |
$1,052 |
4.3 |
| 2018Q3 |
11,289 |
2.1 |
$150,921,080 |
8.4 |
$1,028 |
6.1 |
| 2018Q4 |
11,186 |
0.9 |
$175,193,756 |
4.2 |
$1,205 |
3.3 |
| 2019Q1 |
11,065 |
1.5 |
$167,530,110 |
3.8 |
$1,165 |
2.3 |
| 2019Q2 |
11,118 |
0.1 |
$156,000,470 |
2.7 |
$1,079 |
2.6 |
| 2019Q3 |
11,297 |
0.1 |
$172,210,028 |
14.1 |
$1,173 |
14.1 |
| 2019Q4 |
11,239 |
0.5 |
$184,523,057 |
5.3 |
$1,263 |
4.8 |
| 2020Q1 |
11,150 |
0.8 |
$173,768,449 |
3.7 |
$1,199 |
2.9 |
| 2020Q2 |
10,754 |
-3.3 |
$160,353,868 |
2.8 |
$1,147 |
6.3 |
| 2020Q3 |
10,849 |
-4.0 |
$159,284,493 |
-7.5 |
$1,129 |
-3.7 |
| 2020Q4 |
10,918 |
-2.9 |
$210,557,256 |
14.1 |
$1,483 |
17.4 |
| 2021Q1 |
10,877 |
-2.4 |
$201,692,097 |
16.1 |
$1,426 |
18.9 |
| 2021Q2 |
11,095 |
3.2 |
$190,280,881 |
18.7 |
$1,319 |
15.0 |
| 2021Q3 |
11,294 |
4.1 |
$191,396,367 |
20.2 |
$1,304 |
15.5 |
| 2021Q4 |
11,424 |
4.6 |
$252,948,820 |
20.1 |
$1,703 |
14.8 |
| 2022Q1 |
11,327 |
4.1 |
$244,503,732 |
21.2 |
$1,661 |
16.5 |
| 2022Q2 |
11,462 |
3.3 |
$201,685,184 |
6.0 |
$1,354 |
2.7 |
| 2022Q3 |
11,663 |
3.3 |
$211,895,160 |
10.7 |
$1,397 |
7.1 |
| 2022Q4 |
11,576 |
1.3 |
$249,180,738 |
-1.5 |
$1,656 |
-2.8 |
| 2023Q1 |
11,540 |
1.9 |
$258,841,863 |
5.9 |
$1,725 |
3.9 |
| 2023Q2 |
11,550 |
0.8 |
$212,071,651 |
5.1 |
$1,412 |
4.3 |
| 2023Q3 |
11,608 |
-0.5 |
$210,923,180 |
-0.5 |
$1,398 |
0.1 |
| 2023Q4 |
11,465 |
-1.0 |
$258,791,344 |
3.9 |
$1,736 |
4.8 |
| 2024Q1 |
11,176 |
-3.2 |
$243,594,663 |
-5.9 |
$1,677 |
-2.8 |
| 2024Q2 |
11,271 |
-2.4 |
$211,256,130 |
-0.4 |
$1,442 |
2.1 |
| 2024Q3 |
11,368 |
-2.1 |
$223,412,674 |
5.9 |
$1,512 |
8.2 |
| 2024Q4 |
11,305 |
-1.4 |
$278,585,086 |
7.6 |
$1,896 |
9.2 |
| 2025Q1 |
11,180 |
0.0 |
$296,388,476 |
21.7 |
$2,039 |
21.6 |
| 2025Q2 |
11,278 |
0.1 |
$240,443,872 |
13.8 |
$1,640 |
13.7 |
| 2025Q3b |
11,426 |
0.5 |
$232,154,871 |
3.9 |
$1,563 |
3.4 |
|
|
|
|
|
|
|
|
|
|
|
|
|
|
| aNorth American Industry Classification System. |
|
|
|
|
| bPreliminary. |
|
|
|
|
|
|
| Source: Quarterly Census of Employment and Wages. |
|
|
|
|
| Prepared by M. Moore, Research & Planning, WY DWS, 4/3/26. |
|
|
|
|
Figure: Average Monthly Employment in Financial Activities (NAICS 52-53) in Wyoming, 2001Q1-2025Q3
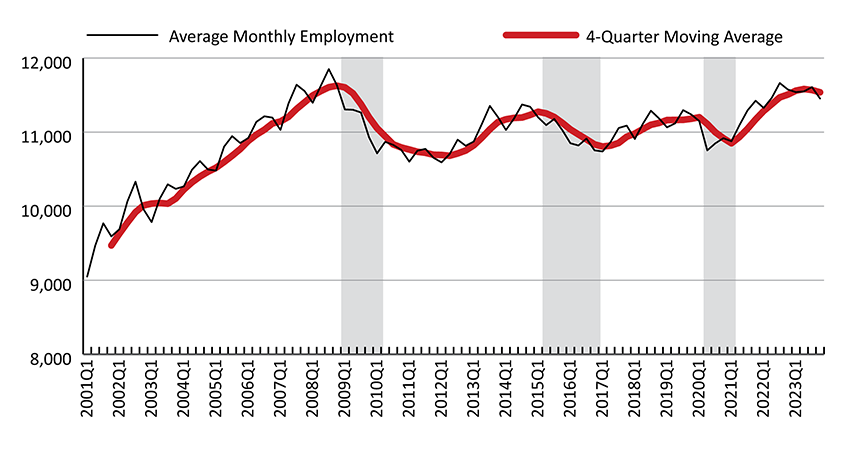
Figure: Over-the-Year Percent Change in Average Monthly Employment and Total Wages in Financial Activities (NAICS 52-53) in Wyoming, 2002Q1-2025Q3
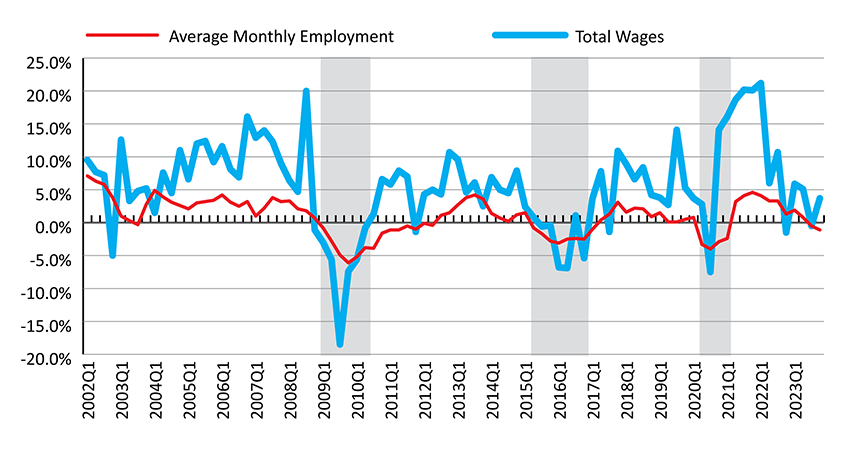
Shaded areas indicate periods of economic downturn: 2009Q1-2010Q1, 2015Q2-2016Q4, and 2020Q2-2021Q1.
Source: Quarterly Census of Employment and Wages.
Prepared by M. Moore, Research & Planning, WY DWS, 4/3/26.
 Hire Wyo