Wyoming QCEW Summary Statistics by Industry, 2001-2025
Educational & Health Services (NAICSa 61-62), 2025Q3
Average Monthly Employment: 28,570
Total Wages: $395,343,988
Average Weekly Wage: $1,064
aNorth American Industry Classification System.
Published April 2026.
| Table: Over-the-Year Change in Private Education & Health Services Supersector (NAICSa Sectors 61 & 62) Average Monthly Employment (AME), Total Wages, and Average Weekly Wage (AWW) Changes by Year/Quarter in Wyoming |
| Published April 2026. |
|
|
|
|
|
|
|
|
|
|
|
|
|
Average Monthly Employment |
Total Wages |
Average Weekly Wage |
| Year/Quarter |
N |
% Change |
$ |
% Change |
$ |
% Change |
| 2001Q1 |
18,145 |
|
$110,935,908 |
|
$470 |
|
| 2001Q2 |
18,378 |
|
$121,223,748 |
|
$507 |
|
| 2001Q3 |
18,624 |
|
$123,377,469 |
|
$510 |
|
| 2001Q4 |
18,882 |
|
$139,853,772 |
|
$570 |
|
| 2002Q1 |
18,746 |
3.3 |
$121,037,232 |
9.1 |
$497 |
5.6 |
| 2002Q2 |
19,033 |
3.6 |
$128,242,995 |
5.8 |
$518 |
2.1 |
| 2002Q3 |
19,099 |
2.5 |
$138,035,419 |
11.9 |
$556 |
9.1 |
| 2002Q4 |
19,144 |
1.4 |
$152,074,655 |
8.7 |
$611 |
7.2 |
| 2003Q1 |
19,588 |
4.5 |
$130,023,845 |
7.4 |
$511 |
2.8 |
| 2003Q2 |
19,827 |
4.2 |
$142,023,358 |
10.7 |
$551 |
6.3 |
| 2003Q3 |
19,940 |
4.4 |
$145,600,473 |
5.5 |
$562 |
1.0 |
| 2003Q4 |
20,069 |
4.8 |
$163,313,610 |
7.4 |
$626 |
2.4 |
| 2004Q1 |
20,361 |
3.9 |
$140,381,931 |
8.0 |
$530 |
3.9 |
| 2004Q2 |
20,497 |
3.4 |
$152,630,838 |
7.5 |
$573 |
4.0 |
| 2004Q3 |
20,798 |
4.3 |
$160,467,321 |
10.2 |
$594 |
5.7 |
| 2004Q4 |
20,953 |
4.4 |
$173,460,211 |
6.2 |
$637 |
1.7 |
| 2005Q1 |
20,911 |
2.7 |
$149,906,747 |
6.8 |
$551 |
4.0 |
| 2005Q2 |
21,104 |
3.0 |
$160,752,272 |
5.3 |
$586 |
2.3 |
| 2005Q3 |
21,176 |
1.8 |
$171,625,344 |
7.0 |
$623 |
5.0 |
| 2005Q4 |
21,381 |
2.0 |
$186,086,561 |
7.3 |
$669 |
5.1 |
| 2006Q1 |
21,244 |
1.6 |
$163,039,823 |
8.8 |
$590 |
7.1 |
| 2006Q2 |
21,522 |
2.0 |
$172,008,629 |
7.0 |
$615 |
4.9 |
| 2006Q3 |
21,636 |
2.2 |
$181,664,445 |
5.8 |
$646 |
3.6 |
| 2006Q4 |
21,843 |
2.2 |
$197,801,781 |
6.3 |
$697 |
4.0 |
| 2007Q1 |
21,916 |
3.2 |
$176,681,576 |
8.4 |
$620 |
5.0 |
| 2007Q2 |
22,190 |
3.1 |
$188,622,605 |
9.7 |
$654 |
6.4 |
| 2007Q3 |
22,437 |
3.7 |
$198,969,353 |
9.5 |
$682 |
5.6 |
| 2007Q4 |
22,691 |
3.9 |
$216,369,353 |
9.4 |
$734 |
5.3 |
| 2008Q1 |
22,994 |
4.9 |
$194,256,613 |
9.9 |
$650 |
4.8 |
| 2008Q2 |
23,376 |
5.3 |
$210,860,214 |
11.8 |
$694 |
6.1 |
| 2008Q3 |
23,686 |
5.6 |
$219,208,722 |
10.2 |
$712 |
4.4 |
| 2008Q4 |
23,972 |
5.6 |
$243,586,120 |
12.6 |
$782 |
6.6 |
| 2009Q1 |
24,166 |
5.1 |
$203,810,989 |
4.9 |
$649 |
-0.2 |
| 2009Q2 |
24,450 |
4.6 |
$219,849,404 |
4.3 |
$692 |
-0.3 |
| 2009Q3 |
24,573 |
3.7 |
$226,772,295 |
3.5 |
$710 |
-0.3 |
| 2009Q4 |
24,849 |
3.7 |
$258,319,967 |
6.0 |
$800 |
2.3 |
| 2010Q1 |
24,557 |
1.6 |
$207,623,815 |
1.9 |
$650 |
0.2 |
| 2010Q2 |
24,867 |
1.7 |
$229,774,108 |
4.5 |
$711 |
2.8 |
| 2010Q3 |
24,990 |
1.7 |
$240,879,125 |
6.2 |
$741 |
4.4 |
| 2010Q4 |
25,345 |
2.0 |
$266,657,687 |
3.2 |
$809 |
1.2 |
| 2011Q1 |
25,262 |
2.9 |
$221,918,152 |
6.9 |
$676 |
3.9 |
| 2011Q2 |
25,374 |
2.0 |
$245,998,192 |
7.1 |
$746 |
4.9 |
| 2011Q3 |
25,238 |
1.0 |
$247,807,289 |
2.9 |
$755 |
1.9 |
| 2011Q4 |
25,368 |
0.1 |
$266,215,807 |
-0.2 |
$807 |
-0.3 |
| 2012Q1 |
25,108 |
-0.6 |
$232,122,439 |
4.6 |
$711 |
5.2 |
| 2012Q2 |
25,297 |
-0.3 |
$247,640,824 |
0.7 |
$753 |
1.0 |
| 2012Q3 |
25,355 |
0.5 |
$245,319,131 |
-1.0 |
$744 |
-1.5 |
| 2012Q4 |
25,573 |
0.8 |
$292,857,389 |
10.0 |
$881 |
9.1 |
| 2013Q1 |
25,606 |
2.0 |
$235,612,239 |
1.5 |
$708 |
-0.5 |
| 2013Q2 |
25,712 |
1.6 |
$249,636,846 |
0.8 |
$747 |
-0.8 |
| 2013Q3 |
25,650 |
1.2 |
$249,965,093 |
1.9 |
$750 |
0.7 |
| 2013Q4 |
25,764 |
0.7 |
$281,336,000 |
-3.9 |
$840 |
-4.6 |
| 2014Q1 |
25,673 |
0.3 |
$242,602,122 |
3.0 |
$727 |
2.7 |
| 2014Q2 |
25,769 |
0.2 |
$257,414,577 |
3.1 |
$768 |
2.9 |
| 2014Q3 |
25,667 |
0.1 |
$257,289,070 |
2.9 |
$771 |
2.9 |
| 2014Q4 |
25,862 |
0.4 |
$288,321,215 |
2.5 |
$858 |
2.1 |
| 2015Q1 |
25,695 |
0.1 |
$249,280,190 |
2.8 |
$746 |
2.7 |
| 2015Q2 |
25,965 |
0.8 |
$268,827,497 |
4.4 |
$796 |
3.6 |
| 2015Q3 |
25,916 |
1.0 |
$265,738,545 |
3.3 |
$789 |
2.3 |
| 2015Q4 |
26,284 |
1.6 |
$297,662,378 |
3.2 |
$871 |
1.6 |
| 2016Q1 |
26,393 |
2.7 |
$255,948,537 |
2.7 |
$746 |
0.0 |
| 2016Q2 |
26,604 |
2.5 |
$269,059,926 |
0.1 |
$778 |
-2.3 |
| 2016Q3 |
26,424 |
2.0 |
$280,044,825 |
5.4 |
$815 |
3.4 |
| 2016Q4 |
26,486 |
0.8 |
$288,404,728 |
-3.1 |
$838 |
-3.8 |
| 2017Q1 |
26,450 |
0.2 |
$266,007,166 |
3.9 |
$774 |
3.7 |
| 2017Q2 |
26,490 |
-0.4 |
$271,025,523 |
0.7 |
$787 |
1.2 |
| 2017Q3 |
26,379 |
-0.2 |
$277,919,832 |
-0.8 |
$810 |
-0.6 |
| 2017Q4 |
26,562 |
0.3 |
$294,595,278 |
2.1 |
$853 |
1.9 |
| 2018Q1 |
27,011 |
2.1 |
$279,886,155 |
5.2 |
$797 |
3.0 |
| 2018Q2 |
27,014 |
2.0 |
$283,087,187 |
4.5 |
$806 |
2.4 |
| 2018Q3 |
26,835 |
1.7 |
$286,926,237 |
3.2 |
$822 |
1.4 |
| 2018Q4 |
27,028 |
1.8 |
$307,356,866 |
4.3 |
$875 |
2.6 |
| 2019Q1 |
27,185 |
0.6 |
$283,853,565 |
1.4 |
$803 |
0.8 |
| 2019Q2 |
27,215 |
0.7 |
$292,376,954 |
3.3 |
$826 |
2.5 |
| 2019Q3 |
27,263 |
1.6 |
$303,624,156 |
5.8 |
$857 |
4.2 |
| 2019Q4 |
27,635 |
2.2 |
$324,693,605 |
5.6 |
$904 |
3.3 |
| 2020Q1 |
27,594 |
1.5 |
$298,355,463 |
5.1 |
$832 |
3.6 |
| 2020Q2 |
26,125 |
-4.0 |
$286,787,855 |
-1.9 |
$844 |
2.1 |
| 2020Q3 |
26,835 |
-1.6 |
$308,922,005 |
1.7 |
$886 |
3.4 |
| 2020Q4 |
27,165 |
-1.7 |
$353,596,589 |
8.9 |
$1,001 |
10.8 |
| 2021Q1 |
27,341 |
-0.9 |
$293,948,885 |
-1.5 |
$827 |
-0.6 |
| 2021Q2 |
27,321 |
4.6 |
$315,655,631 |
10.1 |
$889 |
5.3 |
| 2021Q3 |
27,061 |
0.8 |
$321,712,403 |
4.1 |
$915 |
3.3 |
| 2021Q4 |
27,199 |
0.1 |
$363,899,005 |
2.9 |
$1,029 |
2.8 |
| 2022Q1 |
27,428 |
0.3 |
$315,157,843 |
7.2 |
$884 |
6.9 |
| 2022Q2 |
27,486 |
0.6 |
$335,914,497 |
6.4 |
$940 |
5.7 |
| 2022Q3 |
27,563 |
1.9 |
$352,756,277 |
9.6 |
$984 |
7.5 |
| 2022Q4 |
27,835 |
2.3 |
$369,174,405 |
1.4 |
$1,020 |
-0.9 |
| 2023Q1 |
27,979 |
2.0 |
$342,249,918 |
8.6 |
$941 |
6.4 |
| 2023Q2 |
28,197 |
2.6 |
$354,666,192 |
5.6 |
$968 |
3.0 |
| 2023Q3 |
28,026 |
1.7 |
$357,379,458 |
1.3 |
$981 |
-0.3 |
| 2023Q4 |
28,364 |
1.9 |
$386,088,969 |
4.6 |
$1,047 |
2.6 |
| 2024Q1 |
28,571 |
2.1 |
$360,388,742 |
5.3 |
$970 |
3.1 |
| 2024Q2 |
28,665 |
1.7 |
$371,968,265 |
4.9 |
$998 |
3.1 |
| 2024Q3 |
28,397 |
1.3 |
$376,824,400 |
5.4 |
$1,021 |
4.1 |
| 2024Q4 |
28,818 |
1.6 |
$405,370,489 |
5.0 |
$1,082 |
3.3 |
| 2025Q1 |
28,553 |
-0.1 |
$375,462,811 |
4.2 |
$1,012 |
4.3 |
| 2025Q2 |
28,740 |
0.3 |
$383,931,877 |
3.2 |
$1,028 |
3.0 |
| 2025Q3b |
28,570 |
0.6 |
$395,343,988 |
4.9 |
$1,064 |
4.2 |
|
|
|
|
|
|
|
|
|
|
|
|
|
|
| aNorth American Industry Classification System. |
|
|
|
|
| bPreliminary. |
|
|
|
|
|
|
| Source: Quarterly Census of Employment and Wages. |
|
|
|
|
| Prepared by M. Moore, Research & Planning, WY DWS, 4/3/26. |
|
|
|
|
Figure: Average Monthly Employment in Education & Health Services (NAICS 61-62) in Wyoming, 2001Q1-2025Q3
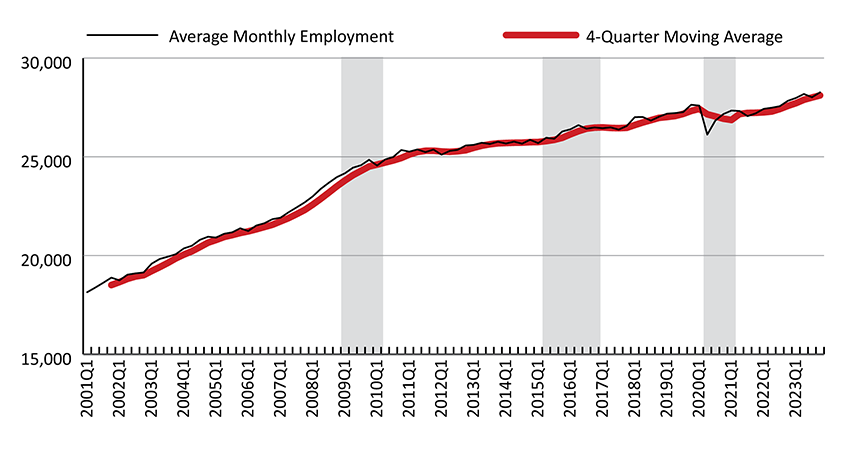
Figure: Over-the-Year Percent Change in Average Monthly Employment and Total Wages in Education & Health Services (NAICS 61-62) in Wyoming, 2002Q1-2025Q3
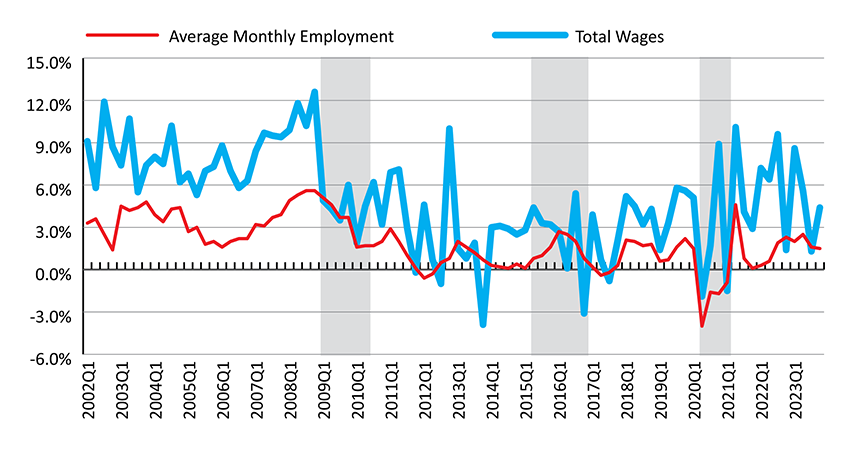
Shaded areas indicate periods of economic downturn: 2009Q1-2010Q1, 2015Q2-2016Q4, and 2020Q2-2021Q1.
Source: Quarterly Census of Employment and Wages.
Prepared by M. Moore, Research & Planning, WY DWS, 4/3/26.
 Hire Wyo