Wyoming QCEW Summary Statistics by Industry, 2001-2025
Construction (NAICSa 23), 2025Q3
Average Monthly Employment: 24,370
Total Wages: $447,869,825
Average Weekly Wage: $1,414
North American Industry Classification System.
Published April 2026.
| Table: Over-the-Year Change in Private Construction Sector (NAICSa Sector 23) Average Monthly Employment (AME), Total Wages, and Average Weekly Wage (AWW) Changes by Year/Quarter in Wyoming |
| Published April 2026. |
|
|
|
|
|
|
|
|
|
|
|
|
|
Average Monthly Employment |
Total Wages |
Average Weekly Wage |
| Year/Quarter |
N |
% Change |
$ |
% Change |
$ |
% Change |
| 2001Q1 |
16,203 |
|
$120,137,221 |
|
$570 |
|
| 2001Q2 |
19,776 |
|
$150,651,852 |
|
$586 |
|
| 2001Q3 |
21,613 |
|
$172,184,030 |
|
$613 |
|
| 2001Q4 |
20,519 |
|
$180,003,232 |
|
$675 |
|
| 2002Q1 |
17,318 |
6.9 |
$133,519,778 |
11.1 |
$593 |
4.0 |
| 2002Q2 |
20,547 |
3.9 |
$162,909,233 |
8.1 |
$610 |
4.1 |
| 2002Q3 |
21,896 |
1.3 |
$174,604,043 |
1.4 |
$613 |
0.1 |
| 2002Q4 |
19,836 |
-3.3 |
$174,185,889 |
-3.2 |
$675 |
0.1 |
| 2003Q1 |
16,464 |
-4.9 |
$127,097,174 |
-4.8 |
$594 |
0.1 |
| 2003Q2 |
19,619 |
-4.5 |
$153,596,575 |
-5.7 |
$602 |
-1.3 |
| 2003Q3 |
21,907 |
0.1 |
$179,068,119 |
2.6 |
$629 |
2.5 |
| 2003Q4 |
20,116 |
1.4 |
$184,372,371 |
5.8 |
$705 |
4.4 |
| 2004Q1 |
16,772 |
1.9 |
$132,731,545 |
4.4 |
$609 |
2.5 |
| 2004Q2 |
19,977 |
1.8 |
$160,120,276 |
4.2 |
$617 |
2.4 |
| 2004Q3 |
20,878 |
-4.7 |
$171,658,800 |
-4.1 |
$632 |
0.6 |
| 2004Q4 |
19,419 |
-3.5 |
$176,627,690 |
-4.2 |
$700 |
-0.8 |
| 2005Q1 |
17,456 |
4.1 |
$138,140,944 |
4.1 |
$609 |
0.0 |
| 2005Q2 |
20,809 |
4.2 |
$174,166,388 |
8.8 |
$644 |
4.4 |
| 2005Q3 |
22,772 |
9.1 |
$206,843,172 |
20.5 |
$699 |
10.5 |
| 2005Q4 |
22,007 |
13.3 |
$214,386,802 |
21.4 |
$749 |
7.1 |
| 2006Q1 |
20,333 |
16.5 |
$182,133,307 |
31.8 |
$689 |
13.2 |
| 2006Q2 |
24,288 |
16.7 |
$228,678,717 |
31.3 |
$724 |
12.5 |
| 2006Q3 |
25,771 |
13.2 |
$257,438,707 |
24.5 |
$768 |
10.0 |
| 2006Q4 |
25,380 |
15.3 |
$286,757,042 |
33.8 |
$869 |
16.0 |
| 2007Q1 |
22,817 |
12.2 |
$229,462,072 |
26.0 |
$774 |
12.3 |
| 2007Q2 |
26,508 |
9.1 |
$277,169,249 |
21.2 |
$804 |
11.1 |
| 2007Q3 |
28,685 |
11.3 |
$321,800,739 |
25.0 |
$863 |
12.3 |
| 2007Q4 |
28,193 |
11.1 |
$361,445,708 |
26.0 |
$986 |
13.5 |
| 2008Q1 |
25,870 |
13.4 |
$309,331,696 |
34.8 |
$920 |
18.9 |
| 2008Q2 |
28,228 |
6.5 |
$319,423,683 |
15.2 |
$870 |
8.2 |
| 2008Q3 |
30,517 |
6.4 |
$364,384,015 |
13.2 |
$918 |
6.4 |
| 2008Q4 |
27,876 |
-1.1 |
$367,525,144 |
1.7 |
$1,014 |
2.8 |
| 2009Q1 |
22,284 |
-13.9 |
$244,346,490 |
-21.0 |
$843 |
-8.3 |
| 2009Q2 |
24,355 |
-13.7 |
$266,461,750 |
-16.6 |
$842 |
-3.3 |
| 2009Q3 |
25,571 |
-16.2 |
$290,317,489 |
-20.3 |
$873 |
-4.9 |
| 2009Q4 |
23,231 |
-16.7 |
$285,990,736 |
-22.2 |
$947 |
-6.6 |
| 2010Q1 |
19,693 |
-11.6 |
$211,827,647 |
-13.3 |
$827 |
-1.9 |
| 2010Q2 |
22,556 |
-7.4 |
$256,095,442 |
-3.9 |
$873 |
3.8 |
| 2010Q3 |
24,617 |
-3.7 |
$293,302,820 |
1.0 |
$917 |
4.9 |
| 2010Q4 |
22,540 |
-3.0 |
$303,628,159 |
6.2 |
$1,036 |
9.4 |
| 2011Q1 |
18,037 |
-8.4 |
$197,090,538 |
-7.0 |
$841 |
1.6 |
| 2011Q2 |
20,715 |
-8.2 |
$232,532,199 |
-9.2 |
$863 |
-1.1 |
| 2011Q3 |
23,259 |
-5.5 |
$283,882,968 |
-3.2 |
$939 |
2.4 |
| 2011Q4 |
22,121 |
-1.9 |
$287,945,971 |
-5.2 |
$1,001 |
-3.4 |
| 2012Q1 |
18,642 |
3.4 |
$209,212,732 |
6.2 |
$863 |
2.7 |
| 2012Q2 |
22,045 |
6.4 |
$270,815,711 |
16.5 |
$945 |
9.4 |
| 2012Q3 |
23,385 |
0.5 |
$287,270,139 |
1.2 |
$945 |
0.6 |
| 2012Q4 |
21,935 |
-0.8 |
$293,161,266 |
1.8 |
$1,028 |
2.7 |
| 2013Q1 |
19,130 |
2.6 |
$221,343,070 |
5.8 |
$890 |
3.1 |
| 2013Q2 |
22,168 |
0.6 |
$260,980,205 |
-3.6 |
$906 |
-4.2 |
| 2013Q3 |
23,583 |
0.8 |
$289,007,756 |
0.6 |
$943 |
-0.2 |
| 2013Q4 |
22,337 |
1.8 |
$326,753,112 |
11.5 |
$1,125 |
9.5 |
| 2014Q1 |
20,435 |
6.8 |
$243,092,911 |
9.8 |
$915 |
2.8 |
| 2014Q2 |
24,437 |
10.2 |
$303,855,833 |
16.4 |
$956 |
5.6 |
| 2014Q3 |
26,095 |
10.7 |
$338,490,637 |
17.1 |
$998 |
5.8 |
| 2014Q4 |
24,109 |
7.9 |
$339,538,146 |
3.9 |
$1,083 |
-3.7 |
| 2015Q1 |
21,193 |
3.7 |
$249,622,017 |
2.7 |
$906 |
-1.0 |
| 2015Q2 |
23,664 |
-3.2 |
$290,432,489 |
-4.4 |
$944 |
-1.3 |
| 2015Q3 |
25,019 |
-4.1 |
$323,374,476 |
-4.5 |
$994 |
-0.4 |
| 2015Q4 |
23,149 |
-4.0 |
$324,234,842 |
-4.5 |
$1,077 |
-0.5 |
| 2016Q1 |
19,564 |
-7.7 |
$225,688,149 |
-9.6 |
$887 |
-2.1 |
| 2016Q2 |
21,971 |
-7.2 |
$268,698,120 |
-7.5 |
$941 |
-0.4 |
| 2016Q3 |
22,463 |
-10.2 |
$293,019,939 |
-9.4 |
$1,003 |
0.9 |
| 2016Q4 |
20,426 |
-11.8 |
$275,555,772 |
-15.0 |
$1,038 |
-3.7 |
| 2017Q1 |
17,564 |
-10.2 |
$210,389,584 |
-6.8 |
$921 |
3.8 |
| 2017Q2 |
20,109 |
-8.5 |
$250,111,695 |
-6.9 |
$957 |
1.7 |
| 2017Q3 |
20,991 |
-6.6 |
$265,654,865 |
-9.3 |
$974 |
-3.0 |
| 2017Q4 |
19,545 |
-4.3 |
$269,074,774 |
-2.4 |
$1,059 |
2.0 |
| 2018Q1 |
17,411 |
-0.9 |
$210,196,952 |
-0.1 |
$929 |
0.8 |
| 2018Q2 |
20,127 |
0.1 |
$259,851,429 |
3.9 |
$993 |
3.8 |
| 2018Q3 |
21,738 |
3.6 |
$292,606,738 |
10.1 |
$1,035 |
6.4 |
| 2018Q4 |
21,735 |
11.2 |
$321,971,316 |
19.7 |
$1,139 |
7.6 |
| 2019Q1 |
20,283 |
16.5 |
$262,587,709 |
24.9 |
$996 |
7.2 |
| 2019Q2 |
22,974 |
14.1 |
$314,708,233 |
21.1 |
$1,054 |
6.1 |
| 2019Q3 |
24,790 |
14.0 |
$366,886,084 |
25.4 |
$1,138 |
10.0 |
| 2019Q4 |
23,454 |
7.9 |
$369,233,502 |
14.7 |
$1,211 |
6.3 |
| 2020Q1 |
20,672 |
1.9 |
$274,537,341 |
4.6 |
$1,022 |
2.6 |
| 2020Q2 |
21,286 |
-7.3 |
$285,474,751 |
-9.3 |
$1,032 |
-2.1 |
| 2020Q3 |
22,153 |
-10.6 |
$317,321,210 |
-13.5 |
$1,102 |
-3.2 |
| 2020Q4 |
20,668 |
-11.9 |
$323,067,999 |
-12.5 |
$1,202 |
-0.7 |
| 2021Q1 |
18,302 |
-11.5 |
$230,835,932 |
-15.9 |
$970 |
-5.0 |
| 2021Q2 |
21,367 |
0.4 |
$297,482,639 |
4.2 |
$1,071 |
3.8 |
| 2021Q3 |
22,750 |
2.7 |
$335,567,847 |
5.8 |
$1,135 |
3.0 |
| 2021Q4 |
21,669 |
4.8 |
$361,919,320 |
12.0 |
$1,285 |
6.9 |
| 2022Q1 |
19,052 |
4.1 |
$260,423,713 |
12.8 |
$1,051 |
8.4 |
| 2022Q2 |
21,686 |
1.5 |
$328,094,143 |
10.3 |
$1,164 |
8.7 |
| 2022Q3 |
22,688 |
-0.3 |
$363,106,280 |
8.2 |
$1,231 |
8.5 |
| 2022Q4 |
21,618 |
-0.2 |
$372,644,747 |
3.0 |
$1,326 |
3.2 |
| 2023Q1 |
19,589 |
2.8 |
$301,138,996 |
15.6 |
$1,183 |
12.5 |
| 2023Q2 |
22,480 |
3.7 |
$362,982,018 |
10.6 |
$1,242 |
6.7 |
| 2023Q3 |
24,061 |
6.1 |
$404,978,649 |
11.5 |
$1,295 |
5.2 |
| 2023Q4 |
23,229 |
7.5 |
$435,628,903 |
16.9 |
$1,443 |
8.8 |
| 2024Q1 |
21,160 |
8.0 |
$347,938,715 |
15.5 |
$1,265 |
7.0 |
| 2024Q2 |
23,711 |
5.5 |
$397,015,800 |
9.4 |
$1,288 |
3.7 |
| 2024Q3 |
25,591 |
6.4 |
$453,407,743 |
12.0 |
$1,363 |
5.3 |
| 2024Q4 |
24,254 |
4.4 |
$483,112,878 |
10.9 |
$1,532 |
6.2 |
| 2025Q1 |
21,653 |
2.3 |
$356,059,277 |
2.3 |
$1,265 |
0.0 |
| 2025Q2 |
24,184 |
2.0 |
$428,793,240 |
8.0 |
$1,364 |
5.9 |
| 2025Q3b |
24,370 |
-4.8 |
$447,869,825 |
-1.2 |
$1,414 |
3.7 |
|
|
|
|
|
|
|
|
|
|
|
|
|
|
| aNorth American Industry Classification System. |
|
|
|
|
| bPreliminary. |
|
|
|
|
|
|
| Source: Quarterly Census of Employment and Wages. |
|
|
|
|
| Prepared by M. Moore, Research & Planning, WY DWS, 4/3/26. |
|
|
|
|
Figure: Average Monthly Employment in Construction (NAICS 23) in Wyoming, 2001Q1-2025Q3
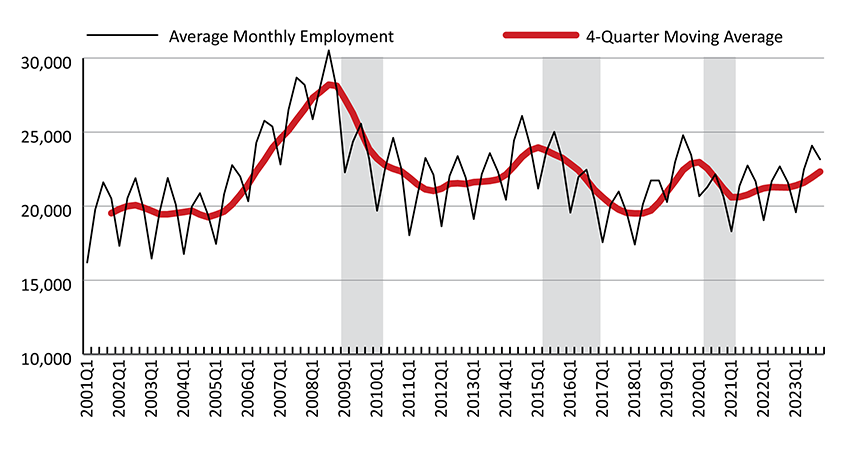
Figure: Over-the-Year Percent Change in Average Monthly Employment and Total Wages in Construction (NAICS 23) in Wyoming, 2002Q1-2025Q3
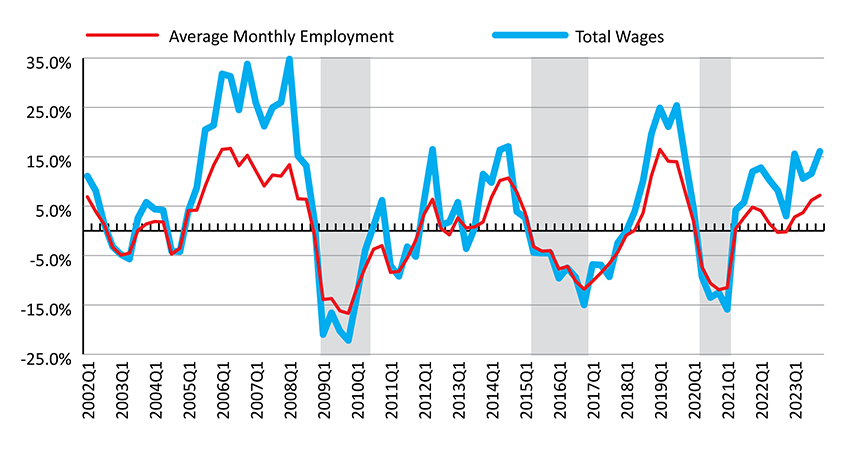
Shaded areas indicate periods of economic downturn: 2009Q1-2010Q1, 2015Q2-2016Q4, and 2020Q2-2021Q1.
Source: Quarterly Census of Employment and Wages.
Prepared by M. Moore, Research & Planning, WY DWS, 4/3/26.
 Hire Wyo