| Table 8: Wyoming Covered Employment, Total Wages, & Average Weekly Wage by Industry (NAICS) for Carbon County - Second Quarter 2022a |
|
|
|
|
|
|
|
|
|
|
|
|
|
|
|
|
Average Monthly Employment |
Total Wages |
Average Weekly Wage |
|
|
|
Change |
|
Change |
|
Change |
| NAICSb Code |
Ownership and Industry |
2022Q2 |
2021Q2 |
N |
% |
2022Q2 |
2021Q2 |
$ |
% |
2022Q2 |
2021Q2 |
$ |
% |
| 0 |
Ownership - Total |
6,793 |
7,262 |
-469 |
-6.5 |
$90,427,362 |
$97,409,855 |
-$6,982,493 |
-7.2 |
$1,024 |
$1,032 |
-$8 |
-0.8 |
| 0 |
Ownership - Private |
4,954 |
5,395 |
-441 |
-8.2 |
$64,406,015 |
$71,825,366 |
-$7,419,351 |
-10.3 |
$1,000 |
$1,024 |
-$24 |
-2.3 |
| 11 |
Agriculture, Forestry, Fishing & Hunting |
200 |
218 |
-18 |
-8.4 |
$1,785,201 |
$1,871,072 |
-$85,871 |
-4.6 |
$688 |
$660 |
$28 |
4.2 |
| 112 |
Animal Production & Aquaculture |
180 |
197 |
-16 |
-8.3 |
$1,577,771 |
$1,683,698 |
-$105,927 |
-6.3 |
$673 |
$659 |
$14 |
2.2 |
| 113 |
Forestry & Logging |
9 |
14 |
-5 |
-34.9 |
$140,009 |
$137,472 |
$2,537 |
1.8 |
$1,154 |
$738 |
$416 |
56.4 |
| 21 |
Mining, Including Oil & Gas |
139 |
169 |
-30 |
-17.9 |
$2,600,041 |
$3,416,578 |
-$816,537 |
-23.9 |
$1,442 |
$1,555 |
-$113 |
-7.3 |
| 213 |
Support Activities For Mining |
106 |
105 |
1 |
1.3 |
$1,921,287 |
$2,026,026 |
-$104,739 |
-5.2 |
$1,394 |
$1,489 |
-$95 |
-6.4 |
| 22 |
Utilities |
37 |
33 |
4 |
11.0 |
$746,139 |
$673,503 |
$72,636 |
10.8 |
$1,551 |
$1,554 |
-$3 |
-0.2 |
| 221 |
Utilities |
37 |
33 |
4 |
11.0 |
$746,139 |
$673,503 |
$72,636 |
10.8 |
$1,551 |
$1,554 |
-$3 |
-0.2 |
| 23 |
Construction |
400 |
831 |
-431 |
-51.9 |
$7,140,720 |
$16,414,377 |
-$9,273,657 |
-56.5 |
$1,373 |
$1,519 |
-$146 |
-9.6 |
| 236 |
Construction of Buildings |
85 |
78 |
7 |
9.0 |
$834,849 |
$741,698 |
$93,151 |
12.6 |
$758 |
$735 |
$24 |
3.3 |
| 237 |
Heavy & Civil Engineering Construction |
102 |
480 |
-378 |
-78.8 |
$1,766,201 |
$10,312,760 |
-$8,546,559 |
-82.9 |
$1,336 |
$1,654 |
-$318 |
-19.2 |
| 238 |
Specialty Trade Contractors |
214 |
274 |
-60 |
-22.0 |
$4,539,670 |
$5,359,919 |
-$820,249 |
-15.3 |
$1,634 |
$1,505 |
$130 |
8.6 |
| 42 |
Wholesale Trade |
49 |
58 |
-9 |
-15.6 |
$634,566 |
$671,714 |
-$37,148 |
-5.5 |
$1,003 |
$896 |
$107 |
11.9 |
| 423 |
Merchant Wholesalers, Durable Goods |
18 |
23 |
-5 |
-23.2 |
$262,727 |
$256,291 |
$6,436 |
2.5 |
$1,144 |
$857 |
$287 |
33.4 |
| 424 |
Merchant Wholesalers, Nondurable Goods |
31 |
35 |
-4 |
-10.6 |
$371,839 |
$415,423 |
-$43,584 |
-10.5 |
$923 |
$922 |
$1 |
0.1 |
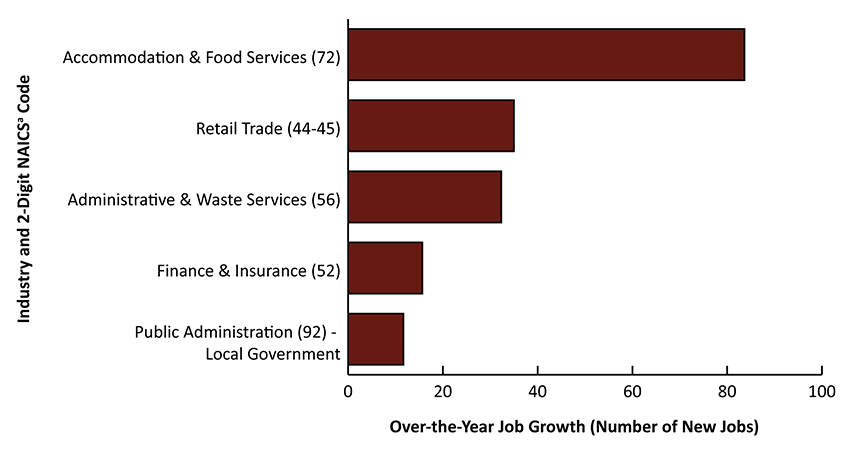
| 44-45 |
Retail Trade |
756 |
721 |
35 |
4.9 |
$5,875,911 |
$5,527,937 |
$347,974 |
6.3 |
$598 |
$590 |
$8 |
1.4 |
| 441 |
Motor Vehicle & Parts Dealers |
73 |
79 |
-6 |
-8.0 |
$917,936 |
$947,723 |
-$29,787 |
-3.1 |
$972 |
$923 |
$49 |
5.3 |
| 444 |
Building Material & Garden Equipment & Supplies Dealers |
74 |
75 |
-1 |
-1.3 |
$577,381 |
$629,319 |
-$51,938 |
-8.3 |
$598 |
$643 |
-$45 |
-7.0 |
| 445 |
Food & Beverage Retailers |
127 |
127 |
0 |
-0.3 |
$964,587 |
$973,029 |
-$8,442 |
-0.9 |
$584 |
$588 |
-$4 |
-0.6 |
| 449 |
Furniture, Home Furnishings, Electronics, & Appliance Retailers |
20 |
N/A |
N/A |
N/A |
$219,234 |
N/A |
N/A |
N/A |
$830 |
N/A |
N/A |
N/A |
| 457 |
Gasoline Stations & Fuel Dealers |
234 |
N/A |
N/A |
N/A |
$1,657,841 |
N/A |
N/A |
N/A |
$544 |
N/A |
N/A |
N/A |
| 458 |
Clothing, Clothing Accessories, Shoe, & Jewelry Retailers |
6 |
N/A |
N/A |
N/A |
$15,052 |
N/A |
N/A |
N/A |
$183 |
N/A |
N/A |
N/A |
| 459 |
Sporting Goods, Hobby, Musical Instrument, Book, & Miscellaneous Retailers |
28 |
N/A |
N/A |
N/A |
$192,989 |
N/A |
N/A |
N/A |
$537 |
N/A |
N/A |
N/A |
| 48-49 |
Transportation & Warehousing |
155 |
165 |
-11 |
-6.4 |
$2,397,638 |
$2,316,329 |
$81,309 |
3.5 |
$1,192 |
$1,078 |
$115 |
10.6 |
| 484 |
Truck Transportation |
83 |
85 |
-3 |
-3.1 |
$1,050,289 |
$1,077,134 |
-$26,845 |
-2.5 |
$977 |
$971 |
$6 |
0.6 |
| 486 |
Pipeline Transportation |
43 |
43 |
0 |
-0.8 |
$1,042,847 |
$905,353 |
$137,494 |
15.2 |
$1,880 |
$1,620 |
$260 |
16.1 |
| 488 |
Support Activities For Transportation |
8 |
13 |
-5 |
-37.5 |
$84,295 |
$131,436 |
-$47,141 |
-35.9 |
$778 |
$758 |
$20 |
2.6 |
| 51 |
Information |
51 |
60 |
-9 |
-14.9 |
$490,972 |
$582,507 |
-$91,535 |
-15.7 |
$736 |
$743 |
-$7 |
-0.9 |
| 513 |
Publishing Industries |
16 |
N/A |
N/A |
N/A |
$82,892 |
N/A |
N/A |
N/A |
$407 |
$415 |
-$8 |
-2.0 |
| 517 |
Telecommunications |
19 |
23 |
-4 |
-16.0 |
$308,309 |
$365,085 |
-$56,776 |
-15.6 |
$1,227 |
$1,221 |
$6 |
0.5 |
| 52 |
Finance & Insurance |
137 |
121 |
16 |
13.0 |
$1,722,227 |
$1,517,409 |
$204,818 |
13.5 |
$969 |
$965 |
$5 |
0.5 |
| 522 |
Credit Intermediation & Related Activities |
81 |
77 |
4 |
5.6 |
$954,267 |
$950,376 |
$3,891 |
0.4 |
$906 |
$954 |
-$47 |
-5.0 |
| 523 |
Securities, Commodity Contracts, & Other Financial Investments & Related Activities |
14 |
13 |
1 |
5.2 |
$376,780 |
$287,417 |
$89,363 |
31.1 |
$2,120 |
$1,701 |
$420 |
24.7 |
| 524 |
Insurance Carriers & Related Activities |
42 |
31 |
11 |
34.1 |
$391,180 |
$279,616 |
$111,564 |
39.9 |
$716 |
$687 |
$30 |
4.4 |
| 53 |
Real Estate & Rental & Leasing |
51 |
61 |
-10 |
-16.9 |
$533,202 |
$557,050 |
-$23,848 |
-4.3 |
$809 |
$702 |
$107 |
15.2 |
| 531 |
Real Estate |
32 |
42 |
-10 |
-24.4 |
$262,867 |
$305,852 |
-$42,985 |
-14.1 |
$632 |
$556 |
$76 |
13.7 |
| 532 |
Rental & Leasing Services |
19 |
19 |
0 |
0.0 |
$270,335 |
$251,198 |
$19,137 |
7.6 |
$1,114 |
$1,035 |
$79 |
7.6 |
| 54 |
Professional & Technical Services |
112 |
116 |
-4 |
-3.4 |
$1,515,772 |
$1,550,383 |
-$34,611 |
-2.2 |
$1,041 |
$1,028 |
$13 |
1.3 |
| 541 |
Professional, Scientific, & Technical Services |
112 |
116 |
-4 |
-3.4 |
$1,515,772 |
$1,550,383 |
-$34,611 |
-2.2 |
$1,041 |
$1,028 |
$13 |
1.3 |
| 55 |
Management of Companies & Enterprises |
14 |
15 |
-1 |
-6.7 |
$282,131 |
$305,772 |
-$23,641 |
-7.7 |
$1,550 |
$1,568 |
-$18 |
-1.1 |
| 551 |
Management of Companies & Enterprises |
14 |
15 |
-1 |
-6.7 |
$282,131 |
$305,772 |
-$23,641 |
-7.7 |
$1,550 |
$1,568 |
-$18 |
-1.1 |
| 56 |
Administrative & Waste Services |
192 |
160 |
32 |
20.2 |
$1,984,463 |
$1,743,803 |
$240,660 |
13.8 |
$794 |
$838 |
-$45 |
-5.3 |
| 561 |
Administrative & Support Services |
166 |
137 |
30 |
21.7 |
$1,719,837 |
$1,479,224 |
$240,613 |
16.3 |
$795 |
$833 |
-$37 |
-4.5 |
| 562 |
Waste Management & Remediation Services |
26 |
23 |
3 |
11.4 |
$264,626 |
$264,579 |
$47 |
0.0 |
$783 |
$872 |
-$89 |
-10.3 |
| 61 |
Educational Services |
6 |
5 |
1 |
13.4 |
$79,797 |
$76,071 |
$3,726 |
4.9 |
$1,083 |
$1,170 |
-$88 |
-7.5 |
| 611 |
Educational Services |
6 |
5 |
1 |
13.4 |
$79,797 |
$76,071 |
$3,726 |
4.9 |
$1,083 |
$1,170 |
-$88 |
-7.5 |
| 62 |
Health Care & Social Assistance |
363 |
378 |
-15 |
-4.1 |
$3,409,149 |
$3,260,433 |
$148,716 |
4.6 |
$722 |
$663 |
$60 |
9.0 |
| 621 |
Ambulatory Health Care Services |
151 |
157 |
-6 |
-3.6 |
$1,963,333 |
$1,883,385 |
$79,948 |
4.2 |
$1,000 |
$925 |
$75 |
8.2 |
| 623 |
Nursing & Residential Care Facilities |
88 |
N/A |
N/A |
N/A |
$916,018 |
N/A |
N/A |
N/A |
$798 |
N/A |
N/A |
N/A |
| 624 |
Social Assistance |
124 |
N/A |
N/A |
N/A |
$529,798 |
N/A |
N/A |
N/A |
$330 |
N/A |
N/A |
N/A |
| 71 |
Arts, Entertainment, & Recreation |
75 |
89 |
-13 |
-15.0 |
$529,805 |
$614,488 |
-$84,683 |
-13.8 |
$541 |
$533 |
$8 |
1.5 |
| 711 |
Performing Arts & Spectator Sports |
6 |
N/A |
N/A |
N/A |
$35,038 |
N/A |
N/A |
N/A |
$449 |
N/A |
N/A |
N/A |
| 72 |
Accommodation & Food Services |
1,344 |
1,261 |
84 |
6.6 |
$8,382,899 |
$7,086,129 |
$1,296,770 |
18.3 |
$480 |
$432 |
$47 |
10.9 |
| 721 |
Accommodation |
813 |
662 |
151 |
22.8 |
$5,956,055 |
$4,575,071 |
$1,380,984 |
30.2 |
$564 |
$532 |
$32 |
6.0 |
| 722 |
Food Services & Drinking Places |
532 |
599 |
-67 |
-11.2 |
$2,426,844 |
$2,511,058 |
-$84,214 |
-3.4 |
$351 |
$323 |
$28 |
8.8 |
| 81 |
Other Services, Except Public Administration |
90 |
94 |
-4 |
-4.3 |
$749,062 |
$753,342 |
-$4,280 |
-0.6 |
$640 |
$616 |
$24 |
3.9 |
| 811 |
Repair & Maintenance |
62 |
65 |
-3 |
-4.6 |
$629,875 |
$634,977 |
-$5,102 |
-0.8 |
$781 |
$751 |
$30 |
4.0 |
| 813 |
Membership Associations & Organizations |
18 |
17 |
0 |
2.0 |
$48,036 |
$58,585 |
-$10,549 |
-18.0 |
$209 |
$260 |
-$51 |
-19.6 |
|
|
|
|
|
|
|
|
|
|
|
|
|
|
| 0 |
Ownership - Federal Government |
161 |
179 |
-18 |
-10.2 |
$2,970,843 |
$3,007,600 |
-$36,757 |
-1.2 |
$1,422 |
$1,292 |
$130 |
10.0 |
| 48-49 |
Transportation & Warehousing |
31 |
35 |
-4 |
-11.4 |
$456,048 |
$426,756 |
$29,292 |
6.9 |
$1,132 |
$938 |
$194 |
20.7 |
| 491 |
Postal Service |
31 |
35 |
-4 |
-11.4 |
$456,048 |
$426,756 |
$29,292 |
6.9 |
$1,132 |
$938 |
$194 |
20.7 |
| 92 |
Public Administration |
126 |
140 |
-14 |
-10.0 |
$2,431,548 |
$2,497,460 |
-$65,912 |
-2.6 |
$1,488 |
$1,375 |
$113 |
8.2 |
| 924 |
Administration of Environmental Programs |
122 |
135 |
-13 |
-9.9 |
$2,376,178 |
$2,439,438 |
-$63,260 |
-2.6 |
$1,502 |
$1,390 |
$112 |
8.1 |
|
|
|
|
|
|
|
|
|
|
|
|
|
|
| 0 |
Ownership - State Government |
354 |
385 |
-30 |
-7.9 |
$5,372,089 |
$5,633,049 |
-$260,960 |
-4.6 |
$1,166 |
$1,126 |
$40 |
3.5 |
| 92 |
Public Administration |
351 |
382 |
-30 |
-7.9 |
$5,340,698 |
$5,601,522 |
-$260,824 |
-4.7 |
$1,169 |
$1,129 |
$40 |
3.6 |
| 922 |
Justice, Public Order, & Safety Activities |
226 |
250 |
-25 |
-9.9 |
$3,683,784 |
$3,910,181 |
-$226,397 |
-5.8 |
$1,256 |
$1,202 |
$54 |
4.5 |
| 923 |
Administration of Human Resource Programs |
25 |
25 |
-1 |
-2.6 |
$295,128 |
$298,065 |
-$2,937 |
-1.0 |
$920 |
$905 |
$15 |
1.7 |
| 924 |
Administration of Environmental Programs |
13 |
12 |
1 |
8.1 |
$204,144 |
$216,031 |
-$11,887 |
-5.5 |
$1,178 |
$1,348 |
-$170 |
-12.6 |
| 926 |
Administration of Economic Programs |
84 |
89 |
-5 |
-5.6 |
$1,103,777 |
$1,109,920 |
-$6,143 |
-0.6 |
$1,015 |
$963 |
$52 |
5.4 |
|
|
|
|
|
|
|
|
|
|
|
|
|
|
| 0 |
Ownership - Local Government |
1,324 |
1,304 |
21 |
1.6 |
$17,678,415 |
$16,943,840 |
$734,575 |
4.3 |
$1,027 |
$1,000 |
$27 |
2.7 |
| 92 |
Public Administration |
416 |
404 |
12 |
2.9 |
$4,298,426 |
$4,163,357 |
$135,069 |
3.2 |
$795 |
$792 |
$3 |
0.3 |
| 921 |
Executive, Legislative & General Government |
380 |
368 |
12 |
3.2 |
$3,920,512 |
$3,798,000 |
$122,512 |
3.2 |
$794 |
$794 |
$0 |
0.1 |
| 924 |
Administration of Environmental Programs |
13 |
11 |
1 |
11.8 |
$145,989 |
$142,176 |
$3,813 |
2.7 |
$886 |
$965 |
-$79 |
-8.2 |
|
|
|
|
|
|
|
|
|
|
|
|
|
|
| N/A = not available due to NAICS code changes for 2022 or confidentiality. |
|
|
|
|
|
|
|
|
|
|
| aPreliminary. |
| bNorth American Industry Classification System. |
| Source: Quarterly Census of Employment and Wages, developed through a cooperative program between Research & Planning and the U.S. Bureau of Labor Statistics. |
| Extract Date: October 2022. |
| Prepared by M. Moore, Research & Planning, WY DWS, 10/17/22. |


 Wyoming at Work