| Table 5: Wyoming Covered Employment, Total Wages, & Average Weekly Wage by Industry (NAICS) for Albany County - Second Quarter 2022a |
|
|
|
|
|
|
|
|
|
|
|
|
|
|
|
|
Average Monthly Employment |
Total Wages |
Average Weekly Wage |
|
|
|
Change |
|
Change |
|
Change |
| NAICSb Code |
Ownership and Industry |
2022Q2 |
2021Q2 |
N |
% |
2022Q2 |
2021Q2 |
$ |
% |
2022Q2 |
2021Q2 |
$ |
% |
| 0 |
Ownership - Total |
16,454 |
15,967 |
487 |
3.0 |
$194,587,125 |
$181,076,218 |
$13,510,907 |
7.5 |
$910 |
$872 |
$37 |
4.3 |
| 0 |
Ownership - Private |
10,954 |
10,507 |
447 |
4.3 |
$117,281,543 |
$105,161,565 |
$12,119,978 |
11.5 |
$824 |
$770 |
$54 |
7.0 |
| 11 |
Agriculture, Forestry, Fishing & Hunting |
82 |
74 |
8 |
10.9 |
$794,256 |
$762,411 |
$31,845 |
4.2 |
$748 |
$796 |
-$48 |
-6.0 |
| 112 |
Animal Production & Aquaculture |
54 |
49 |
5 |
10.9 |
$647,412 |
$619,795 |
$27,617 |
4.5 |
$917 |
$973 |
-$56 |
-5.8 |
| 21 |
Mining, Including Oil & Gas |
41 |
49 |
-8 |
-15.8 |
$577,541 |
$629,961 |
-$52,420 |
-8.3 |
$1,084 |
$996 |
$88 |
8.8 |
| 213 |
Support Activities For Mining |
22 |
28 |
-7 |
-23.5 |
$372,821 |
$410,798 |
-$37,977 |
-9.2 |
$1,323 |
$1,115 |
$208 |
18.6 |
| 22 |
Utilities |
34 |
37 |
-3 |
-8.0 |
$747,628 |
$717,931 |
$29,697 |
4.1 |
$1,675 |
$1,479 |
$196 |
13.2 |
| 221 |
Utilities |
34 |
37 |
-3 |
-8.0 |
$747,628 |
$717,931 |
$29,697 |
4.1 |
$1,675 |
$1,479 |
$196 |
13.2 |
| 23 |
Construction |
787 |
819 |
-32 |
-3.9 |
$9,674,296 |
$9,587,719 |
$86,577 |
0.9 |
$946 |
$900 |
$45 |
5.0 |
| 236 |
Construction of Buildings |
209 |
214 |
-5 |
-2.2 |
$2,441,448 |
$2,418,298 |
$23,150 |
1.0 |
$897 |
$869 |
$28 |
3.2 |
| 237 |
Heavy & Civil Engineering Construction |
48 |
30 |
18 |
58.9 |
$785,170 |
$575,161 |
$210,009 |
36.5 |
$1,267 |
$1,475 |
-$208 |
-14.1 |
| 238 |
Specialty Trade Contractors |
530 |
575 |
-45 |
-7.9 |
$6,447,678 |
$6,594,260 |
-$146,582 |
-2.2 |
$936 |
$882 |
$54 |
6.1 |
| 31-33 |
Manufacturing |
516 |
544 |
-28 |
-5.1 |
$7,224,521 |
$7,102,571 |
$121,950 |
1.7 |
$1,076 |
$1,004 |
$73 |
7.2 |
| 312 |
Beverage & Tobacco Product Manufacturing |
14 |
N/A |
N/A |
N/A |
$63,940 |
N/A |
N/A |
N/A |
$343 |
N/A |
N/A |
N/A |
| 321 |
Wood Product Manufacturing |
29 |
25 |
4 |
15.8 |
$255,303 |
$226,501 |
$28,802 |
12.7 |
$670 |
$688 |
-$18 |
-2.7 |
| 323 |
Printing & Related Support Activities |
32 |
42 |
-10 |
-23.8 |
$228,479 |
$288,663 |
-$60,184 |
-20.8 |
$549 |
$529 |
$21 |
3.9 |
| 332 |
Fabricated Metal Product Manufacturing |
83 |
N/A |
N/A |
N/A |
$1,091,596 |
N/A |
N/A |
N/A |
$1,008 |
N/A |
N/A |
N/A |
| 337 |
Furniture & Related Product Manufacturing |
19 |
22 |
-3 |
-13.8 |
$147,343 |
$163,455 |
-$16,112 |
-9.9 |
$607 |
$580 |
$27 |
4.6 |
| 42 |
Wholesale Trade |
155 |
156 |
-1 |
-0.6 |
$2,034,562 |
$1,958,642 |
$75,920 |
3.9 |
$1,008 |
$964 |
$44 |
4.5 |
| 423 |
Merchant Wholesalers, Durable Goods |
102 |
100 |
2 |
1.7 |
$1,358,224 |
$1,291,303 |
$66,921 |
5.2 |
$1,028 |
$993 |
$34 |
3.5 |
| 44-45 |
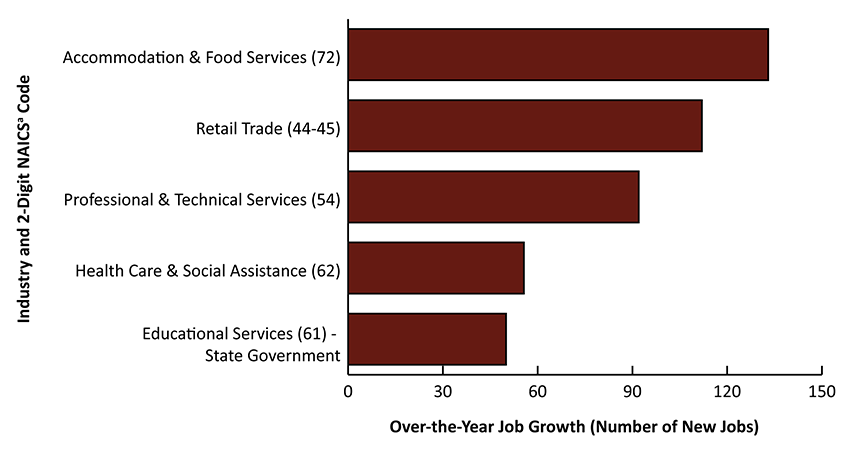
Retail Trade |
1,811 |
1,699 |
112 |
6.6 |
$14,139,114 |
$12,794,277 |
$1,344,837 |
10.5 |
$601 |
$579 |
$21 |
3.7 |
| 441 |
Motor Vehicle & Parts Dealers |
335 |
300 |
35 |
11.5 |
$4,260,222 |
$3,606,851 |
$653,371 |
18.1 |
$978 |
$924 |
$54 |
5.9 |
| 444 |
Building Material & Garden Equipment & Supplies Dealers |
136 |
133 |
3 |
2.3 |
$1,171,974 |
$1,161,084 |
$10,890 |
0.9 |
$664 |
$673 |
-$9 |
-1.3 |
| 445 |
Food & Beverage Retailers |
256 |
263 |
-6 |
-2.4 |
$1,686,154 |
$1,685,361 |
$793 |
0.0 |
$506 |
$494 |
$12 |
2.5 |
| 456 |
Health & Personal Care Retailers |
71 |
N/A |
N/A |
N/A |
$813,919 |
N/A |
N/A |
N/A |
$882 |
N/A |
N/A |
N/A |
| 457 |
Gasoline Stations & Fuel Dealers |
294 |
N/A |
N/A |
N/A |
$1,990,496 |
N/A |
N/A |
N/A |
$521 |
N/A |
N/A |
N/A |
| 458 |
Clothing, Clothing Accessories, Shoe, & Jewelry Retailers |
71 |
N/A |
N/A |
N/A |
$301,686 |
N/A |
N/A |
N/A |
$327 |
N/A |
N/A |
N/A |
| 459 |
Sporting Goods, Hobby, Musical Instrument, Book, & Miscellaneous Retailers |
179 |
N/A |
N/A |
N/A |
$882,450 |
N/A |
N/A |
N/A |
$379 |
N/A |
N/A |
N/A |
| 48-49 |
Transportation & Warehousing |
182 |
179 |
3 |
1.7 |
$2,069,469 |
$1,895,119 |
$174,350 |
9.2 |
$873 |
$813 |
$60 |
7.4 |
| 484 |
Truck Transportation |
63 |
56 |
7 |
13.1 |
$734,481 |
$655,657 |
$78,824 |
12.0 |
$892 |
$901 |
-$8 |
-0.9 |
| 488 |
Support Activities For Transportation |
29 |
31 |
-2 |
-6.5 |
$392,917 |
$382,591 |
$10,326 |
2.7 |
$1,054 |
$960 |
$95 |
9.9 |
| 51 |
Information |
79 |
75 |
4 |
4.9 |
$1,313,405 |
$955,358 |
$358,047 |
37.5 |
$1,279 |
$976 |
$303 |
31.1 |
| 513 |
Broadcasting & Telecommunications |
18 |
N/A |
N/A |
N/A |
$323,371 |
N/A |
N/A |
N/A |
$1,408 |
N/A |
N/A |
N/A |
| 516 |
Internet Publishing & Broadcasting |
18 |
N/A |
N/A |
N/A |
$156,326 |
N/A |
N/A |
N/A |
$681 |
N/A |
N/A |
N/A |
| 517 |
Telecommunications |
23 |
23 |
0 |
0.0 |
$318,100 |
$347,269 |
-$29,169 |
-8.4 |
$1,049 |
$1,145 |
-$96 |
-8.4 |
| 518 |
Data Processing, Hosting & Related Services |
9 |
N/A |
N/A |
N/A |
$397,970 |
N/A |
N/A |
N/A |
$3,281 |
N/A |
N/A |
N/A |
| 52 |
Finance & Insurance |
506 |
483 |
23 |
4.7 |
$7,980,922 |
$7,616,373 |
$364,549 |
4.8 |
$1,213 |
$1,212 |
$1 |
0.1 |
| 522 |
Credit Intermediation & Related Activities |
231 |
210 |
21 |
9.8 |
$3,493,403 |
$3,357,337 |
$136,066 |
4.1 |
$1,165 |
$1,230 |
-$65 |
-5.3 |
| 524 |
Insurance Carriers & Related Activities |
245 |
248 |
-3 |
-1.1 |
$3,595,067 |
$3,502,189 |
$92,878 |
2.7 |
$1,129 |
$1,088 |
$41 |
3.8 |
| 53 |
Real Estate & Rental & Leasing |
199 |
196 |
4 |
1.9 |
$1,580,144 |
$1,425,895 |
$154,249 |
10.8 |
$610 |
$561 |
$49 |
8.8 |
| 531 |
Real Estate |
177 |
171 |
5 |
3.1 |
$1,373,355 |
$1,188,999 |
$184,356 |
15.5 |
$598 |
$534 |
$64 |
12.0 |
| 532 |
Rental & Leasing Services |
23 |
24 |
-2 |
-6.8 |
$206,789 |
$236,896 |
-$30,107 |
-12.7 |
$702 |
$749 |
-$47 |
-6.3 |
| 54 |
Professional & Technical Services |
1,083 |
991 |
92 |
9.3 |
$18,215,397 |
$14,624,011 |
$3,591,386 |
24.6 |
$1,294 |
$1,136 |
$159 |
14.0 |
| 541 |
Professional, Scientific, & Technical Services |
1,083 |
991 |
92 |
9.3 |
$18,215,397 |
$14,624,011 |
$3,591,386 |
24.6 |
$1,294 |
$1,136 |
$159 |
14.0 |
| 55 |
Management of Companies & Enterprises |
7 |
N/A |
N/A |
N/A |
$173,600 |
N/A |
N/A |
N/A |
$2,002 |
N/A |
N/A |
N/A |
| 551 |
Management of Companies & Enterprises |
7 |
N/A |
N/A |
N/A |
$173,600 |
N/A |
N/A |
N/A |
$2,002 |
N/A |
N/A |
N/A |
| 56 |
Administrative & Waste Services |
352 |
311 |
41 |
13.3 |
$4,238,322 |
$3,024,089 |
$1,214,233 |
40.2 |
$925 |
$748 |
$177 |
23.7 |
| 561 |
Administrative & Support Services |
331 |
287 |
44 |
15.2 |
$3,963,316 |
$2,785,633 |
$1,177,683 |
42.3 |
$921 |
$746 |
$175 |
23.5 |
| 562 |
Waste Management & Remediation Services |
21 |
24 |
-2 |
-9.9 |
$275,006 |
$238,456 |
$36,550 |
15.3 |
$992 |
$775 |
$217 |
28.0 |
| 61 |
Educational Services |
317 |
271 |
46 |
17.0 |
$3,686,332 |
$2,927,624 |
$758,708 |
25.9 |
$895 |
$832 |
$63 |
7.6 |
| 611 |
Educational Services |
317 |
271 |
46 |
17.0 |
$3,686,332 |
$2,927,624 |
$758,708 |
25.9 |
$895 |
$832 |
$63 |
7.6 |
| 62 |
Health Care & Social Assistance |
2,102 |
2,046 |
56 |
2.7 |
$27,464,728 |
$25,548,168 |
$1,916,560 |
7.5 |
$1,005 |
$961 |
$45 |
4.7 |
| 621 |
Ambulatory Health Care Services |
726 |
668 |
58 |
8.7 |
$10,886,954 |
$10,213,376 |
$673,578 |
6.6 |
$1,154 |
$1,176 |
-$23 |
-1.9 |
| 624 |
Social Assistance |
564 |
586 |
-23 |
-3.9 |
$3,771,305 |
$3,666,001 |
$105,304 |
2.9 |
$515 |
$481 |
$34 |
7.0 |
| 71 |
Arts, Entertainment, & Recreation |
167 |
155 |
12 |
7.5 |
$659,321 |
$609,504 |
$49,817 |
8.2 |
$304 |
$302 |
$2 |
0.6 |
| 711 |
Performing Arts & Spectator Sports |
8 |
8 |
0 |
-4.0 |
$21,346 |
$21,570 |
-$224 |
-1.0 |
$205 |
$199 |
$6 |
3.0 |
| 712 |
Museums, Historical Sites, Zoos, & Parks |
19 |
18 |
1 |
7.5 |
$118,218 |
$110,399 |
$7,819 |
7.1 |
$479 |
$481 |
-$2 |
-0.4 |
| 713 |
Amusements, Gambling, & Recreation |
140 |
129 |
11 |
8.3 |
$519,757 |
$477,535 |
$42,222 |
8.8 |
$286 |
$285 |
$1 |
0.5 |
| 72 |
Accommodation & Food Services |
2,106 |
1,973 |
133 |
6.7 |
$10,303,738 |
$8,880,482 |
$1,423,256 |
16.0 |
$376 |
$346 |
$30 |
8.7 |
| 721 |
Accommodation |
380 |
359 |
20 |
5.7 |
$1,891,530 |
$1,611,643 |
$279,887 |
17.4 |
$383 |
$345 |
$38 |
11.1 |
| 722 |
Food Services & Drinking Places |
1,727 |
1,614 |
113 |
7.0 |
$8,412,208 |
$7,268,839 |
$1,143,369 |
15.7 |
$375 |
$346 |
$28 |
8.2 |
| 81 |
Other Services, Except Public Administration |
421 |
441 |
-20 |
-4.5 |
$4,232,082 |
$3,948,004 |
$284,078 |
7.2 |
$773 |
$689 |
$84 |
12.2 |
| 811 |
Repair & Maintenance |
192 |
182 |
10 |
5.5 |
$2,113,694 |
$1,805,735 |
$307,959 |
17.1 |
$847 |
$763 |
$84 |
11.0 |
| 812 |
Personal & Laundry Services |
110 |
118 |
-8 |
-6.8 |
$878,165 |
$888,856 |
-$10,691 |
-1.2 |
$614 |
$579 |
$35 |
6.0 |
| 813 |
Membership Associations & Organizations |
114 |
130 |
-16 |
-12.1 |
$1,221,210 |
$1,207,168 |
$14,042 |
1.2 |
$822 |
$714 |
$107 |
15.0 |
| 814 |
Private Households |
5 |
11 |
-6 |
-54.5 |
$19,013 |
$46,245 |
-$27,232 |
-58.9 |
$293 |
$323 |
-$31 |
-9.6 |
| 99 |
Unclassified |
7 |
5 |
1 |
25.1 |
$172,165 |
$89,606 |
$82,559 |
92.1 |
$1,986 |
$1,293 |
$692 |
53.5 |
|
|
|
|
|
|
|
|
|
|
|
|
|
|
| 0 |
Ownership - Federal Government |
182 |
195 |
-13 |
-6.7 |
$3,191,994 |
$2,995,845 |
$196,149 |
6.5 |
$1,349 |
$1,182 |
$167 |
14.2 |
| 48-49 |
Transportation & Warehousing |
63 |
63 |
0 |
-0.5 |
$893,353 |
$899,810 |
-$6,457 |
-0.7 |
$1,091 |
$1,093 |
-$2 |
-0.2 |
| 491 |
Postal Service |
63 |
63 |
0 |
-0.5 |
$893,353 |
$899,810 |
-$6,457 |
-0.7 |
$1,091 |
$1,093 |
-$2 |
-0.2 |
| 92 |
Public Administration |
115 |
127 |
-12 |
-9.2 |
$2,177,812 |
$1,953,829 |
$223,983 |
11.5 |
$1,457 |
$1,187 |
$270 |
22.8 |
| 926 |
Administration of Economic Programs |
16 |
14 |
2 |
14.6 |
$183,318 |
$132,861 |
$50,457 |
38.0 |
$900 |
$748 |
$152 |
20.4 |
|
|
|
|
|
|
|
|
|
|
|
|
|
|
| 0 |
Ownership - State Government |
3,737 |
3,692 |
45 |
1.2 |
$56,899,192 |
$57,091,449 |
-$192,257 |
-0.3 |
$1,171 |
$1,190 |
-$18 |
-1.5 |
| 61 |
Educational Services |
3,402 |
3,352 |
50 |
1.5 |
$52,253,827 |
$52,471,732 |
-$217,905 |
-0.4 |
$1,182 |
$1,204 |
-$23 |
-1.9 |
| 611 |
Educational Services |
3,402 |
3,352 |
50 |
1.5 |
$52,253,827 |
$52,471,732 |
-$217,905 |
-0.4 |
$1,182 |
$1,204 |
-$23 |
-1.9 |
| 92 |
Public Administration |
276 |
281 |
-5 |
-1.8 |
$3,930,420 |
$3,895,676 |
$34,744 |
0.9 |
$1,095 |
$1,066 |
$29 |
2.7 |
| 922 |
Justice, Public Order, & Safety Activities |
22 |
23 |
0 |
-1.5 |
$398,363 |
$386,084 |
$12,279 |
3.2 |
$1,372 |
$1,310 |
$62 |
4.8 |
| 923 |
Administration of Human Resource Programs |
37 |
42 |
-5 |
-12.6 |
$462,864 |
$497,897 |
-$35,033 |
-7.0 |
$962 |
$905 |
$58 |
6.4 |
| 924 |
Administration of Environmental Programs |
75 |
71 |
4 |
5.7 |
$1,150,398 |
$1,080,672 |
$69,726 |
6.5 |
$1,185 |
$1,176 |
$9 |
0.7 |
| 926 |
Administration of Economic Programs |
136 |
140 |
-4 |
-3.1 |
$1,844,138 |
$1,868,472 |
-$24,334 |
-1.3 |
$1,043 |
$1,024 |
$19 |
1.8 |
|
|
|
|
|
|
|
|
|
|
|
|
|
|
| 0 |
Ownership - Local Government |
1,581 |
1,573 |
8 |
0.5 |
$17,214,396 |
$15,827,359 |
$1,387,037 |
8.8 |
$838 |
$774 |
$64 |
8.2 |
| 92 |
Public Administration |
602 |
578 |
24 |
4.2 |
$6,468,519 |
$6,042,307 |
$426,212 |
7.1 |
$827 |
$805 |
$22 |
2.8 |
|
|
|
|
|
|
|
|
|
|
|
|
|
|
| N/A = not available due to NAICS code changes for 2022 or confidentiality. |
|
|
|
|
|
|
|
|
|
|
| aPreliminary. |
| bNorth American Industry Classification System. |
| Source: Quarterly Census of Employment and Wages, developed through a cooperative program between Research & Planning and the U.S. Bureau of Labor Statistics. |
| Extract Date: October 2022. |
| Prepared by M. Moore, Research & Planning, WY DWS, 10/17/22. |


 Wyoming at Work