| Table 26: Wyoming Covered Employment, Total Wages, & Average Weekly Wage by Industry (NAICS) for Washakie County - Second Quarter 2022a |
|
|
|
|
|
|
|
|
|
|
|
|
|
|
|
|
Average Monthly Employment |
Total Wages |
Average Weekly Wage |
|
|
|
Change |
|
Change |
|
Change |
| NAICSb Code |
Ownership and Industry |
2022Q2 |
2021Q2 |
N |
% |
2022Q2 |
2021Q2 |
$ |
% |
2022Q2 |
2021Q2 |
$ |
% |
| 0 |
Ownership - Total |
3,507 |
3,604 |
-97 |
-2.7 |
$41,473,594 |
$40,454,338 |
$1,019,256 |
2.5 |
$910 |
$863 |
$46 |
5.3 |
| 0 |
Ownership - Private |
2,701 |
2,755 |
-54 |
-2.0 |
$31,698,157 |
$30,840,509 |
$857,648 |
2.8 |
$903 |
$861 |
$42 |
4.8 |
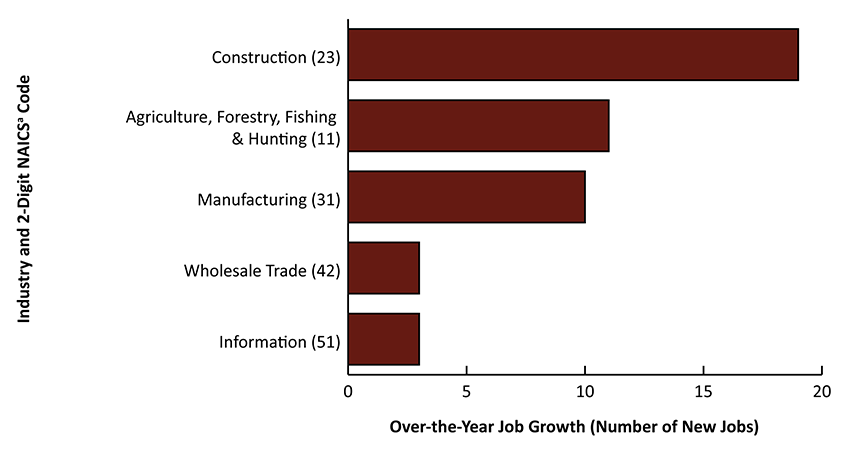
| 11 |
Agriculture, Forestry, Fishing & Hunting |
143 |
131 |
11 |
8.6 |
$1,389,254 |
$1,085,371 |
$303,883 |
28.0 |
$749 |
$636 |
$113 |
17.8 |
| 21 |
Mining, Including Oil & Gas |
65 |
103 |
-38 |
-37.0 |
$1,172,347 |
$1,898,424 |
-$726,077 |
-38.2 |
$1,394 |
$1,422 |
-$28 |
-2.0 |
| 211 |
Oil & Gas Extraction |
25 |
N/A |
N/A |
N/A |
$529,955 |
N/A |
N/A |
N/A |
$1,652 |
N/A |
N/A |
N/A |
| 212 |
Mining |
12 |
N/A |
N/A |
N/A |
$250,441 |
N/A |
N/A |
N/A |
$1,562 |
N/A |
N/A |
N/A |
| 213 |
Support Activities For Mining |
28 |
24 |
3 |
13.7 |
$391,951 |
$330,907 |
$61,044 |
18.4 |
$1,090 |
$1,046 |
$43 |
4.1 |
| 22 |
Utilities |
45 |
43 |
2 |
3.9 |
$1,000,421 |
$905,537 |
$94,884 |
10.5 |
$1,710 |
$1,608 |
$103 |
6.4 |
| 221 |
Utilities |
45 |
43 |
2 |
3.9 |
$1,000,421 |
$905,537 |
$94,884 |
10.5 |
$1,710 |
$1,608 |
$103 |
6.4 |
| 23 |
Construction |
227 |
207 |
19 |
9.3 |
$2,817,316 |
$2,516,470 |
$300,846 |
12.0 |
$956 |
$934 |
$22 |
2.4 |
| 238 |
Specialty Trade Contractors |
128 |
120 |
8 |
6.4 |
$1,433,359 |
$1,402,114 |
$31,245 |
2.2 |
$861 |
$896 |
-$35 |
-3.9 |
| 31-33 |
Manufacturing |
440 |
430 |
10 |
2.2 |
$7,130,530 |
$6,605,697 |
$524,833 |
7.9 |
$1,248 |
$1,182 |
$66 |
5.6 |
| 42 |
Wholesale Trade |
137 |
134 |
3 |
2.2 |
$1,513,439 |
$1,381,068 |
$132,371 |
9.6 |
$852 |
$795 |
$57 |
7.2 |
| 423 |
Merchant Wholesalers, Durable Goods |
51 |
47 |
3 |
7.1 |
$700,484 |
$580,251 |
$120,233 |
20.7 |
$1,063 |
$943 |
$120 |
12.8 |
| 424 |
Merchant Wholesalers, Nondurable Goods |
86 |
86 |
0 |
-0.4 |
$812,955 |
$800,817 |
$12,138 |
1.5 |
$727 |
$714 |
$14 |
1.9 |
| 44-45 |
Retail Trade |
290 |
290 |
0 |
0.0 |
$2,200,436 |
$2,236,408 |
-$35,972 |
-1.6 |
$584 |
$593 |
-$10 |
-1.6 |
| 441 |
Motor Vehicle & Parts Dealers |
46 |
45 |
1 |
2.2 |
$356,756 |
$371,852 |
-$15,096 |
-4.1 |
$601 |
$640 |
-$39 |
-6.2 |
| 444 |
Building Material & Garden Equipment & Supplies Dealers |
60 |
61 |
-1 |
-1.1 |
$530,395 |
$531,740 |
-$1,345 |
-0.3 |
$676 |
$671 |
$6 |
0.9 |
| 449 |
Furniture, Home Furnishings, Electronics, & Appliance Retailers |
43 |
N/A |
N/A |
N/A |
$320,730 |
N/A |
N/A |
N/A |
$574 |
N/A |
N/A |
N/A |
| 456 |
Health & Personal Care Retailers |
18 |
N/A |
N/A |
N/A |
$180,522 |
N/A |
N/A |
N/A |
$786 |
N/A |
N/A |
N/A |
| 457 |
Gasoline Stations & Fuel Dealers |
28 |
N/A |
N/A |
N/A |
$164,174 |
N/A |
N/A |
N/A |
$456 |
N/A |
N/A |
N/A |
| 459 |
Sporting Goods, Hobby, Musical Instrument, Book, & Miscellaneous Retailers |
10 |
N/A |
N/A |
N/A |
$64,150 |
N/A |
N/A |
N/A |
$478 |
N/A |
N/A |
N/A |
| 48-49 |
Transportation & Warehousing |
145 |
143 |
2 |
1.6 |
$2,360,398 |
$2,239,055 |
$121,343 |
5.4 |
$1,249 |
$1,204 |
$45 |
3.7 |
| 484 |
Truck Transportation |
75 |
75 |
0 |
0.4 |
$1,078,704 |
$984,369 |
$94,335 |
9.6 |
$1,106 |
$1,014 |
$92 |
9.1 |
| 486 |
Pipeline Transportation |
27 |
N/A |
N/A |
N/A |
$571,202 |
N/A |
N/A |
N/A |
$1,627 |
N/A |
N/A |
N/A |
| 51 |
Information |
46 |
43 |
3 |
7.0 |
$855,578 |
$761,975 |
$93,603 |
12.3 |
$1,431 |
$1,363 |
$68 |
5.0 |
| 52 |
Finance & Insurance |
87 |
93 |
-6 |
-6.4 |
$1,307,579 |
$1,289,051 |
$18,528 |
1.4 |
$1,152 |
$1,062 |
$89 |
8.4 |
| 522 |
Credit Intermediation & Related Activities |
59 |
56 |
3 |
5.3 |
$760,623 |
$774,480 |
-$13,857 |
-1.8 |
$986 |
$1,058 |
-$71 |
-6.8 |
| 53 |
Real Estate & Rental & Leasing |
39 |
41 |
-2 |
-5.7 |
$321,906 |
$371,552 |
-$49,646 |
-13.4 |
$640 |
$697 |
-$57 |
-8.1 |
| 54 |
Professional & Technical Services |
82 |
86 |
-4 |
-4.7 |
$1,089,043 |
$1,166,948 |
-$77,905 |
-6.7 |
$1,026 |
$1,048 |
-$22 |
-2.1 |
| 541 |
Professional, Scientific, & Technical Services |
82 |
86 |
-4 |
-4.7 |
$1,089,043 |
$1,166,948 |
-$77,905 |
-6.7 |
$1,026 |
$1,048 |
-$22 |
-2.1 |
| 56 |
Administrative & Waste Services |
33 |
44 |
-11 |
-25.2 |
$208,027 |
$279,245 |
-$71,218 |
-25.5 |
$490 |
$492 |
-$2 |
-0.4 |
| 561 |
Administrative & Support Services |
33 |
44 |
-11 |
-25.2 |
$208,027 |
$279,245 |
-$71,218 |
-25.5 |
$490 |
$492 |
-$2 |
-0.4 |
| 62 |
Health Care & Social Assistance |
534 |
554 |
-20 |
-3.6 |
$6,329,791 |
$6,147,021 |
$182,770 |
3.0 |
$911 |
$854 |
$58 |
6.8 |
| 621 |
Ambulatory Health Care Services |
143 |
145 |
-2 |
-1.6 |
$1,604,359 |
$1,719,969 |
-$115,610 |
-6.7 |
$863 |
$910 |
-$47 |
-5.2 |
| 624 |
Social Assistance |
162 |
167 |
-5 |
-2.8 |
$1,089,388 |
$1,013,087 |
$76,301 |
7.5 |
$516 |
$467 |
$50 |
10.6 |
| 71 |
Arts, Entertainment, & Recreation |
23 |
26 |
-3 |
-10.4 |
$110,474 |
$107,897 |
$2,577 |
2.4 |
$369 |
$323 |
$46 |
14.3 |
| 72 |
Accommodation & Food Services |
247 |
270 |
-23 |
-8.6 |
$1,025,506 |
$1,063,311 |
-$37,805 |
-3.6 |
$320 |
$303 |
$17 |
5.6 |
| 81 |
Other Services, Except Public Administration |
112 |
115 |
-3 |
-2.9 |
$749,527 |
$739,372 |
$10,155 |
1.4 |
$516 |
$495 |
$22 |
4.4 |
| 811 |
Repair & Maintenance |
69 |
68 |
0 |
0.5 |
$567,685 |
$550,040 |
$17,645 |
3.2 |
$636 |
$619 |
$17 |
2.7 |
| 813 |
Membership Associations & Organizations |
26 |
24 |
2 |
9.8 |
$95,672 |
$82,582 |
$13,090 |
15.9 |
$283 |
$268 |
$15 |
5.5 |
|
|
|
|
|
|
|
|
|
|
|
|
|
|
| 0 |
Ownership - Federal Government |
114 |
114 |
0 |
0.3 |
$2,324,581 |
$2,249,446 |
$75,135 |
3.3 |
$1,564 |
$1,518 |
$46 |
3.0 |
| 92 |
Public Administration |
92 |
92 |
0 |
0.0 |
$1,941,300 |
$1,873,454 |
$67,846 |
3.6 |
$1,629 |
$1,572 |
$57 |
3.6 |
|
|
|
|
|
|
|
|
|
|
|
|
|
|
| 0 |
Ownership - State Government |
139 |
153 |
-14 |
-9.0 |
$1,833,429 |
$1,821,677 |
$11,752 |
0.6 |
$1,015 |
$918 |
$97 |
10.5 |
| 92 |
Public Administration |
136 |
150 |
-14 |
-9.1 |
$1,796,478 |
$1,784,567 |
$11,911 |
0.7 |
$1,016 |
$917 |
$99 |
10.8 |
| 922 |
Justice, Public Order, & Safety Activities |
17 |
16 |
1 |
6.3 |
$278,340 |
$253,317 |
$25,023 |
9.9 |
$1,259 |
$1,218 |
$42 |
3.4 |
| 923 |
Administration of Human Resource Programs |
87 |
102 |
-15 |
-14.8 |
$1,096,150 |
$1,113,243 |
-$17,093 |
-1.5 |
$973 |
$842 |
$131 |
15.5 |
| 926 |
Administration of Economic Programs |
18 |
20 |
-2 |
-10.0 |
$241,725 |
$253,410 |
-$11,685 |
-4.6 |
$1,033 |
$975 |
$58 |
6.0 |
|
|
|
|
|
|
|
|
|
|
|
|
|
|
| 0 |
Ownership - Local Government |
553 |
583 |
-29 |
-5.0 |
$5,617,427 |
$5,542,706 |
$74,721 |
1.3 |
$781 |
$732 |
$49 |
6.7 |
| 92 |
Public Administration |
151 |
165 |
-14 |
-8.3 |
$1,263,643 |
$1,223,692 |
$39,951 |
3.3 |
$644 |
$572 |
$72 |
12.6 |
| 921 |
Executive, Legislative & General Government |
136 |
146 |
-10 |
-7.1 |
$1,138,393 |
$1,150,422 |
-$12,029 |
-1.0 |
$644 |
$605 |
$39 |
6.5 |
|
|
|
|
|
|
|
|
|
|
|
|
|
|
| aPreliminary. |
|
|
|
|
|
|
|
|
|
|
|
|
| bNorth American Industry Classification System. |
|
|
|
|
|
|
|
|
|
|
|
|
| Source: Quarterly Census of Employment and Wages, developed through a cooperative program between Research & Planning and the U.S. Bureau of Labor Statistics. |
|
|
|
| Extract Date: October 2022. |
|
|
|
|
|
|
|
|
|
|
|
|
| Prepared by M. Moore, Research & Planning, WY DWS, 10/17/22. |
|
|
|
|
|
|
|
|
|
|
|


 Wyoming at Work