| Table 19: Wyoming Covered Employment, Total Wages, & Average Weekly Wage by Industry (NAICS) for Park County - Second Quarter 2022a |
|
|
|
|
|
|
|
|
|
|
|
|
|
|
|
|
Average Monthly Employment |
Total Wages |
Average Weekly Wage |
|
|
|
Change |
|
Change |
|
Change |
| NAICSb Code |
Ownership and Industry |
2022Q2 |
2021Q2 |
N |
% |
2022Q2 |
2021Q2 |
$ |
% |
2022Q2 |
2021Q2 |
$ |
% |
| 0 |
Ownership - Total |
14,222 |
14,075 |
146 |
1.0 |
$156,796,642 |
$147,221,405 |
$9,575,237 |
6.5 |
$848 |
$805 |
$44 |
5.4 |
| 0 |
Ownership - Private |
10,802 |
10,647 |
155 |
1.5 |
$109,223,912 |
$102,485,329 |
$6,738,583 |
6.6 |
$778 |
$740 |
$37 |
5.0 |
| 11 |
Agriculture, Forestry, Fishing & Hunting |
350 |
356 |
-6 |
-1.8 |
$3,038,655 |
$2,993,722 |
$44,933 |
1.5 |
$668 |
$647 |
$22 |
3.3 |
| 111 |
Crop Production |
103 |
111 |
-8 |
-7.5 |
$790,085 |
$859,496 |
-$69,411 |
-8.1 |
$590 |
$594 |
-$4 |
-0.6 |
| 112 |
Animal Production & Aquaculture |
209 |
207 |
2 |
1.0 |
$1,839,318 |
$1,754,204 |
$85,114 |
4.9 |
$677 |
$652 |
$25 |
3.8 |
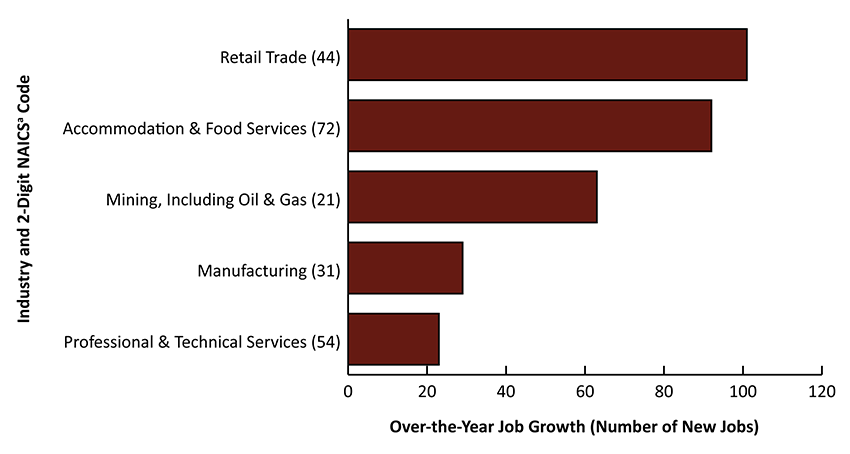
| 21 |
Mining, Including Oil & Gas |
363 |
300 |
63 |
21.0 |
$7,541,871 |
$5,725,698 |
$1,816,173 |
31.7 |
$1,597 |
$1,467 |
$130 |
8.9 |
| 211 |
Oil & Gas Extraction |
171 |
125 |
46 |
36.5 |
$4,151,666 |
$2,770,101 |
$1,381,565 |
49.9 |
$1,871 |
$1,705 |
$167 |
9.8 |
| 212 |
Mining |
28 |
25 |
4 |
14.8 |
$448,460 |
$380,960 |
$67,500 |
17.7 |
$1,218 |
$1,188 |
$30 |
2.5 |
| 213 |
Support Activities For Mining |
164 |
151 |
14 |
9.1 |
$2,941,745 |
$2,574,637 |
$367,108 |
14.3 |
$1,377 |
$1,314 |
$63 |
4.8 |
| 22 |
Utilities |
53 |
50 |
3 |
5.3 |
$1,216,351 |
$1,050,857 |
$165,494 |
15.7 |
$1,765 |
$1,606 |
$159 |
9.9 |
| 221 |
Utilities |
53 |
50 |
3 |
5.3 |
$1,216,351 |
$1,050,857 |
$165,494 |
15.7 |
$1,765 |
$1,606 |
$159 |
9.9 |
| 23 |
Construction |
949 |
1,001 |
-52 |
-5.2 |
$10,937,644 |
$11,277,749 |
-$340,105 |
-3.0 |
$887 |
$866 |
$20 |
2.3 |
| 236 |
Construction of Buildings |
271 |
298 |
-28 |
-9.3 |
$3,210,539 |
$3,364,261 |
-$153,722 |
-4.6 |
$912 |
$867 |
$45 |
5.2 |
| 237 |
Heavy & Civil Engineering Construction |
89 |
114 |
-25 |
-22.2 |
$1,265,689 |
$1,544,630 |
-$278,941 |
-18.1 |
$1,094 |
$1,039 |
$55 |
5.3 |
| 238 |
Specialty Trade Contractors |
589 |
589 |
1 |
0.1 |
$6,461,416 |
$6,368,858 |
$92,558 |
1.5 |
$843 |
$832 |
$11 |
1.3 |
| 31-33 |
Manufacturing |
450 |
421 |
29 |
6.9 |
$5,024,179 |
$4,576,258 |
$447,921 |
9.8 |
$859 |
$837 |
$23 |
2.7 |
| 311 |
Food Manufacturing |
27 |
27 |
0 |
-1.2 |
$177,791 |
$153,894 |
$23,897 |
15.5 |
$513 |
$438 |
$74 |
17.0 |
| 323 |
Printing & Related Support Activities |
3 |
N/A |
N/A |
N/A |
$20,382 |
N/A |
N/A |
N/A |
$523 |
N/A |
N/A |
N/A |
| 327 |
Nonmetallic Mineral Product Manufacturing |
25 |
24 |
1 |
2.8 |
$228,389 |
$243,308 |
-$14,919 |
-6.1 |
$712 |
$780 |
-$68 |
-8.7 |
| 332 |
Fabricated Metal Product Manufacturing |
119 |
111 |
9 |
7.8 |
$1,639,914 |
$1,472,400 |
$167,514 |
11.4 |
$1,057 |
$1,023 |
$34 |
3.3 |
| 333 |
Machinery Manufacturing |
18 |
N/A |
N/A |
N/A |
$146,819 |
N/A |
N/A |
N/A |
$639 |
N/A |
N/A |
N/A |
| 334 |
Computer & Electronic Product Manufacturing |
5 |
6 |
-1 |
-16.7 |
$111,841 |
$124,063 |
-$12,222 |
-9.9 |
$1,721 |
$1,591 |
$130 |
8.2 |
| 337 |
Furniture & Related Product Manufacturing |
14 |
13 |
1 |
10.5 |
$95,530 |
$105,505 |
-$9,975 |
-9.5 |
$525 |
$641 |
-$116 |
-18.1 |
| 42 |
Wholesale Trade |
316 |
328 |
-13 |
-3.9 |
$4,517,129 |
$4,699,966 |
-$182,837 |
-3.9 |
$1,101 |
$1,101 |
$0 |
0.0 |
| 423 |
Merchant Wholesalers, Durable Goods |
159 |
N/A |
N/A |
N/A |
$2,446,127 |
N/A |
N/A |
N/A |
$1,186 |
N/A |
N/A |
N/A |
| 44-45 |
Retail Trade |
1,734 |
1,633 |
101 |
6.2 |
$13,307,562 |
$12,676,239 |
$631,323 |
5.0 |
$590 |
$597 |
-$7 |
-1.1 |
| 441 |
Motor Vehicle & Parts Dealers |
260 |
263 |
-4 |
-1.4 |
$3,175,308 |
$3,290,546 |
-$115,238 |
-3.5 |
$941 |
$961 |
-$21 |
-2.1 |
| 444 |
Building Material & Garden Equipment & Supplies Dealers |
208 |
201 |
7 |
3.6 |
$1,747,203 |
$1,829,900 |
-$82,697 |
-4.5 |
$645 |
$700 |
-$55 |
-7.9 |
| 445 |
Food & Beverage Retailers |
316 |
300 |
16 |
5.3 |
$2,037,444 |
$1,883,932 |
$153,512 |
8.1 |
$496 |
$484 |
$13 |
2.7 |
| 449 |
Furniture, Home Furnishings, Electronics, & Appliance Retailers |
53 |
N/A |
N/A |
N/A |
$528,094 |
N/A |
N/A |
N/A |
$771 |
N/A |
N/A |
N/A |
| 455 |
General Merchandise Retailers |
462 |
N/A |
N/A |
N/A |
$2,966,156 |
N/A |
N/A |
N/A |
$494 |
N/A |
N/A |
N/A |
| 456 |
Health & Personal Care Retailers |
55 |
N/A |
N/A |
N/A |
$493,510 |
N/A |
N/A |
N/A |
$686 |
N/A |
N/A |
N/A |
| 457 |
Gasoline Stations & Fuel Dealers |
119 |
N/A |
N/A |
N/A |
$938,595 |
N/A |
N/A |
N/A |
$605 |
N/A |
N/A |
N/A |
| 458 |
Clothing, Clothing Accessories, Shoe, & Jewelry Retailers |
107 |
N/A |
N/A |
N/A |
$692,399 |
N/A |
N/A |
N/A |
$498 |
N/A |
N/A |
N/A |
| 459 |
Sporting Goods, Hobby, Musical Instrument, Book, & Miscellaneous Retailers |
153 |
N/A |
N/A |
N/A |
$728,853 |
N/A |
N/A |
N/A |
$366 |
N/A |
N/A |
N/A |
| 48-49 |
Transportation & Warehousing |
269 |
313 |
-43 |
-13.9 |
$3,326,848 |
$3,637,960 |
-$311,112 |
-8.6 |
$950 |
$895 |
$55 |
6.2 |
| 484 |
Truck Transportation |
44 |
80 |
-36 |
-45.0 |
$588,255 |
$1,063,285 |
-$475,030 |
-44.7 |
$1,028 |
$1,022 |
$6 |
0.6 |
| 486 |
Pipeline Transportation |
23 |
22 |
1 |
4.5 |
$530,922 |
$435,566 |
$95,356 |
21.9 |
$1,776 |
$1,523 |
$253 |
16.6 |
| 488 |
Support Activities For Transportation |
53 |
44 |
9 |
20.5 |
$617,907 |
$464,458 |
$153,449 |
33.0 |
$897 |
$812 |
$85 |
10.4 |
| 492 |
Couriers & Messengers |
106 |
117 |
-11 |
-9.1 |
$1,167,196 |
$1,256,049 |
-$88,853 |
-7.1 |
$847 |
$828 |
$19 |
2.3 |
| 51 |
Information |
201 |
203 |
-2 |
-0.8 |
$2,058,169 |
$1,815,964 |
$242,205 |
13.3 |
$788 |
$689 |
$98 |
14.3 |
| 512 |
Motion Picture & Sound Recording Industries |
34 |
32 |
2 |
6.2 |
$122,494 |
$83,051 |
$39,443 |
47.5 |
$274 |
$198 |
$77 |
38.9 |
| 513 |
Publishing Industries |
74 |
N/A |
N/A |
N/A |
$593,439 |
N/A |
N/A |
N/A |
$617 |
N/A |
N/A |
N/A |
| 516 |
Broadcasting & Content Providers |
25 |
N/A |
N/A |
N/A |
$289,288 |
N/A |
N/A |
N/A |
$902 |
N/A |
N/A |
N/A |
| 517 |
Telecommunications |
63 |
N/A |
N/A |
N/A |
$884,175 |
N/A |
N/A |
N/A |
$1,080 |
N/A |
N/A |
N/A |
| 518 |
Computing Infrastructure Providers, Data Processing, Web Hosting, & Related Services |
5 |
N/A |
N/A |
N/A |
$168,773 |
N/A |
N/A |
N/A |
$2,597 |
N/A |
N/A |
N/A |
| 52 |
Finance & Insurance |
370 |
374 |
-3 |
-0.9 |
$6,095,556 |
$5,808,840 |
$286,716 |
4.9 |
$1,266 |
$1,196 |
$70 |
5.9 |
| 522 |
Credit Intermediation & Related Activities |
257 |
262 |
-5 |
-2.0 |
$3,847,951 |
$3,793,455 |
$54,496 |
1.4 |
$1,152 |
$1,112 |
$39 |
3.5 |
| 524 |
Insurance Carriers & Related Activities |
76 |
79 |
-3 |
-4.2 |
$1,184,613 |
$1,039,593 |
$145,020 |
13.9 |
$1,199 |
$1,008 |
$191 |
18.9 |
| 53 |
Real Estate & Rental & Leasing |
192 |
191 |
1 |
0.7 |
$2,140,555 |
$1,859,089 |
$281,466 |
15.1 |
$858 |
$750 |
$108 |
14.3 |
| 531 |
Real Estate |
95 |
103 |
-7 |
-7.1 |
$853,116 |
$782,862 |
$70,254 |
9.0 |
$688 |
$587 |
$102 |
17.4 |
| 532 |
Rental & Leasing Services |
97 |
88 |
9 |
9.9 |
$1,287,439 |
$1,076,227 |
$211,212 |
19.6 |
$1,024 |
$941 |
$84 |
8.9 |
| 54 |
Professional & Technical Services |
487 |
464 |
23 |
4.9 |
$8,511,652 |
$6,898,213 |
$1,613,439 |
23.4 |
$1,345 |
$1,144 |
$202 |
17.6 |
| 541 |
Professional, Scientific, & Technical Services |
487 |
464 |
23 |
4.9 |
$8,511,652 |
$6,898,213 |
$1,613,439 |
23.4 |
$1,345 |
$1,144 |
$202 |
17.6 |
| 55 |
Management of Companies & Enterprises |
57 |
50 |
7 |
13.9 |
$971,186 |
$768,199 |
$202,987 |
26.4 |
$1,303 |
$1,174 |
$129 |
11.0 |
| 551 |
Management of Companies & Enterprises |
57 |
50 |
7 |
13.9 |
$971,186 |
$768,199 |
$202,987 |
26.4 |
$1,303 |
$1,174 |
$129 |
11.0 |
| 56 |
Administrative & Waste Services |
352 |
373 |
-20 |
-5.5 |
$3,394,312 |
$2,988,145 |
$406,167 |
13.6 |
$741 |
$617 |
$124 |
20.2 |
| 561 |
Administrative & Support Services |
311 |
328 |
-17 |
-5.2 |
$3,018,564 |
$2,617,691 |
$400,873 |
15.3 |
$747 |
$615 |
$133 |
21.6 |
| 562 |
Waste Management & Remediation Services |
42 |
45 |
-3 |
-7.4 |
$375,748 |
$370,454 |
$5,294 |
1.4 |
$694 |
$633 |
$60 |
9.5 |
| 61 |
Educational Services |
59 |
48 |
11 |
22.1 |
$388,848 |
$361,447 |
$27,401 |
7.6 |
$507 |
$575 |
-$68 |
-11.9 |
| 611 |
Educational Services |
59 |
48 |
11 |
22.1 |
$388,848 |
$361,447 |
$27,401 |
7.6 |
$507 |
$575 |
-$68 |
-11.9 |
| 62 |
Health Care & Social Assistance |
1,559 |
1,599 |
-40 |
-2.5 |
$19,380,578 |
$19,189,900 |
$190,678 |
1.0 |
$956 |
$923 |
$33 |
3.6 |
| 621 |
Ambulatory Health Care Services |
669 |
657 |
11 |
1.7 |
$9,642,374 |
$9,020,965 |
$621,409 |
6.9 |
$1,109 |
$1,056 |
$54 |
5.1 |
| 624 |
Social Assistance |
357 |
375 |
-18 |
-4.8 |
$2,288,979 |
$2,258,210 |
$30,769 |
1.4 |
$493 |
$463 |
$30 |
6.5 |
| 71 |
Arts, Entertainment, & Recreation |
325 |
337 |
-12 |
-3.6 |
$2,164,687 |
$2,039,006 |
$125,681 |
6.2 |
$512 |
$465 |
$47 |
10.1 |
| 713 |
Amusements, Gambling, & Recreation |
123 |
141 |
-18 |
-13.0 |
$557,039 |
$602,843 |
-$45,804 |
-7.6 |
$348 |
$328 |
$20 |
6.2 |
| 72 |
Accommodation & Food Services |
2,430 |
2,338 |
92 |
3.9 |
$12,724,025 |
$11,713,710 |
$1,010,315 |
8.6 |
$403 |
$385 |
$17 |
4.5 |
| 721 |
Accommodation |
1,359 |
1,258 |
101 |
8.0 |
$7,790,719 |
$7,122,898 |
$667,821 |
9.4 |
$441 |
$435 |
$6 |
1.3 |
| 722 |
Food Services & Drinking Places |
1,071 |
1,080 |
-9 |
-0.8 |
$4,933,306 |
$4,590,812 |
$342,494 |
7.5 |
$354 |
$327 |
$27 |
8.4 |
| 81 |
Other Services, Except Public Administration |
283 |
266 |
16 |
6.1 |
$2,425,966 |
$2,379,789 |
$46,177 |
1.9 |
$660 |
$687 |
-$27 |
-4.0 |
| 811 |
Repair & Maintenance |
128 |
119 |
10 |
8.1 |
$1,390,460 |
$1,375,415 |
$15,045 |
1.1 |
$833 |
$892 |
-$58 |
-6.5 |
| 812 |
Personal & Laundry Services |
70 |
60 |
10 |
16.7 |
$410,413 |
$359,924 |
$50,489 |
14.0 |
$451 |
$461 |
-$10 |
-2.3 |
| 813 |
Membership Associations & Organizations |
75 |
75 |
0 |
0.4 |
$550,303 |
$571,176 |
-$20,873 |
-3.7 |
$564 |
$588 |
-$24 |
-4.1 |
| 814 |
Private Households |
9 |
13 |
-4 |
-28.2 |
$74,790 |
$73,274 |
$1,516 |
2.1 |
$617 |
$434 |
$183 |
42.2 |
|
|
|
|
|
|
|
|
|
|
|
|
|
|
| 0 |
Ownership - Federal Government |
847 |
823 |
24 |
3.0 |
$14,434,917 |
$13,193,445 |
$1,241,472 |
9.4 |
$1,311 |
$1,234 |
$77 |
6.3 |
| 48-49 |
Transportation & Warehousing |
53 |
54 |
-1 |
-1.8 |
$845,829 |
$820,156 |
$25,673 |
3.1 |
$1,220 |
$1,161 |
$59 |
5.1 |
| 491 |
Postal Service |
53 |
54 |
-1 |
-1.8 |
$845,829 |
$820,156 |
$25,673 |
3.1 |
$1,220 |
$1,161 |
$59 |
5.1 |
| 92 |
Public Administration |
188 |
180 |
8 |
4.3 |
$4,108,718 |
$3,203,846 |
$904,872 |
28.2 |
$1,684 |
$1,369 |
$315 |
23.0 |
| 924 |
Administration of Environmental Programs |
143 |
148 |
-5 |
-3.2 |
$3,136,513 |
$2,737,357 |
$399,156 |
14.6 |
$1,683 |
$1,423 |
$261 |
18.3 |
| 926 |
Administration of Economic Programs |
39 |
25 |
14 |
57.3 |
$875,987 |
$320,147 |
$555,840 |
173.6 |
$1,713 |
$985 |
$728 |
73.9 |
|
|
|
|
|
|
|
|
|
|
|
|
|
|
| 0 |
Ownership - State Government |
197 |
205 |
-8 |
-4.1 |
$2,744,055 |
$2,677,854 |
$66,201 |
2.5 |
$1,073 |
$1,005 |
$68 |
6.8 |
| 92 |
Public Administration |
177 |
182 |
-5 |
-2.6 |
$2,391,873 |
$2,312,790 |
$79,083 |
3.4 |
$1,038 |
$978 |
$60 |
6.1 |
| 922 |
Justice, Public Order, & Safety Activities |
22 |
25 |
-3 |
-13.3 |
$407,837 |
$386,831 |
$21,006 |
5.4 |
$1,448 |
$1,190 |
$257 |
21.6 |
| 923 |
Administration of Human Resource Programs |
49 |
50 |
-1 |
-2.0 |
$562,943 |
$579,449 |
-$16,506 |
-2.8 |
$878 |
$886 |
-$8 |
-0.9 |
| 924 |
Administration of Environmental Programs |
44 |
47 |
-3 |
-6.4 |
$632,347 |
$648,917 |
-$16,570 |
-2.6 |
$1,106 |
$1,062 |
$43 |
4.1 |
| 926 |
Administration of Economic Programs |
59 |
57 |
3 |
4.7 |
$754,211 |
$663,301 |
$90,910 |
13.7 |
$978 |
$900 |
$78 |
8.6 |
|
|
|
|
|
|
|
|
|
|
|
|
|
|
| 0 |
Ownership - Local Government |
2,376 |
2,401 |
-24 |
-1.0 |
$30,393,758 |
$28,864,777 |
$1,528,981 |
5.3 |
$984 |
$925 |
$59 |
6.4 |
| 22 |
Utilities |
33 |
35 |
-1 |
-3.9 |
$378,945 |
$375,555 |
$3,390 |
0.9 |
$875 |
$833 |
$41 |
5.0 |
| 221 |
Utilities |
33 |
35 |
-1 |
-3.9 |
$378,945 |
$375,555 |
$3,390 |
0.9 |
$875 |
$833 |
$41 |
5.0 |
| 51 |
Information |
32 |
34 |
-2 |
-6.8 |
$320,077 |
$310,974 |
$9,103 |
2.9 |
$769 |
$697 |
$73 |
10.4 |
| 519 |
Other Information Services |
32 |
34 |
-2 |
-6.8 |
$320,077 |
$310,974 |
$9,103 |
2.9 |
$769 |
$697 |
$73 |
10.4 |
| 61 |
Educational Services |
1,141 |
1,143 |
-2 |
-0.2 |
$12,834,251 |
$13,024,997 |
-$190,746 |
-1.5 |
$865 |
$877 |
-$11 |
-1.3 |
| 611 |
Educational Services |
1,141 |
1,143 |
-2 |
-0.2 |
$12,834,251 |
$13,024,997 |
-$190,746 |
-1.5 |
$865 |
$877 |
-$11 |
-1.3 |
| 81 |
Other Services, Except Public Administration |
16 |
16 |
0 |
2.1 |
$132,017 |
$127,347 |
$4,670 |
3.7 |
$622 |
$612 |
$10 |
1.6 |
| 812 |
Personal & Laundry Services |
16 |
16 |
0 |
2.1 |
$132,017 |
$127,347 |
$4,670 |
3.7 |
$622 |
$612 |
$10 |
1.6 |
| 92 |
Public Administration |
486 |
502 |
-17 |
-3.3 |
$4,978,763 |
$5,106,209 |
-$127,446 |
-2.5 |
$789 |
$782 |
$7 |
0.8 |
| 921 |
Executive, Legislative & General Government |
443 |
455 |
-12 |
-2.6 |
$4,492,794 |
$4,613,494 |
-$120,700 |
-2.6 |
$781 |
$781 |
$0 |
0.0 |
| 924 |
Administration of Environmental Programs |
21 |
24 |
-3 |
-12.5 |
$101,972 |
$99,245 |
$2,727 |
2.7 |
$374 |
$318 |
$55 |
17.4 |
|
|
|
|
|
|
|
|
|
|
|
|
|
|
| N/A = not available due to NAICS code changes for 2022 or confidentiality. |
|
|
|
|
|
|
|
|
|
|
| aPreliminary. |
|
|
|
|
|
|
|
|
|
|
|
|
| bNorth American Industry Classification System. |
|
|
|
|
|
|
|
|
|
|
|
|
| Source: Quarterly Census of Employment and Wages, developed through a cooperative program between Research & Planning and the U.S. Bureau of Labor Statistics. |
|
|
|
| Extract Date: October 2022. |
|
|
|
|
|
|
|
|
|
|
|
|
| Prepared by M. Moore, Research & Planning, WY DWS, 10/17/22. |
|
|
|
|
|
|
|
|
|
|
|


 Wyoming at Work