| Table 17: Wyoming Covered Employment, Total Wages, & Average Weekly Wage by Industry (NAICS) for Natrona County - Second Quarter 2022a |
|
|
|
|
|
|
|
|
|
|
|
|
|
|
|
|
Average Monthly Employment |
Total Wages |
Average Weekly Wage |
|
|
|
Change |
|
Change |
|
Change |
| NAICSb Code |
Ownership and Industry |
2022Q2 |
2021Q2 |
N |
% |
2022Q2 |
2021Q2 |
$ |
% |
2022Q2 |
2021Q2 |
$ |
% |
| 0 |
Ownership - Total |
38,028 |
36,914 |
1,114 |
3.0 |
$509,617,766 |
$456,510,706 |
$53,107,060 |
11.6 |
$1,031 |
$951 |
$80 |
8.4 |
| 0 |
Ownership - Private |
32,382 |
31,271 |
1,111 |
3.6 |
$433,636,476 |
$381,107,543 |
$52,528,933 |
13.8 |
$1,030 |
$937 |
$93 |
9.9 |
| 11 |
Agriculture, Forestry, Fishing & Hunting |
119 |
129 |
-9 |
-7.3 |
$997,605 |
$1,011,086 |
-$13,481 |
-1.3 |
$643 |
$604 |
$39 |
6.4 |
| 112 |
Animal Production & Aquaculture |
88 |
90 |
-2 |
-2.6 |
$726,884 |
$737,454 |
-$10,570 |
-1.4 |
$635 |
$628 |
$7 |
1.2 |
| 21 |
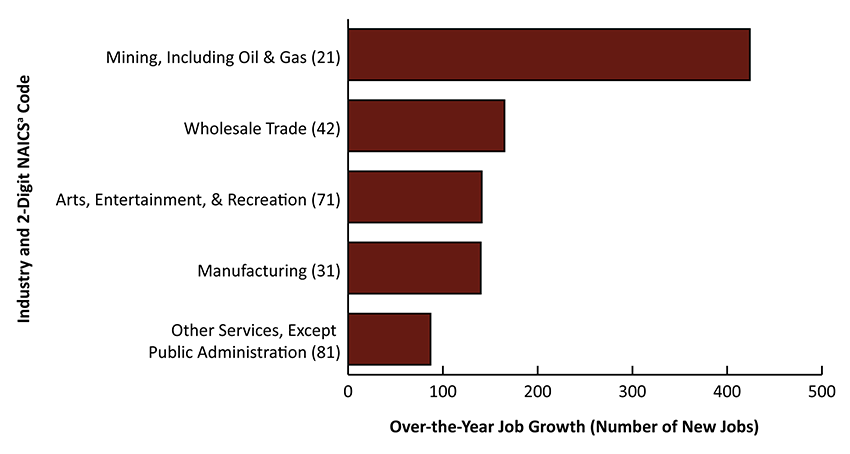
Mining, Including Oil & Gas |
1,851 |
1,427 |
424 |
29.7 |
$46,720,700 |
$30,947,406 |
$15,773,294 |
51.0 |
$1,942 |
$1,668 |
$274 |
16.4 |
| 211 |
Oil & Gas Extraction |
388 |
315 |
73 |
23.3 |
$9,672,740 |
$7,076,031 |
$2,596,709 |
36.7 |
$1,918 |
$1,730 |
$188 |
10.9 |
| 212 |
Mining |
108 |
111 |
-2 |
-2.1 |
$1,930,471 |
$1,969,815 |
-$39,344 |
-2.0 |
$1,371 |
$1,369 |
$2 |
0.1 |
| 213 |
Support Activities For Mining |
1,355 |
1,002 |
353 |
35.2 |
$35,117,489 |
$21,901,560 |
$13,215,929 |
60.3 |
$1,994 |
$1,681 |
$313 |
18.6 |
| 22 |
Utilities |
122 |
133 |
-11 |
-8.5 |
$3,245,379 |
$3,059,950 |
$185,429 |
6.1 |
$2,046 |
$1,765 |
$281 |
15.9 |
| 221 |
Utilities |
122 |
133 |
-11 |
-8.5 |
$3,245,379 |
$3,059,950 |
$185,429 |
6.1 |
$2,046 |
$1,765 |
$281 |
15.9 |
| 23 |
Construction |
2,870 |
2,860 |
11 |
0.4 |
$42,866,434 |
$38,671,970 |
$4,194,464 |
10.8 |
$1,149 |
$1,040 |
$109 |
10.4 |
| 236 |
Construction of Buildings |
324 |
342 |
-17 |
-5.1 |
$3,555,942 |
$3,577,447 |
-$21,505 |
-0.6 |
$843 |
$805 |
$38 |
4.7 |
| 237 |
Heavy & Civil Engineering Construction |
574 |
550 |
24 |
4.4 |
$10,391,966 |
$8,924,142 |
$1,467,824 |
16.4 |
$1,392 |
$1,247 |
$144 |
11.6 |
| 238 |
Specialty Trade Contractors |
1,972 |
1,968 |
4 |
0.2 |
$28,918,526 |
$26,170,381 |
$2,748,145 |
10.5 |
$1,128 |
$1,023 |
$105 |
10.3 |
| 31-33 |
Manufacturing |
1,746 |
1,606 |
140 |
8.7 |
$28,150,462 |
$24,085,174 |
$4,065,288 |
16.9 |
$1,240 |
$1,154 |
$87 |
7.5 |
| 311 |
Food Manufacturing |
43 |
52 |
-9 |
-16.7 |
$248,114 |
$245,431 |
$2,683 |
1.1 |
$440 |
$363 |
$77 |
21.3 |
| 312 |
Beverage & Tobacco Product Manufacturing |
34 |
31 |
3 |
9.8 |
$180,984 |
$178,942 |
$2,042 |
1.1 |
$413 |
$449 |
-$35 |
-7.9 |
| 314 |
Textile Product Mills |
21 |
30 |
-9 |
-30.0 |
$121,046 |
$127,613 |
-$6,567 |
-5.1 |
$443 |
$327 |
$116 |
35.5 |
| 321 |
Wood Product Manufacturing |
27 |
25 |
3 |
10.8 |
$488,868 |
$339,302 |
$149,566 |
44.1 |
$1,376 |
$1,058 |
$318 |
30.1 |
| 323 |
Printing & Related Support Activities |
47 |
46 |
1 |
2.9 |
$434,175 |
$389,604 |
$44,571 |
11.4 |
$706 |
$652 |
$54 |
8.3 |
| 325 |
Chemical Manufacturing |
80 |
N/A |
N/A |
N/A |
$980,335 |
N/A |
N/A |
N/A |
$943 |
N/A |
N/A |
N/A |
| 326 |
Plastics & Rubber Products Manufacturing |
154 |
140 |
14 |
9.8 |
$1,999,372 |
$1,821,854 |
$177,518 |
9.7 |
$1,001 |
$1,001 |
$0 |
0.0 |
| 327 |
Nonmetallic Mineral Product Manufacturing |
51 |
55 |
-4 |
-7.9 |
$862,603 |
$891,604 |
-$29,001 |
-3.3 |
$1,310 |
$1,247 |
$63 |
5.0 |
| 332 |
Fabricated Metal Product Manufacturing |
446 |
338 |
108 |
31.9 |
$7,565,395 |
$5,167,257 |
$2,398,138 |
46.4 |
$1,304 |
$1,175 |
$129 |
11.0 |
| 333 |
Machinery Manufacturing |
177 |
193 |
-16 |
-8.1 |
$2,795,232 |
$3,230,513 |
-$435,281 |
-13.5 |
$1,215 |
$1,290 |
-$75 |
-5.8 |
| 335 |
Electrical Equipment, Appliance, & Component Manufacturing |
199 |
187 |
12 |
6.4 |
$3,787,242 |
$2,895,807 |
$891,435 |
30.8 |
$1,464 |
$1,191 |
$273 |
22.9 |
| 336 |
Transportation Equipment Manufacturing |
149 |
N/A |
N/A |
N/A |
$2,445,567 |
N/A |
N/A |
N/A |
$1,263 |
N/A |
N/A |
N/A |
| 339 |
Miscellaneous Manufacturing |
57 |
45 |
12 |
26.5 |
$590,212 |
$491,143 |
$99,069 |
20.2 |
$792 |
$833 |
-$42 |
-5.0 |
| 42 |
Wholesale Trade |
2,068 |
1,903 |
165 |
8.7 |
$37,199,004 |
$32,106,646 |
$5,092,358 |
15.9 |
$1,383 |
$1,298 |
$86 |
6.6 |
| 423 |
Merchant Wholesalers, Durable Goods |
1,613 |
1,494 |
118 |
7.9 |
$29,935,262 |
$26,207,811 |
$3,727,451 |
14.2 |
$1,428 |
$1,349 |
$79 |
5.8 |
| 424 |
Merchant Wholesalers, Nondurable Goods |
429 |
387 |
42 |
10.8 |
$6,778,916 |
$5,503,287 |
$1,275,629 |
23.2 |
$1,215 |
$1,093 |
$122 |
11.1 |
| 425 |
Electronic Markets & Agents & Brokers |
26 |
21 |
5 |
23.4 |
$484,826 |
$395,548 |
$89,278 |
22.6 |
$1,416 |
$1,426 |
-$10 |
-0.7 |
| 44-45 |
Retail Trade |
4,688 |
4,633 |
55 |
1.2 |
$40,990,561 |
$39,568,943 |
$1,421,618 |
3.6 |
$673 |
$657 |
$16 |
2.4 |
| 441 |
Motor Vehicle & Parts Dealers |
697 |
709 |
-12 |
-1.6 |
$10,811,835 |
$11,137,741 |
-$325,906 |
-2.9 |
$1,193 |
$1,208 |
-$16 |
-1.3 |
| 444 |
Building Material & Garden Equipment & Supplies Dealers |
657 |
N/A |
N/A |
N/A |
$6,127,584 |
N/A |
N/A |
N/A |
$717 |
N/A |
N/A |
N/A |
| 445 |
Food & Beverage Retailers |
533 |
514 |
20 |
3.8 |
$3,910,762 |
$3,452,295 |
$458,467 |
13.3 |
$564 |
$517 |
$47 |
9.1 |
| 449 |
Furniture, Home Furnishings, Electronics, & Appliance Retailers |
291 |
N/A |
N/A |
N/A |
$3,013,342 |
N/A |
N/A |
N/A |
$797 |
N/A |
N/A |
N/A |
| 455 |
General Merchandise Retailers |
1,186 |
N/A |
N/A |
N/A |
$7,959,920 |
N/A |
N/A |
N/A |
$516 |
N/A |
N/A |
N/A |
| 456 |
Health & Personal Care Retailers |
205 |
N/A |
N/A |
N/A |
$1,778,559 |
N/A |
N/A |
N/A |
$667 |
N/A |
N/A |
N/A |
| 457 |
Gasoline Stations & Fuel Dealers |
385 |
N/A |
N/A |
N/A |
$2,972,192 |
N/A |
N/A |
N/A |
$594 |
N/A |
N/A |
N/A |
| 458 |
Clothing, Clothing Accessories, Shoe, & Jewelry Retailers |
223 |
N/A |
N/A |
N/A |
$1,073,370 |
N/A |
N/A |
N/A |
$370 |
N/A |
N/A |
N/A |
| 459 |
Sporting Goods, Hobby, Musical Instrument, Book, & Miscellaneous Retailers |
510 |
N/A |
N/A |
N/A |
$3,342,997 |
N/A |
N/A |
N/A |
$504 |
N/A |
N/A |
N/A |
| 48-49 |
Transportation & Warehousing |
1,567 |
1,632 |
-65 |
-4.0 |
$25,200,880 |
$24,066,389 |
$1,134,491 |
4.7 |
$1,237 |
$1,134 |
$102 |
9.0 |
| 481 |
Air Transportation |
54 |
80 |
-25 |
-31.8 |
$689,827 |
$912,701 |
-$222,874 |
-24.4 |
$977 |
$881 |
$95 |
10.8 |
| 484 |
Truck Transportation |
694 |
686 |
8 |
1.2 |
$11,665,390 |
$9,999,801 |
$1,665,589 |
16.7 |
$1,292 |
$1,121 |
$171 |
15.3 |
| 485 |
Transit & Ground Passenger Transportation |
18 |
43 |
-25 |
-57.8 |
$79,542 |
$373,816 |
-$294,274 |
-78.7 |
$340 |
$674 |
-$334 |
-49.6 |
| 486 |
Pipeline Transportation |
134 |
228 |
-94 |
-41.1 |
$3,661,589 |
$5,582,371 |
-$1,920,782 |
-34.4 |
$2,102 |
$1,886 |
$216 |
11.4 |
| 488 |
Support Activities For Transportation |
303 |
241 |
62 |
25.8 |
$4,844,171 |
$3,313,143 |
$1,531,028 |
46.2 |
$1,231 |
$1,059 |
$172 |
16.3 |
| 492 |
Couriers & Messengers |
356 |
347 |
9 |
2.5 |
$4,200,762 |
$3,822,219 |
$378,543 |
9.9 |
$908 |
$847 |
$61 |
7.2 |
| 51 |
Information |
334 |
312 |
23 |
7.3 |
$3,938,650 |
$3,679,407 |
$259,243 |
7.0 |
$906 |
$908 |
-$2 |
-0.2 |
| 513 |
Publishing Industries |
52 |
N/A |
N/A |
N/A |
$669,031 |
N/A |
N/A |
N/A |
$983 |
N/A |
N/A |
N/A |
| 516 |
Broadcasting & Content Providers |
79 |
N/A |
N/A |
N/A |
$853,354 |
N/A |
N/A |
N/A |
$834 |
N/A |
N/A |
N/A |
| 517 |
Telecommunications |
127 |
119 |
8 |
7.0 |
$1,990,671 |
$1,818,756 |
$171,915 |
9.5 |
$1,206 |
$1,179 |
$27 |
2.3 |
| 518 |
Computing Infrastructure Providers, Data Processing, Web Hosting, & Related Services |
4 |
N/A |
N/A |
N/A |
$89,913 |
N/A |
N/A |
N/A |
$1,597 |
N/A |
N/A |
N/A |
| 52 |
Finance & Insurance |
1,046 |
1,022 |
23 |
2.3 |
$18,097,655 |
$17,619,971 |
$477,684 |
2.7 |
$1,331 |
$1,326 |
$6 |
0.4 |
| 522 |
Credit Intermediation & Related Activities |
629 |
640 |
-11 |
-1.8 |
$9,752,334 |
$10,132,175 |
-$379,841 |
-3.7 |
$1,193 |
$1,218 |
-$25 |
-2.0 |
| 523 |
Securities, Commodity Contracts, & Other Financial Investments & Related Activities |
97 |
N/A |
N/A |
N/A |
$3,648,087 |
N/A |
N/A |
N/A |
$2,883 |
N/A |
N/A |
N/A |
| 524 |
Insurance Carriers & Related Activities |
317 |
282 |
35 |
12.3 |
$4,661,570 |
$4,184,125 |
$477,445 |
11.4 |
$1,132 |
$1,141 |
-$9 |
-0.8 |
| 525 |
Funds, Trusts, & Other Financial Vehicles |
3 |
N/A |
N/A |
N/A |
$35,664 |
N/A |
N/A |
N/A |
$914 |
N/A |
N/A |
N/A |
| 53 |
Real Estate & Rental & Leasing |
923 |
848 |
76 |
8.9 |
$13,383,347 |
$11,085,340 |
$2,298,007 |
20.7 |
$1,115 |
$1,006 |
$109 |
10.8 |
| 532 |
Rental & Leasing Services |
560 |
480 |
80 |
16.7 |
$8,890,666 |
$6,702,184 |
$2,188,482 |
32.7 |
$1,222 |
$1,075 |
$147 |
13.7 |
| 54 |
Professional & Technical Services |
1,383 |
1,330 |
53 |
4.0 |
$24,735,530 |
$21,948,296 |
$2,787,234 |
12.7 |
$1,375 |
$1,269 |
$106 |
8.4 |
| 541 |
Professional, Scientific, & Technical Services |
1,383 |
1,330 |
53 |
4.0 |
$24,735,530 |
$21,948,296 |
$2,787,234 |
12.7 |
$1,375 |
$1,269 |
$106 |
8.4 |
| 55 |
Management of Companies & Enterprises |
79 |
106 |
-27 |
-25.4 |
$1,750,384 |
$3,056,916 |
-$1,306,532 |
-42.7 |
$1,697 |
$2,211 |
-$514 |
-23.3 |
| 551 |
Management of Companies & Enterprises |
79 |
106 |
-27 |
-25.4 |
$1,750,384 |
$3,056,916 |
-$1,306,532 |
-42.7 |
$1,697 |
$2,211 |
-$514 |
-23.3 |
| 56 |
Administrative & Waste Services |
1,388 |
1,306 |
81 |
6.2 |
$15,607,109 |
$11,237,761 |
$4,369,348 |
38.9 |
$865 |
$662 |
$203 |
30.7 |
| 561 |
Administrative & Support Services |
1,311 |
1,232 |
79 |
6.4 |
$14,507,016 |
$10,278,759 |
$4,228,257 |
41.1 |
$851 |
$642 |
$209 |
32.6 |
| 562 |
Waste Management & Remediation Services |
77 |
75 |
2 |
2.7 |
$1,100,093 |
$959,002 |
$141,091 |
14.7 |
$1,104 |
$988 |
$116 |
11.7 |
| 61 |
Educational Services |
237 |
215 |
22 |
10.2 |
$1,551,491 |
$1,139,739 |
$411,752 |
36.1 |
$504 |
$408 |
$96 |
23.5 |
| 611 |
Educational Services |
237 |
215 |
22 |
10.2 |
$1,551,491 |
$1,139,739 |
$411,752 |
36.1 |
$504 |
$408 |
$96 |
23.5 |
| 62 |
Health Care & Social Assistance |
5,787 |
5,838 |
-51 |
-0.9 |
$86,121,642 |
$80,175,129 |
$5,946,513 |
7.4 |
$1,145 |
$1,056 |
$88 |
8.4 |
| 621 |
Ambulatory Health Care Services |
2,262 |
2,215 |
47 |
2.1 |
$41,590,110 |
$41,325,952 |
$264,158 |
0.6 |
$1,414 |
$1,435 |
-$21 |
-1.5 |
| 622 |
Hospitals |
1,450 |
1,572 |
-122 |
-7.8 |
$27,266,122 |
$22,797,842 |
$4,468,280 |
19.6 |
$1,447 |
$1,116 |
$331 |
29.7 |
| 623 |
Nursing & Residential Care Facilities |
848 |
839 |
10 |
1.2 |
$8,850,889 |
$8,185,588 |
$665,301 |
8.1 |
$803 |
$751 |
$52 |
6.9 |
| 624 |
Social Assistance |
1,227 |
1,213 |
14 |
1.1 |
$8,414,521 |
$7,865,747 |
$548,774 |
7.0 |
$528 |
$499 |
$29 |
5.8 |
| 71 |
Arts, Entertainment, & Recreation |
749 |
608 |
141 |
23.2 |
$3,676,657 |
$2,776,872 |
$899,785 |
32.4 |
$377 |
$351 |
$26 |
7.5 |
| 711 |
Performing Arts & Spectator Sports |
192 |
168 |
24 |
14.3 |
$661,343 |
$539,012 |
$122,331 |
22.7 |
$265 |
$247 |
$18 |
7.4 |
| 712 |
Museums, Historical Sites, Zoos, & Parks |
29 |
30 |
-1 |
-4.4 |
$253,540 |
$283,996 |
-$30,456 |
-10.7 |
$680 |
$728 |
-$48 |
-6.6 |
| 713 |
Amusements, Gambling, & Recreation |
529 |
410 |
118 |
28.8 |
$2,761,774 |
$1,953,864 |
$807,910 |
41.3 |
$402 |
$366 |
$36 |
9.7 |
| 72 |
Accommodation & Food Services |
4,066 |
4,082 |
-15 |
-0.4 |
$22,765,554 |
$20,745,426 |
$2,020,128 |
9.7 |
$431 |
$391 |
$40 |
10.2 |
| 721 |
Accommodation |
736 |
735 |
1 |
0.1 |
$5,123,918 |
$3,985,374 |
$1,138,544 |
28.6 |
$536 |
$417 |
$119 |
28.5 |
| 722 |
Food Services & Drinking Places |
3,331 |
3,347 |
-16 |
-0.5 |
$17,641,636 |
$16,760,052 |
$881,584 |
5.3 |
$407 |
$385 |
$22 |
5.8 |
| 81 |
Other Services, Except Public Administration |
1,347 |
1,260 |
87 |
6.9 |
$16,388,332 |
$13,779,776 |
$2,608,556 |
18.9 |
$936 |
$841 |
$95 |
11.2 |
| 811 |
Repair & Maintenance |
719 |
660 |
59 |
9.0 |
$11,103,288 |
$9,116,058 |
$1,987,230 |
21.8 |
$1,188 |
$1,063 |
$125 |
11.7 |
| 812 |
Personal & Laundry Services |
267 |
288 |
-22 |
-7.5 |
$2,155,013 |
$2,106,032 |
$48,981 |
2.3 |
$622 |
$562 |
$60 |
10.6 |
| 813 |
Membership Associations & Organizations |
347 |
296 |
50 |
17.0 |
$3,081,465 |
$2,506,020 |
$575,445 |
23.0 |
$684 |
$651 |
$33 |
5.1 |
| 814 |
Private Households |
14 |
15 |
-1 |
-6.5 |
$48,566 |
$51,666 |
-$3,100 |
-6.0 |
$261 |
$259 |
$1 |
0.6 |
| 99 |
Unclassified |
10 |
21 |
-11 |
-51.6 |
$249,100 |
$345,346 |
-$96,246 |
-27.9 |
$1,855 |
$1,245 |
$610 |
48.9 |
|
|
|
|
|
|
|
|
|
|
|
|
|
|
| 0 |
Ownership - Federal Government |
657 |
664 |
-6 |
-1.0 |
$14,373,381 |
$13,825,682 |
$547,699 |
4.0 |
$1,682 |
$1,602 |
$80 |
5.0 |
| 48-49 |
Transportation & Warehousing |
181 |
177 |
4 |
2.3 |
$2,946,437 |
$2,890,202 |
$56,235 |
1.9 |
$1,254 |
$1,258 |
-$4 |
-0.3 |
| 491 |
Postal Service |
181 |
177 |
4 |
2.3 |
$2,946,437 |
$2,890,202 |
$56,235 |
1.9 |
$1,254 |
$1,258 |
-$4 |
-0.3 |
| 92 |
Public Administration |
412 |
421 |
-9 |
-2.1 |
$9,622,341 |
$9,222,159 |
$400,182 |
4.3 |
$1,797 |
$1,685 |
$112 |
6.6 |
| 922 |
Justice, Public Order, & Safety Activities |
46 |
44 |
2 |
4.5 |
$1,331,961 |
$1,246,406 |
$85,555 |
6.9 |
$2,211 |
$2,163 |
$49 |
2.3 |
| 924 |
Administration of Environmental Programs |
238 |
236 |
2 |
0.8 |
$5,605,374 |
$5,344,288 |
$261,086 |
4.9 |
$1,809 |
$1,740 |
$70 |
4.0 |
| 926 |
Administration of Economic Programs |
97 |
110 |
-13 |
-11.5 |
$2,062,489 |
$2,096,000 |
-$33,511 |
-1.6 |
$1,630 |
$1,466 |
$164 |
11.2 |
|
|
|
|
|
|
|
|
|
|
|
|
|
|
| 0 |
Ownership - State Government |
705 |
709 |
-3 |
-0.5 |
$10,427,020 |
$10,295,719 |
$131,301 |
1.3 |
$1,137 |
$1,118 |
$20 |
1.8 |
| 61 |
Educational Services |
62 |
61 |
0 |
0.6 |
$1,214,091 |
$1,214,299 |
-$208 |
0.0 |
$1,514 |
$1,523 |
-$9 |
-0.6 |
| 611 |
Educational Services |
62 |
61 |
0 |
0.6 |
$1,214,091 |
$1,214,299 |
-$208 |
0.0 |
$1,514 |
$1,523 |
-$9 |
-0.6 |
| 92 |
Public Administration |
568 |
573 |
-5 |
-0.8 |
$7,898,375 |
$7,774,548 |
$123,827 |
1.6 |
$1,070 |
$1,044 |
$25 |
2.4 |
| 921 |
Executive, Legislative & General Government |
8 |
7 |
1 |
19.0 |
$113,392 |
$95,002 |
$18,390 |
19.4 |
$1,047 |
$1,044 |
$3 |
0.3 |
| 922 |
Justice, Public Order, & Safety Activities |
107 |
104 |
2 |
2.2 |
$1,790,478 |
$1,632,540 |
$157,938 |
9.7 |
$1,291 |
$1,204 |
$87 |
7.3 |
| 923 |
Administration of Human Resource Programs |
224 |
225 |
-1 |
-0.3 |
$2,776,309 |
$2,802,671 |
-$26,362 |
-0.9 |
$953 |
$960 |
-$6 |
-0.6 |
| 924 |
Administration of Environmental Programs |
97 |
103 |
-7 |
-6.4 |
$1,428,646 |
$1,488,138 |
-$59,492 |
-4.0 |
$1,137 |
$1,108 |
$29 |
2.6 |
| 926 |
Administration of Economic Programs |
121 |
124 |
-3 |
-2.2 |
$1,660,204 |
$1,647,956 |
$12,248 |
0.7 |
$1,053 |
$1,022 |
$30 |
3.0 |
|
|
|
|
|
|
|
|
|
|
|
|
|
|
| 0 |
Ownership - Local Government |
4,284 |
4,270 |
13 |
0.3 |
$51,180,889 |
$51,281,762 |
-$100,873 |
-0.2 |
$919 |
$924 |
-$5 |
-0.5 |
| 22 |
Utilities |
18 |
18 |
0 |
-1.8 |
$182,528 |
$181,163 |
$1,365 |
0.8 |
$795 |
$774 |
$20 |
2.6 |
| 221 |
Utilities |
18 |
18 |
0 |
-1.8 |
$182,528 |
$181,163 |
$1,365 |
0.8 |
$795 |
$774 |
$20 |
2.6 |
| 92 |
Public Administration |
1,186 |
1,152 |
35 |
3.0 |
$14,680,156 |
$15,354,101 |
-$673,945 |
-4.4 |
$952 |
$1,026 |
-$74 |
-7.2 |
| 921 |
Executive, Legislative & General Government |
1,102 |
1,040 |
62 |
5.9 |
$13,473,961 |
$14,181,447 |
-$707,486 |
-5.0 |
$941 |
$1,049 |
-$108 |
-10.3 |
|
|
|
|
|
|
|
|
|
|
|
|
|
|
| N/A = not available due to NAICS code changes for 2022 or confidentiality. |
|
|
|
|
|
|
|
|
|
|
| aPreliminary. |
|
|
|
|
|
|
|
|
|
|
|
|
| bNorth American Industry Classification System. |
|
|
|
|
|
|
|
|
|
|
|
|
| Source: Quarterly Census of Employment and Wages, developed through a cooperative program between Research & Planning and the U.S. Bureau of Labor Statistics. |
|
|
|
| Extract Date: October 2022. |
|
|
|
|
|
|
|
|
|
|
|
|
| Prepared by M. Moore, Research & Planning, WY DWS, 10/17/22. |
|
|
|
|
|
|
|
|
|
|
|


 Wyoming at Work