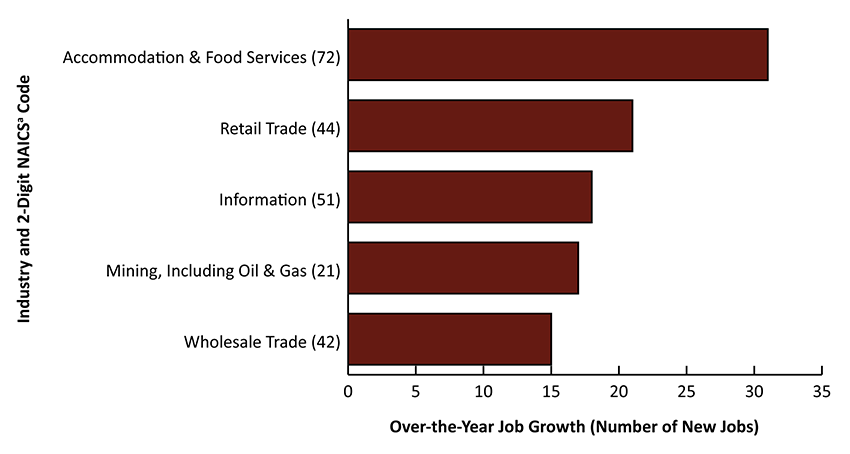
| Table 14: Wyoming Covered Employment, Total Wages, & Average Weekly Wage by Industry (NAICS) for Johnson County - Second Quarter 2022a |
|
|
|
|
|
|
|
|
|
|
|
|
|
|
|
|
Average Monthly Employment |
Total Wages |
Average Weekly Wage |
|
|
|
Change |
|
Change |
|
Change |
| NAICSb Code |
Ownership and Industry |
2022Q2 |
2021Q2 |
N |
% |
2022Q2 |
2021Q2 |
$ |
% |
2022Q2 |
2021Q2 |
$ |
% |
| 0 |
Ownership - Total |
3,302 |
3,244 |
57 |
1.8 |
$35,682,286 |
$34,326,996 |
$1,355,290 |
3.9 |
$831 |
$814 |
$17 |
2.1 |
| 0 |
Ownership - Private |
2,335 |
2,241 |
94 |
4.2 |
$22,348,342 |
$20,491,709 |
$1,856,633 |
9.1 |
$736 |
$703 |
$33 |
4.7 |
| 11 |
Agriculture, Forestry, Fishing & Hunting |
61 |
68 |
-6 |
-9.4 |
$541,413 |
$570,128 |
-$28,715 |
-5.0 |
$679 |
$648 |
$31 |
4.8 |
| 112 |
Animal Production & Aquaculture |
45 |
48 |
-3 |
-6.2 |
$408,495 |
$415,855 |
-$7,360 |
-1.8 |
$693 |
$662 |
$31 |
4.7 |
| 115 |
Agriculture & Forestry Support Activities |
8 |
11 |
-2 |
-21.9 |
$86,063 |
$86,472 |
-$409 |
-0.5 |
$795 |
$623 |
$171 |
27.5 |
| 21 |
Mining, Including Oil & Gas |
173 |
156 |
17 |
11.1 |
$3,420,241 |
$3,225,727 |
$194,514 |
6.0 |
$1,518 |
$1,591 |
-$73 |
-4.6 |
| 213 |
Support Activities For Mining |
148 |
124 |
24 |
19.4 |
$2,980,387 |
$2,759,561 |
$220,826 |
8.0 |
$1,549 |
$1,712 |
-$163 |
-9.5 |
| 22 |
Utilities |
10 |
11 |
-1 |
-11.7 |
$281,071 |
$333,010 |
-$51,939 |
-15.6 |
$2,162 |
$2,261 |
-$99 |
-4.4 |
| 221 |
Utilities |
10 |
11 |
-1 |
-11.7 |
$281,071 |
$333,010 |
-$51,939 |
-15.6 |
$2,162 |
$2,261 |
-$99 |
-4.4 |
| 23 |
Construction |
239 |
253 |
-15 |
-5.8 |
$2,482,642 |
$2,467,577 |
$15,065 |
0.6 |
$800 |
$749 |
$51 |
6.8 |
| 236 |
Construction of Buildings |
75 |
80 |
-5 |
-6.7 |
$732,809 |
$724,118 |
$8,691 |
1.2 |
$755 |
$696 |
$59 |
8.4 |
| 237 |
Heavy & Civil Engineering Construction |
37 |
44 |
-7 |
-16.7 |
$579,552 |
$614,363 |
-$34,811 |
-5.7 |
$1,216 |
$1,074 |
$142 |
13.2 |
| 238 |
Specialty Trade Contractors |
127 |
129 |
-2 |
-1.5 |
$1,170,281 |
$1,129,096 |
$41,185 |
3.6 |
$707 |
$672 |
$35 |
5.3 |
| 31-33 |
Manufacturing |
79 |
73 |
6 |
7.7 |
$798,083 |
$683,577 |
$114,506 |
16.8 |
$777 |
$717 |
$60 |
8.4 |
| 42 |
Wholesale Trade |
114 |
99 |
15 |
15.2 |
$1,248,522 |
$991,306 |
$257,216 |
25.9 |
$845 |
$773 |
$72 |
9.3 |
| 423 |
Merchant Wholesalers, Durable Goods |
73 |
66 |
7 |
11.2 |
$761,416 |
$662,281 |
$99,135 |
15.0 |
$802 |
$776 |
$27 |
3.4 |
| 44-45 |
Retail Trade |
322 |
301 |
21 |
6.9 |
$2,451,871 |
$2,245,526 |
$206,345 |
9.2 |
$586 |
$574 |
$12 |
2.2 |
| 441 |
Motor Vehicle & Parts Dealers |
32 |
38 |
-6 |
-15.8 |
$301,925 |
$371,055 |
-$69,130 |
-18.6 |
$726 |
$751 |
-$25 |
-3.4 |
| 444 |
Building Material & Garden Equipment & Supplies Dealers |
63 |
47 |
16 |
33.1 |
$576,019 |
$473,006 |
$103,013 |
21.8 |
$703 |
$769 |
-$65 |
-8.5 |
| 445 |
Food & Beverage Retailers |
102 |
92 |
10 |
11.2 |
$509,481 |
$468,710 |
$40,771 |
8.7 |
$383 |
$392 |
-$9 |
-2.3 |
| 449 |
Furniture, Home Furnishings, Electronics, & Appliance Retailers |
14 |
N/A |
N/A |
N/A |
$146,475 |
N/A |
N/A |
N/A |
$786 |
N/A |
N/A |
N/A |
| 456 |
Health & Personal Care Retailers |
20 |
N/A |
N/A |
N/A |
$209,756 |
N/A |
N/A |
N/A |
$807 |
N/A |
N/A |
N/A |
| 457 |
Gasoline Stations & Fuel Dealers |
54 |
N/A |
N/A |
N/A |
$527,171 |
N/A |
N/A |
N/A |
$746 |
N/A |
N/A |
N/A |
| 459 |
Sporting Goods, Hobby, Musical Instrument, Book, & Miscellaneous Retailers |
22 |
N/A |
N/A |
N/A |
$113,732 |
N/A |
N/A |
N/A |
$392 |
N/A |
N/A |
N/A |
| 48-49 |
Transportation & Warehousing |
55 |
58 |
-3 |
-4.6 |
$636,605 |
$617,086 |
$19,519 |
3.2 |
$885 |
$818 |
$67 |
8.1 |
| 484 |
Truck Transportation |
40 |
39 |
1 |
1.7 |
$471,825 |
$456,056 |
$15,769 |
3.5 |
$907 |
$892 |
$15 |
1.7 |
| 488 |
Support Activities For Transportation |
11 |
16 |
-4 |
-27.7 |
$113,502 |
$116,665 |
-$3,163 |
-2.7 |
$771 |
$573 |
$198 |
34.6 |
| 51 |
Information |
42 |
24 |
18 |
76.0 |
$368,913 |
$266,714 |
$102,199 |
38.3 |
$681 |
$867 |
-$186 |
-21.4 |
| 513 |
Broadcasting & Telecommunications |
18 |
N/A |
N/A |
N/A |
$152,268 |
N/A |
N/A |
N/A |
$663 |
N/A |
N/A |
N/A |
| 52 |
Finance & Insurance |
113 |
109 |
4 |
3.7 |
$1,702,792 |
$1,669,519 |
$33,273 |
2.0 |
$1,156 |
$1,175 |
-$19 |
-1.6 |
| 522 |
Credit Intermediation & Related Activities |
77 |
74 |
3 |
4.1 |
$1,234,844 |
$1,202,740 |
$32,104 |
2.7 |
$1,234 |
$1,250 |
-$17 |
-1.3 |
| 523 |
Securities, Commodity Contracts, & Other Financial Investments & Related Activities |
5 |
5 |
0 |
0.0 |
$79,555 |
$72,155 |
$7,400 |
10.3 |
$1,224 |
$1,110 |
$114 |
10.3 |
| 524 |
Insurance Carriers & Related Activities |
31 |
30 |
1 |
3.3 |
$388,393 |
$394,624 |
-$6,231 |
-1.6 |
$954 |
$1,001 |
-$47 |
-4.7 |
| 53 |
Real Estate & Rental & Leasing |
14 |
11 |
3 |
24.3 |
$96,171 |
$68,949 |
$27,222 |
39.5 |
$541 |
$482 |
$59 |
12.2 |
| 531 |
Real Estate |
14 |
11 |
3 |
24.3 |
$96,171 |
$68,949 |
$27,222 |
39.5 |
$541 |
$482 |
$59 |
12.2 |
| 54 |
Professional & Technical Services |
156 |
158 |
-2 |
-1.5 |
$2,368,668 |
$2,207,147 |
$161,521 |
7.3 |
$1,168 |
$1,072 |
$96 |
8.9 |
| 541 |
Professional, Scientific, & Technical Services |
156 |
158 |
-2 |
-1.5 |
$2,368,668 |
$2,207,147 |
$161,521 |
7.3 |
$1,168 |
$1,072 |
$96 |
8.9 |
| 55 |
Management of Companies & Enterprises |
8 |
4 |
4 |
100.0 |
$102,515 |
$68,115 |
$34,400 |
50.5 |
$986 |
$1,310 |
-$324 |
-24.7 |
| 551 |
Management of Companies & Enterprises |
8 |
4 |
4 |
100.0 |
$102,515 |
$68,115 |
$34,400 |
50.5 |
$986 |
$1,310 |
-$324 |
-24.7 |
| 56 |
Administrative & Waste Services |
50 |
56 |
-6 |
-10.1 |
$518,910 |
$394,829 |
$124,081 |
31.4 |
$793 |
$542 |
$251 |
46.2 |
| 561 |
Administrative & Support Services |
44 |
50 |
-6 |
-12.6 |
$484,618 |
$368,043 |
$116,575 |
31.7 |
$847 |
$563 |
$285 |
50.6 |
| 562 |
Waste Management & Remediation Services |
6 |
6 |
1 |
11.6 |
$34,292 |
$26,786 |
$7,506 |
28.0 |
$417 |
$363 |
$53 |
14.7 |
| 61 |
Educational Services |
8 |
N/A |
N/A |
N/A |
$99,945 |
N/A |
N/A |
N/A |
$923 |
N/A |
N/A |
N/A |
| 611 |
Educational Services |
8 |
N/A |
N/A |
N/A |
$99,945 |
N/A |
N/A |
N/A |
$923 |
N/A |
N/A |
N/A |
| 62 |
Health Care & Social Assistance |
200 |
201 |
-1 |
-0.5 |
$1,448,373 |
$1,404,027 |
$44,346 |
3.2 |
$558 |
$538 |
$20 |
3.7 |
| 624 |
Social Assistance |
106 |
112 |
-6 |
-5.4 |
$638,955 |
$668,914 |
-$29,959 |
-4.5 |
$465 |
$461 |
$4 |
0.9 |
| 71 |
Arts, Entertainment, & Recreation |
73 |
63 |
11 |
17.0 |
$306,700 |
$218,969 |
$87,731 |
40.1 |
$322 |
$269 |
$53 |
19.7 |
| 72 |
Accommodation & Food Services |
495 |
465 |
31 |
6.6 |
$2,551,173 |
$2,233,818 |
$317,355 |
14.2 |
$396 |
$370 |
$26 |
7.1 |
| 721 |
Accommodation |
212 |
195 |
17 |
8.7 |
$1,215,710 |
$1,087,164 |
$128,546 |
11.8 |
$440 |
$428 |
$12 |
2.9 |
| 722 |
Food Services & Drinking Places |
283 |
269 |
14 |
5.1 |
$1,335,463 |
$1,146,654 |
$188,809 |
16.5 |
$363 |
$327 |
$36 |
10.8 |
| 81 |
Other Services, Except Public Administration |
120 |
123 |
-2 |
-1.9 |
$889,947 |
$805,256 |
$84,691 |
10.5 |
$569 |
$505 |
$64 |
12.7 |
| 811 |
Repair & Maintenance |
51 |
48 |
4 |
7.7 |
$485,203 |
$440,149 |
$45,054 |
10.2 |
$727 |
$710 |
$17 |
2.4 |
| 812 |
Personal & Laundry Services |
46 |
50 |
-4 |
-7.4 |
$208,428 |
$226,815 |
-$18,387 |
-8.1 |
$349 |
$351 |
-$3 |
-0.8 |
|
|
|
|
|
|
|
|
|
|
|
|
|
|
| 0 |
Ownership - Federal Government |
124 |
134 |
-10 |
-7.5 |
$2,456,118 |
$2,466,739 |
-$10,621 |
-0.4 |
$1,528 |
$1,420 |
$108 |
7.6 |
| 48-49 |
Transportation & Warehousing |
16 |
15 |
0 |
2.2 |
$208,247 |
$201,049 |
$7,198 |
3.6 |
$1,022 |
$1,009 |
$13 |
1.3 |
| 491 |
Postal Service |
16 |
15 |
0 |
2.2 |
$208,247 |
$201,049 |
$7,198 |
3.6 |
$1,022 |
$1,009 |
$13 |
1.3 |
| 92 |
Public Administration |
108 |
118 |
-10 |
-8.7 |
$2,247,871 |
$2,265,690 |
-$17,819 |
-0.8 |
$1,601 |
$1,473 |
$128 |
8.7 |
| 924 |
Administration of Environmental Programs |
106 |
115 |
-9 |
-7.8 |
$2,200,421 |
$2,203,097 |
-$2,676 |
-0.1 |
$1,597 |
$1,474 |
$123 |
8.4 |
|
|
|
|
|
|
|
|
|
|
|
|
|
|
| 0 |
Ownership - State Government |
102 |
104 |
-2 |
-1.9 |
$1,310,498 |
$1,246,614 |
$63,884 |
5.1 |
$988 |
$922 |
$66 |
7.2 |
| 92 |
Public Administration |
63 |
65 |
-2 |
-3.1 |
$845,603 |
$814,068 |
$31,535 |
3.9 |
$1,038 |
$968 |
$70 |
7.2 |
| 922 |
Justice, Public Order, & Safety Activities |
10 |
10 |
0 |
0.0 |
$159,339 |
$142,851 |
$16,488 |
11.5 |
$1,226 |
$1,099 |
$127 |
11.5 |
| 924 |
Administration of Environmental Programs |
11 |
11 |
1 |
6.2 |
$168,686 |
$168,516 |
$170 |
0.1 |
$1,145 |
$1,215 |
-$70 |
-5.7 |
| 926 |
Administration of Economic Programs |
35 |
38 |
-3 |
-7.1 |
$426,007 |
$422,244 |
$3,763 |
0.9 |
$936 |
$862 |
$74 |
8.6 |
|
|
|
|
|
|
|
|
|
|
|
|
|
|
| 0 |
Ownership - Local Government |
741 |
766 |
-24 |
-3.2 |
$9,567,328 |
$10,121,934 |
-$554,606 |
-5.5 |
$993 |
$1,017 |
-$24 |
-2.4 |
| 92 |
Public Administration |
209 |
230 |
-21 |
-9.1 |
$1,845,926 |
$1,844,335 |
$1,591 |
0.1 |
$679 |
$617 |
$63 |
10.1 |
| 921 |
Executive, Legislative & General Government |
146 |
153 |
-6 |
-4.2 |
$1,626,824 |
$1,579,433 |
$47,391 |
3.0 |
$855 |
$796 |
$59 |
7.5 |
| 924 |
Administration of Environmental Programs |
17 |
17 |
0 |
-1.9 |
$147,659 |
$147,263 |
$396 |
0.3 |
$668 |
$654 |
$14 |
2.2 |
|
|
|
|
|
|
|
|
|
|
|
|
|
|
| N/A = not available due to NAICS code changes for 2022 or confidentiality. |
|
|
|
|
|
|
|
|
|
|
| aPreliminary. |
|
|
|
|
|
|
|
|
|
|
|
|
| bNorth American Industry Classification System. |
|
|
|
|
|
|
|
|
|
|
|
|
| Source: Quarterly Census of Employment and Wages, developed through a cooperative program between Research & Planning and the U.S. Bureau of Labor Statistics. |
| Extract Date: October 2022. |
|
|
|
|
|
|
|
|
|
|
|
|
| Prepared by M. Moore, Research & Planning, WY DWS, 10/17/22. |
|
|
|
|
|
|
|
|
|
|
|


 Wyoming at Work