| Table 20: Wyoming Covered Employment, Total Wages, & Average Weekly Wage by Industry (NAICS) for Platte County - Fourth Quarter 2021a |
|
|
|
|
|
|
|
|
|
|
|
|
|
|
|
|
Average Monthly Employment |
Total Wages |
Average Weekly Wage |
|
|
|
Change |
|
Change |
|
Change |
| NAICSb Code |
Ownership and Industry |
2021Q4 |
2020Q4 |
N |
% |
2021Q4 |
2020Q4 |
$ |
% |
2021Q4 |
2020Q4 |
$ |
% |
| 0 |
Ownership - Total |
3,361 |
3,391 |
-30 |
-0.9 |
$43,585,573 |
$40,940,020 |
$2,645,553 |
6.5 |
$997 |
$929 |
$69 |
7.4 |
| 0 |
Ownership - Private |
2,432 |
2,442 |
-10 |
-0.4 |
$33,177,264 |
$31,053,328 |
$2,123,936 |
6.8 |
$1,049 |
$978 |
$71 |
7.3 |
| 11 |
Agriculture, Forestry, Fishing And Hunting |
166 |
160 |
6 |
3.7 |
$1,769,697 |
$1,710,931 |
$58,766 |
3.4 |
$818 |
$821 |
-$2 |
-0.3 |
| 111 |
Crop Production |
10 |
8 |
3 |
34.7 |
$128,940 |
$83,387 |
$45,553 |
54.6 |
$960 |
$836 |
$124 |
14.8 |
| 112 |
Animal Production And Aquaculture |
149 |
144 |
4 |
3.0 |
$1,548,027 |
$1,528,347 |
$19,680 |
1.3 |
$801 |
$815 |
-$14 |
-1.7 |
| 23 |
Construction |
142 |
144 |
-2 |
-1.4 |
$1,896,559 |
$1,798,958 |
$97,601 |
5.4 |
$1,025 |
$959 |
$66 |
6.9 |
| 236 |
Construction Of Buildings |
55 |
51 |
5 |
9.2 |
$662,010 |
$560,174 |
$101,836 |
18.2 |
$920 |
$850 |
$70 |
8.2 |
| 237 |
Heavy And Civil Engineering Construction |
14 |
14 |
0 |
0.0 |
$288,788 |
$250,885 |
$37,903 |
15.1 |
$1,550 |
$1,347 |
$203 |
15.1 |
| 238 |
Specialty Trade Contractors |
73 |
79 |
-7 |
-8.4 |
$945,761 |
$987,899 |
-$42,138 |
-4.3 |
$1,001 |
$958 |
$43 |
4.5 |
| 31 |
Manufacturing |
60 |
58 |
2 |
3.4 |
$590,518 |
$541,254 |
$49,264 |
9.1 |
$757 |
$718 |
$39 |
5.5 |
| 42 |
Wholesale Trade |
42 |
41 |
1 |
1.6 |
$724,354 |
$584,015 |
$140,339 |
24.0 |
$1,327 |
$1,087 |
$240 |
22.1 |
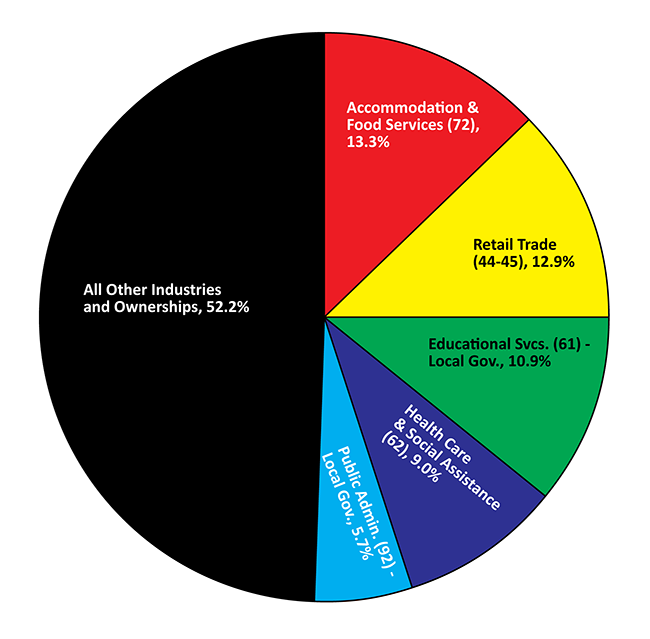
| 44 |
Retail Trade |
413 |
444 |
-30 |
-6.8 |
$3,387,388 |
$3,343,993 |
$43,395 |
1.3 |
$630 |
$580 |
$51 |
8.7 |
| 441 |
Motor Vehicle And Parts Dealers |
93 |
97 |
-4 |
-3.8 |
$1,227,042 |
$1,240,559 |
-$13,517 |
-1.1 |
$1,011 |
$984 |
$28 |
2.8 |
| 444 |
Building Material And Garden Supply Stores |
83 |
94 |
-11 |
-11.7 |
$634,194 |
$637,343 |
-$3,149 |
-0.5 |
$585 |
$520 |
$66 |
12.6 |
| 445 |
Food And Beverage Stores |
106 |
116 |
-10 |
-8.4 |
$651,193 |
$642,198 |
$8,995 |
1.4 |
$473 |
$427 |
$45 |
10.7 |
| 446 |
Health And Personal Care Stores |
14 |
19 |
-5 |
-27.6 |
$101,507 |
$157,036 |
-$55,529 |
-35.4 |
$558 |
$625 |
-$67 |
-10.8 |
| 447 |
Gasoline Stations |
79 |
81 |
-2 |
-2.9 |
$578,877 |
$503,180 |
$75,697 |
15.0 |
$564 |
$476 |
$88 |
18.4 |
| 48 |
Transportation And Warehousing |
93 |
106 |
-14 |
-12.8 |
$1,217,164 |
$1,348,435 |
-$131,271 |
-9.7 |
$1,010 |
$976 |
$35 |
3.6 |
| 484 |
Truck Transportation |
32 |
45 |
-13 |
-29.4 |
$395,569 |
$569,316 |
-$173,747 |
-30.5 |
$951 |
$966 |
-$15 |
-1.6 |
| 486 |
Pipeline Transportation |
22 |
22 |
0 |
0.0 |
$489,224 |
$499,617 |
-$10,393 |
-2.1 |
$1,711 |
$1,747 |
-$36 |
-2.1 |
| 51 |
Information |
14 |
20 |
-6 |
-30.0 |
$196,906 |
$171,109 |
$25,797 |
15.1 |
$1,082 |
$658 |
$424 |
64.4 |
| 517 |
Telecommunications |
5 |
6 |
-1 |
-16.7 |
$90,897 |
$82,863 |
$8,034 |
9.7 |
$1,398 |
$1,062 |
$336 |
31.6 |
| 52 |
Finance And Insurance |
111 |
113 |
-1 |
-1.2 |
$1,742,884 |
$1,801,141 |
-$58,257 |
-3.2 |
$1,204 |
$1,230 |
-$25 |
-2.1 |
| 522 |
Credit Intermediation And Related Activities |
94 |
95 |
-1 |
-0.7 |
$1,534,142 |
$1,582,134 |
-$47,992 |
-3.0 |
$1,251 |
$1,281 |
-$30 |
-2.3 |
| 53 |
Real Estate And Rental And Leasing |
28 |
33 |
-5 |
-15.3 |
$250,451 |
$306,819 |
-$56,368 |
-18.4 |
$696 |
$722 |
-$26 |
-3.6 |
| 54 |
Professional And Technical Services |
91 |
68 |
23 |
33.2 |
$1,426,180 |
$1,041,384 |
$384,796 |
37.0 |
$1,206 |
$1,172 |
$33 |
2.8 |
| 541 |
Professional And Technical Services |
91 |
68 |
23 |
33.2 |
$1,426,180 |
$1,041,384 |
$384,796 |
37.0 |
$1,206 |
$1,172 |
$33 |
2.8 |
| 56 |
Administrative And Waste Services |
40 |
39 |
1 |
2.5 |
$369,141 |
$430,204 |
-$61,063 |
-14.2 |
$704 |
$841 |
-$137 |
-16.3 |
| 561 |
Administrative And Support Services |
40 |
39 |
1 |
2.5 |
$369,141 |
$430,204 |
-$61,063 |
-14.2 |
$704 |
$841 |
-$137 |
-16.3 |
| 61 |
Educational Services |
4 |
6 |
-2 |
-33.3 |
$169,734 |
$92,921 |
$76,813 |
82.7 |
$3,264 |
$1,191 |
$2,073 |
174.0 |
| 611 |
Educational Services |
4 |
6 |
-2 |
-33.3 |
$169,734 |
$92,921 |
$76,813 |
82.7 |
$3,264 |
$1,191 |
$2,073 |
174.0 |
| 62 |
Health Care And Social Assistance |
303 |
293 |
10 |
3.4 |
$4,591,875 |
$4,445,237 |
$146,638 |
3.3 |
$1,166 |
$1,167 |
-$1 |
-0.1 |
| 621 |
Ambulatory Health Care Services |
57 |
54 |
3 |
4.9 |
$974,698 |
$1,076,445 |
-$101,747 |
-9.5 |
$1,315 |
$1,524 |
-$209 |
-13.7 |
| 624 |
Social Assistance |
99 |
99 |
0 |
-0.3 |
$597,039 |
$597,501 |
-$462 |
-0.1 |
$464 |
$463 |
$1 |
0.3 |
| 72 |
Accommodation And Food Services |
429 |
411 |
19 |
4.5 |
$1,974,677 |
$1,665,280 |
$309,397 |
18.6 |
$354 |
$312 |
$42 |
13.4 |
| 721 |
Accommodation |
120 |
115 |
5 |
4.1 |
$730,491 |
$564,108 |
$166,383 |
29.5 |
$470 |
$377 |
$92 |
24.4 |
| 722 |
Food Services And Drinking Places |
310 |
296 |
14 |
4.7 |
$1,244,186 |
$1,101,172 |
$143,014 |
13.0 |
$309 |
$286 |
$23 |
7.9 |
| 81 |
Other Services, Except Public Administration |
67 |
56 |
11 |
19.6 |
$762,220 |
$472,639 |
$289,581 |
61.3 |
$875 |
$649 |
$226 |
34.8 |
| 812 |
Personal And Laundry Services |
20 |
18 |
2 |
11.3 |
$110,469 |
$87,763 |
$22,706 |
25.9 |
$432 |
$382 |
$50 |
13.1 |
| 813 |
Membership Associations And Organizations |
21 |
20 |
1 |
3.3 |
$154,316 |
$115,510 |
$38,806 |
33.6 |
$565 |
$437 |
$128 |
29.3 |
| 0 |
Ownership - Federal Government |
118 |
122 |
-4 |
-3.3 |
$1,994,971 |
$1,910,066 |
$84,905 |
4.4 |
$1,301 |
$1,204 |
$96 |
8.0 |
| 48 |
Transportation And Warehousing |
26 |
27 |
-1 |
-2.5 |
$343,555 |
$301,158 |
$42,397 |
14.1 |
$1,016 |
$869 |
$148 |
17.0 |
| 491 |
Postal Service |
26 |
27 |
-1 |
-2.5 |
$343,555 |
$301,158 |
$42,397 |
14.1 |
$1,016 |
$869 |
$148 |
17.0 |
| 92 |
Public Administration |
92 |
95 |
-3 |
-3.5 |
$1,651,416 |
$1,608,908 |
$42,508 |
2.6 |
$1,381 |
$1,298 |
$83 |
6.4 |
| 924 |
Administration Of Environmental Programs |
13 |
12 |
1 |
8.3 |
$324,649 |
$274,087 |
$50,562 |
18.4 |
$1,921 |
$1,757 |
$164 |
9.3 |
| 926 |
Administration Of Economic Programs |
9 |
10 |
-1 |
-13.3 |
$95,445 |
$108,020 |
-$12,575 |
-11.6 |
$847 |
$831 |
$16 |
1.9 |
| 928 |
National Security And International Affairs |
70 |
73 |
-3 |
-4.1 |
$1,231,322 |
$1,226,801 |
$4,521 |
0.4 |
$1,347 |
$1,287 |
$60 |
4.6 |
| 0 |
Ownership - State Government |
173 |
168 |
5 |
3.2 |
$2,093,959 |
$1,944,353 |
$149,606 |
7.7 |
$929 |
$890 |
$39 |
4.4 |
| 61 |
Educational Services |
4 |
4 |
0 |
0.0 |
$54,443 |
$52,759 |
$1,684 |
3.2 |
$1,047 |
$1,015 |
$32 |
3.2 |
| 611 |
Educational Services |
4 |
4 |
0 |
0.0 |
$54,443 |
$52,759 |
$1,684 |
3.2 |
$1,047 |
$1,015 |
$32 |
3.2 |
| 92 |
Public Administration |
169 |
164 |
5 |
3.3 |
$2,039,516 |
$1,891,594 |
$147,922 |
7.8 |
$927 |
$887 |
$39 |
4.4 |
| 922 |
Justice, Public Order, And Safety Activities |
5 |
6 |
-1 |
-16.7 |
$56,394 |
$62,460 |
-$6,066 |
-9.7 |
$868 |
$801 |
$67 |
8.3 |
| 923 |
Administration Of Human Resource Programs |
19 |
16 |
3 |
16.4 |
$225,050 |
$193,225 |
$31,825 |
16.5 |
$911 |
$910 |
$1 |
0.1 |
| 924 |
Administration Of Environmental Programs |
8 |
8 |
0 |
-4.1 |
$112,362 |
$117,136 |
-$4,774 |
-4.1 |
$1,127 |
$1,126 |
$1 |
0.1 |
| 926 |
Administration Of Economic Programs |
52 |
49 |
2 |
4.7 |
$597,915 |
$551,866 |
$46,049 |
8.3 |
$890 |
$861 |
$30 |
3.4 |
| 928 |
National Security And International Affairs |
86 |
84 |
2 |
2.0 |
$1,047,795 |
$966,907 |
$80,888 |
8.4 |
$937 |
$882 |
$55 |
6.3 |
| 0 |
Ownership - Local Government |
638 |
659 |
-21 |
-3.2 |
$6,319,379 |
$6,032,273 |
$287,106 |
4.8 |
$762 |
$704 |
$58 |
8.3 |
| 61 |
Educational Services |
368 |
384 |
-16 |
-4.2 |
$3,777,838 |
$3,574,965 |
$202,873 |
5.7 |
$790 |
$717 |
$74 |
10.3 |
| 611 |
Educational Services |
368 |
384 |
-16 |
-4.2 |
$3,777,838 |
$3,574,965 |
$202,873 |
5.7 |
$790 |
$717 |
$74 |
10.3 |
| 92 |
Public Administration |
190 |
187 |
4 |
2.0 |
$1,712,158 |
$1,629,888 |
$82,270 |
5.0 |
$692 |
$672 |
$20 |
3.0 |
| 921 |
Executive, Legislative And General Government |
164 |
164 |
1 |
0.4 |
$1,587,391 |
$1,506,462 |
$80,929 |
5.4 |
$743 |
$708 |
$35 |
4.9 |
| 924 |
Administration Of Environmental Programs |
26 |
23 |
3 |
13.0 |
$124,767 |
$123,426 |
$1,341 |
1.1 |
$369 |
$413 |
-$44 |
-10.6 |
|
|
|
|
|
|
|
|
|
|
|
|
|
|
| aPreliminary. |
|
|
|
|
|
|
|
|
|
|
|
|
| bNorth American Industry Classification System. |
|
|
|
|
|
|
|
|
|
|
|
|
| Source: Quarterly Census of Employment and Wages, developed through a cooperative program between Research & Planning and the U.S. Bureau of Labor Statistics. |
|
|
|
| Extract Date: April 2022. |
|
|
|
|
|
|
|
|
|
|
|
|
| Prepared by M. Moore, Research & Planning, WY DWS, 4/15/22. |
|
|
|
|
|
|
|
|
|
|
|


 Wyoming at Work