
Planning vs. Performance:
Why Outcome Wages May Fall Short of Accountability Measures
|
Workforce development planning may be soundly thought out, but not necessarily produce the desired results. This article discusses how factors such as worker experience, industry stability, and employer-provided benefits may contribute to the difference in wages between the planning estimates and performance measures of the Workforce Innovation and Opportunity Act.
In theory, planning and performance measures complement each other; in practice they may not. Therefore, it is necessary to recognize the difference between these measures throughout the workforce development system.
During the planning phase, occupational wages and projections are used to identify high-demand and high-growth occupations. During the performance phase, the accountability outcome wages are measured based on the actual level of median earnings of the participants of the training programs after completion.
This difference in measurements between the estimated hourly rate of compensation used in the planning phase and the level of wages earned during the performance measurement phase might create the appearance of ineffective training programs when conducting program evaluation.
Read Article Tables and Figures
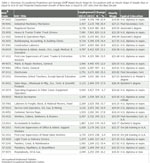
Employment and Wage Data for the Nonprofit Sector
The U.S. Bureau of Labor Statistics (BLS) recently published employment and wage data on nonprofit establishments. The BLS used data from the Quarterly Census of Employment and Wages and the Internal Revenue Service’s Exempt Organization Business Master File for this research.
National nonprofit data are available at the national North American Industry Classification System (NAICS) two-digit (industry sector) and three-digit (industry subsector) levels. For individual states, data are available at the NAICS two-digit level. Annual figures for 2007 through 2012 are available as research series.
The following data are available: annual average number of establishments, annual average employment, total annual wages, average wages per employee, and average weekly wage per employee.
Employment and Wage Changes in Wyoming’s Private Coal Mining Sector
Wyoming’s economy experienced a period of rapid growth from 2005 to 2008. During this time, employment and wages in Wyoming’s private coal mining sector grew substantially.
During the economic downturn that lasted from 2009Q1 to 2010Q1, job losses in Wyoming's private coal mining sector were not as severe as those seen in other types of mining activities, or in other industries in the state.
However, employment in Wyoming’s private coal mining sector has decreased steadily over the last few years. Average monthly employment decreased from 7,117 in 2012Q1 to 6,569 in 2014Q4, a change of -458, or -6.4%. The full effects of the recent news of decreased coal consumption likely are not reflected in the most recent employment and wage data from the QCEW.
Which Occupations Could Be Affected by a Minimum Wage Increase?
The purpose of this article is to show which occupations and the estimated number of employees that would be affected if the state or federal minimum wage were increased to $9.25 per hour by using survey data collected through the Occupational Employment Statistics (OES) program. In order to calculate the estimated number of workers and which occupations could be affected by a minimum wage change, it was necessary for Research & Planning to use the lowest OES wage range of $9.25 per hour, the closest alternative to the $9.00 per hour proposed during Wyoming’s 2014 legislative session.
Read Article Tables See "About the OES Survey"
New Demographics and Earnings Tables Available from R&P
The most recent worker demographics and earnings tables from the Research & Planning (R&P) section of the Wyoming Department of Workforce Services offer insight into employment and wages in Wyoming in 2014, and trends in the state’s labor market and economy since 2000. These tables provide detailed information on gender, age, and earnings at the industry and county level.
Read Article Tables and Figures See 2000-2014 Demographics & Earnings Tables
Workers' Compensation Claims Continue Downward Trend
From third quarter 2013 (2013Q3) to third quarter 2014 (2014Q3), the average injury rate in Wyoming was 11.5 injuries per 1,000 workers, and the rate of workers’ compensation claims continued its downward trend since 2004Q3 (see Figure 1). The highest rate of injury was 15.6 per 1,000 workers, which occurred in 2007Q1. In 2012Q4, the injury rate dropped below 11 injuries per 1,000 workers (10.5) for the first time in 10 years. Over the last decade, the rate was 13.0 injuries per 1,000 workers.
Read Article Tables and Figures
Wyoming Unemployment Rate Unchanged at 4.1% in April 2015
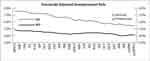
|
Wyoming’s seasonally adjusted unemployment rate held steady from March to April at 4.1%. Wyoming’s unemployment rate was slightly lower than its April 2014 level of 4.3% and significantly lower than the current U.S. unemployment rate of 5.4%. Seasonally adjusted employment of Wyoming residents increased, rising by an estimated 912 individuals (0.3%) from March to April.