
New Demographics and Earnings Tables Available from R&P
Related Tables and Figures Demographics and Earnings Tables
The most recent worker demographics and earnings tables from the Research & Planning (R&P) section of the Wyoming Department of Workforce Services offer insight into employment and wages in Wyoming in 2014, and trends in the state’s labor market and economy since 2000. These tables provide detailed information on gender, age, and earnings at the industry and county level.
Examples
 |
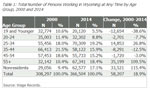 |
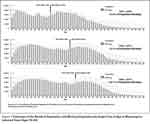
The number of persons age 55 and older working in Wyoming at any time has more than doubled over the last 14 years, from 32,142 in 2000 to 67,341 in 2014 (see Table 1). Nearly one in every five (18.4%) individuals working in Wyoming at any time in 2014 was age 55 or older. This is consistent with previous findings from Knapp (2013) that “the proportion of older workers compared to the general population continues to increase over time” (see Figure 1).
Selected Uses for this Information
- Environmental impact studies
- Health care planning
- Transportation and commuting studies
- Planning for replacement need in the workforce
Meanwhile, the number of resident youth working in Wyoming continued to decline, from 32,774 in 2000 to 20,120 in 2014.
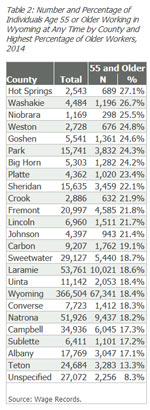 |
Many of Wyoming’s smallest counties had the highest proportion of older workers in 2014 (see Table 2). The counties with the highest proportion of workers age 55 and older were Hot Springs (27.1%), Washakie (26.7%), Niobrara (25.5%), Weston (24.8%), and Goshen (24.6%). Teton (13.3%) and Albany (17.1%) had the lowest proportion of older workers. Counties with a high percentage of jobs in the mining industry also had lower proportions of older workers, including Sublette (17.2%), Campbell (17.3%), and Natrona (18.2%).
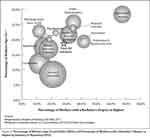 |
Figure 2 shows the percentage of workers age 55 and older and the percentage of workers with a bachelor’s degree or higher by industry. As this figure illustrates, industries with a high percentage of jobs requiring a bachelor’s degree or higher also have a high percentage of older workers, such as educational services, public administration, and health care & social assistance. As noted by Glover (2012), “Wyoming youth appear to have difficulty finding jobs in industries that require a higher education, such as health care & social assistance, educational services, and public administration. Members of the boom generation [those born between 1946 and 1964] tend to hold onto jobs in these industries longer, reducing the opportunities for younger workers. If the boom generation retires at a normal rate, there will be many opportunities for the educated youth of Wyoming.”
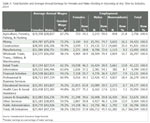 |
Table 3 shows that in 2014, there were 138,510 females and 166,712 males working in Wyoming at any time, along with 61,282 nonresidents. Nonresidents are defined as “individuals without a Wyoming-issued driver’s license or at least four quarters of work history in Wyoming” (Jones, 2002). The largest number of females worked in health care & social assistance (26,377) and educational services (21,815). The largest number of males worked in mining (25,701) and construction (24,132). A substantial number of nonresidents worked in leisure & hospitality (16,420) and construction (14,660), two industries that employ a large number of workers on a seasonal basis.
Females on average earned $27,464 annually in 2014, compared to $47,154 for males. In other words, females earned 58.2% of what males earned (see Table 3). The gender wage gap was narrowest in industries with a high percentage of jobs requiring postsecondary education (public administration and educational services) and industries in which females made up a small percentage of total employment (construction and mining).
The complete Earnings Tables by County, Industry, Age, and Gender for 2000 to 2014 can be found online at http://doe.state.wy.us/LMI/earnings_tables/2015/index.htm.
References
Glover, T. (2012). A Decade Later: Tracking Wyoming’s Youth into the Labor Market. Retrieved June 3, 2015, from http://doe.state.wy.us/LMI/w_r_research/A_Decade_Later.pdf
Jones, S. (2002). Defining residency for the Wyoming workforce. Wyoming Labor Force Trends, 39(11). Retrieved May 26, 2015, from http://doe.state.wy.us/LMI/1102/a1.htm
Knapp, L. (2013). Industry educational attainment, aging professionals, and teacher supply. Monitoring School District Human Resource Cost Pressures (p. 59). Retrieved June 3, 2015, from http://doe.state.wy.us/LMI/education_costs/2013/monitoring_2013.pdf