Wyoming Normalizeda Unemployment Insurance Statistics: Continued Claims
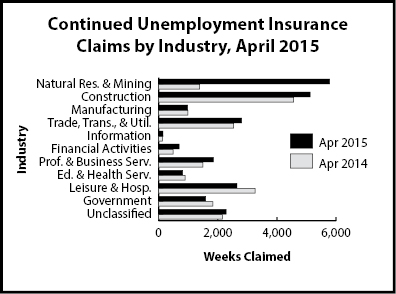
Continued claims increased 25.0% from April 2014. Total weeks claimed in mining increased from 1,259 in April 2014 to 5,654 in April 2015 (349.1%).
| Continued Claims | Claims Filed | Percent Change Claims Filed | ||||
|---|---|---|---|---|---|---|
| Apr 15 | Apr 15 | |||||
| Apr 15 | Mar 15 | Apr 14 | Mar 15 | Apr 14 | ||
| Wyoming Statewide | ||||||
| TOTAL WEEKS CLAIMED | 25,262 | 26,775 | 20,204 | -5.7 | 25.0 | |
| TOTAL UNIQUE CLAIMANTSb | 6,492 | 7,811 | 5,470 | -16.9 | 18.7 | |
| Benefit Exhaustions | 458 | 401 | 575 | 14.2 | -20.3 | |
| Benefit Exhaustion Rates | 7.1% | 5.1% | 10.5% | 1.9% | -3.5% | |
| TOTAL GOODS-PRODUCING | 11,891 | 13,506 | 6,936 | -12.0 | 71.4 | |
| Natural Res. & Mining | 5,786 | 5,056 | 1,382 | 14.4 | 318.7 | |
| Mining | 5,654 | 4,888 | 1,259 | 15.7 | 349.1 | |
| Oil & Gas Extraction | 457 | 389 | 143 | 17.5 | 219.6 | |
| Construction | 5,122 | 7,430 | 4,563 | -31.1 | 12.3 | |
| Manufacturing | 982 | 1,018 | 989 | -3.5 | -0.7 | |
| TOTAL SERVICE-PROVIDING | 9,498 | 8,860 | 9,277 | 7.2 | 2.4 | |
| Trade, Transp., & Utilities | 2,810 | 2,701 | 2,540 | 4.0 | 10.6 | |
| Wholesale Trade | 641 | 533 | 443 | 20.3 | 44.7 | |
| Retail Trade | 914 | 1,000 | 1,273 | -8.6 | -28.2 | |
| Transp., Warehousing & Utilities | 1,255 | 1,168 | 824 | 7.4 | 52.3 | |
| Information | 140 | 102 | 126 | 37.3 | 11.1 | |
| Financial Activities | 697 | 654 | 487 | 6.6 | 43.1 | |
| Prof. & Business Services | 1,855 | 2,208 | 1,498 | -16.0 | 23.8 | |
| Educational & Health Svcs. | 807 | 825 | 893 | -2.2 | -9.6 | |
| Leisure and Hospitality | 2,650 | 1,902 | 3,267 | 39.3 | -18.9 | |
| Other Svcs., exc. Public Admin. | 531 | 460 | 461 | 15.4 | 15.2 | |
| TOTAL GOVERNMENT | 1,591 | 1,943 | 1,833 | -18.1 | -13.2 | |
| Federal Government | 728 | 1,008 | 866 | -27.8 | -15.9 | |
| State Government | 220 | 215 | 210 | 2.3 | 4.8 | |
| Local Government | 642 | 718 | 756 | -10.6 | -15.1 | |
| Local Education | 96 | 105 | 104 | -8.6 | -7.7 | |
| UNCLASSIFIED | 2,281 | 2,465 | 2,157 | -7.5 | 5.7 | |
| Laramie County | ||||||
| TOTAL WEEKS CLAIMED | 2,093 | 2,958 | 2,318 | -29.2 | -9.7 | |
| TOTAL UNIQUE CLAIMANTS | 523 | 897 | 622 | -41.7 | -15.9 | |
| TOTAL GOODS-PRODUCING | 779 | 1,366 | 777 | -43.0 | 0.3 | |
| Construction | 519 | 1,071 | 665 | -51.5 | -22.0 | |
| TOTAL SERVICE-PROVIDING | 995 | 1,214 | 1,221 | -18.0 | -18.5 | |
| Trade, Transp., and Utilities | 313 | 411 | 425 | -23.8 | -26.4 | |
| Financial Activities | 86 | 88 | 109 | -2.3 | -21.1 | |
| Prof. & Business Svcs. | 294 | 419 | 398 | -29.8 | -26.1 | |
| Educational and Health Svcs. | 174 | 209 | 168 | -16.7 | 3.6 | |
| Leisure & Hospitality | 114 | 120 | 123 | -5.0 | -7.3 | |
| TOTAL GOVERNMENT | 223 | 234 | 269 | -4.7 | -17.1 | |
| UNCLASSIFIED | 95 | 142 | 49 | -33.1 | 93.9 | |
| Natrona County | ||||||
| TOTAL WEEKS CLAIMED | 3,554 | 3,571 | 2,072 | -0.5 | 71.5 | |
| TOTAL UNIQUE CLAIMANTS | 910 | 1,067 | 561 | -14.7 | 62.2 | |
| TOTAL GOODS-PRODUCING | 2,007 | 2,019 | 897 | -0.6 | 123.7 | |
| Construction | 626 | 909 | 513 | -31.1 | 22.0 | |
| TOTAL SERVICE-PROVIDING | 1,336 | 1,316 | 1,049 | 1.5 | 27.4 | |
| Trade, Transp., and Utilities | 527 | 483 | 372 | 9.1 | 41.7 | |
| Financial Activities | 106 | 94 | 65 | 12.8 | 63.1 | |
| Professional & Business Svcs. | 425 | 434 | 248 | -2.1 | 71.4 | |
| Educational & Health Svcs. | 177 | 183 | 193 | -3.3 | -8.3 | |
| Leisure & Hospitality | 109 | 153 | 145 | -28.8 | -24.8 | |
| TOTAL GOVERNMENT | 113 | 113 | 70 | 0.0 | 61.4 | |
| UNCLASSIFIED | 96 | 121 | 55 | -20.7 | 74.5 | |
| aAn average month is considered 4.33 weeks. If a month has four weeks, the normalization factor is 1.0825. If the month has five weeks, the normalization factor is 0.866. The number of raw claims is multiplied by the normalization factor to achieve the normalized claims counts. bDoes not include claimants receiving extended benefits. |
||||||
Continued Claims by Industry
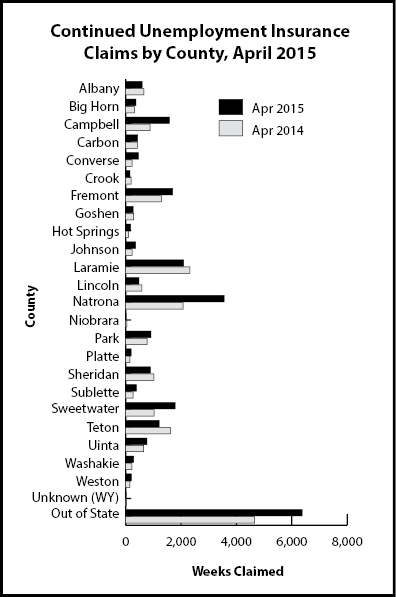
Continued Claims by County
|
||||||

