
Planning vs. Performance:
Why Outcome Wages May Fall Short of Accountability Measures
Workforce development planning may be soundly thought out, but not necessarily produce the desired results. This article discusses how factors such as worker experience, industry stability, and employer-provided benefits may contribute to the difference in wages between the planning estimates and performance measures of the Workforce Innovation and Opportunity Act.
Under the Workforce Innovation and Opportunity Act (WIOA), an in-demand industry sector or occupation is defined as “(i) an industry sector that has a substantial current or potential impact (including through jobs that lead to economic self-sufficiency and opportunities for advancement) on the State, regional, or local economy, as appropriate, and that contributes to the growth or stability of other supporting businesses, or the growth of other industry sectors; or (ii) an occupation that currently has or is projected to have a number of positions (including positions that lead to economic self-sufficiency and opportunities for advancement) in an industry sector so as to have a significant impact on the State, regional, or local economy, as appropriate” (Workforce Innovation and Opportunity Act, 2014). When selecting occupations to designate as in-demand, language such as “economic self-sufficiency” offers a definition that is too vague to objectively and reliably determine which occupations meet the criteria. President Obama has advocated for a new level in the federal minimum wage to $10.10 per hour, which could provide the operational definition of “economic self-sufficiency” (Executive Office of the President, 2014). However, with many other interpretations of the term, a clear and unambiguous definition is needed to guide the decision of which occupational training programs to subsidize. Consideration of the statistical information needed for both planning and performance measures is essential when identifying an occupation as being in-demand.
In addition to the planning phase of workforce development, WIOA mandates the use of multiple indicators as accountability measures for the adult and dislocated worker programs during the performance phase. These indicators include employee retention during the second and fourth quarters after exit from the program and the median quarterly earnings, or the earnings collected over a three-month period, during the second quarter after exit from the program (Workforce Innovation and Opportunity Act, 2014). Unemployment Insurance (UI) wage records provide these quarterly earnings as well as detailed information on employees from required quarterly UI reports. These administrative records provide wage and employment information for approximately 92% of Wyoming’s workforce (Harris, 2014).
While planning and performance measures complement each other in theory, in practice they may not. Therefore, it is necessary to recognize the difference between these measures throughout the workforce development system. On one hand, during the planning phase, occupational wages and projections are used to identify high-demand and high-growth occupations. The wage data used to make these determinations come from the Occupational Employment Statistics (OES) survey, a national program funded by the U.S. Bureau of Labor Statistics which provides the average hourly rate of compensation for an occupation across each industry. The OES estimates for May 2013 data updated to the September 2014 Employment Cost Index can be found at http://doe.state.wy.us/LMI/OES_toc.htm. On the other hand, during the performance phase, the accountability outcome wages are measured based on the actual level of median earnings of the participants of the training programs after completion (WIOA, 2014). This difference in measurements between the estimated hourly rate of compensation used in the planning phase and the level of wages earned during the performance measurement phase might create the appearance of ineffective training programs when conducting program evaluation.
To determine which occupations meet the criteria addressed in WIOA in Wyoming, the Wyoming Workforce Development Council (WWDC) asked Research & Planning (R&P) to use labor market projections and other labor market information to compile a list of high-demand, high-growth occupations. The WWDC is the governor-appointed state workforce investment board whose mission is to “shape strategies and policies to develop, recruit and retain Wyoming’s workforce” (Wyoming Workforce Development Council, 2015).
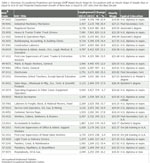 |
In response to the WWDC’s request, R&P produced a list of occupations in Wyoming using the following criteria: an hourly wage of at least $14.00 and a growth of 200 jobs in the next decade (Glover, 2014). The presentation to the council, titled, “Workforce Opportunities in Wyoming: Developing a Data-Driven Approach to Public Sector Investment and Evaluation” can be found here. Twenty-seven occupations matched these standards, including maintenance & repair workers, general, which is used as an example throughout this article. This occupation has a Standard Occupational Classification (SOC) code of 49-9071. Table 1 shows the list that meets the current standards of a high-demand, high-wage occupation.
As stated earlier, the outcome wages measured during the performance phase may not match the anticipated wages during the planning phase. It is not always the case that a person who is trained to work in a high-demand occupation, such as a welder earning an average wage of $23.59 per hour according to OES, will earn the equivalent quarterly wage according to wage records. There are many factors that contribute to the difference in wages between the planning and performance measures of WIOA. These factors include worker experience, industry stability, and employer-provided benefits, most of which are not evident or available during the planning phase of workforce development. Using R&P’s New Hires Job Skills Survey, further detail from multiple industries about occupational compensation — both direct and indirect, as well as the human capital brought to those jobs — becomes available (Moore & Knapp, 2014).
The New Hires Survey results for fourth quarter 2011 (2011Q4) to third quarter 2013 (2013Q3) can be found at http://doe.state.wy.us/LMI/newhires.htm. The definition of a new hire is “an employee who, during a particular quarter, started working for an employer he or she had not worked for since at least 1992,” (Knapp, 2011). These results reveal the demographics of the new hires – such as age, gender, and residency – and the skills important to the employer, the average hourly wage of the new hires, and the percent of hires employed with the same employer after one quarter. These details can provide an understanding of why employees do not earn the direct compensation they were trained to earn, whether they are earning higher or lower wages. This article will use maintenance & repair workers, general (SOC 49-9071) as an example because of the available data collected from the New Hires Survey for most industries.
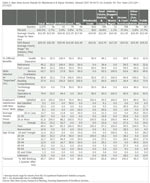 |
During the planning phase of workforce development, the OES hourly wage for all industries in Wyoming was used to identify occupations that earn a wage of at least $14.00 per hour. Because the average wage of an occupation varies among industries, it is likely that some employees will not earn the wage expected when the occupation was selected. For example, the average hourly wage for maintenance & repair workers, general, for all industries was $20.03. However, the average hourly wage for the maintenance and repair workers, general, working in real estate, rental, & leasing was only $13.79. Many employees who are trained for the maintenance & repair workers, general, occupation will not obtain employment in higher paying industries, such as utilities, which had an average hourly wage of $24.42 at placement. According to Table 2, in the first quarter after hire, at least 81.1% of employees will not earn the quarterly wage that they were trained to earn under the current standards of an in-demand occupation. In later quarters of their career, employees may be more likely to earn wages above $14.00 per hour.
The characteristics of the industry will also affect the wages that employers choose to pay their employees. If the work in an industry takes place during specific seasons, such as construction in the summer, employers may be forced to pay a higher direct wage. New hires earned $13.25 per hour in the construction industry and $13.50 per hour in mining. These wages are higher than in more stable and less seasonal industries, such as administrative, support, & waste management ($10.00 per hour) and accommodation & food services ($11.00 per hour) at the time of hire.
The experience level of a new hire will affect the outcome wage at placement for an in-demand occupation. As shown in Table 2, the hourly wage of hires during their quarter of placement is often much less than the OES wage. The level of experience may also contribute to the significant difference in the OES and the hourly wage from the New Hires Survey. For example, the average hourly wage from OES for maintenance & repair workers, general, in the mining industry of $32.56 was significantly higher than the New Hires Survey average hourly wage of $13.50. Looking further down on Table 2, the percentages in the age group section indicate that all of the new hires were under the age of 35, and one-third of the new hires were age 19 or younger. This suggests that the new hires were inexperienced and therefore, earned a lower wage than the Wyoming average.
The opportunity for an employer to offer indirect compensation will influence the average wage of an in-demand occupation. Indirect compensation includes health benefits, paid leave, and retirement benefits. According to the New Hires Survey results, half of the employers in wholesale trade offered health insurance and paid leave to their employees. Maintenance & repair workers, general, in this industry earned $16.41 per hour on average, and were paid $14.50 per hour at placement. In the accommodation & food services industry, employers were more likely to offer health insurance, paid leave, and retirement benefits. However, with these benefits often come lower hourly wages. Maintenance & repair workers, general, in the accommodation & food services industry earned an average of $15.52 per hour and only $11.00 per hour in the first quarter of hire.
Wyoming may train employees to work in occupations that earn well over $14.00 per hour. However, it is not guaranteed that, after the second and fourth quarter of hire, the quarterly wages from wage records will reflect the high OES wages that motivated the training program in the first place. As stated in the first paragraph, an in-demand occupation is one that “has or is projected to have a number of positions (including positions that lead to economic self-sufficiency and opportunities for advancement) in an industry sector so as to have a significant impact on the State” (WIOA, 2014). To determine if an occupation will “lead to economic self-sufficiency,” a high OES hourly wage alone may not be enough. Wages at placement may be lower, but taking into account indirect compensation, job stability, and opportunity to earn work experience may offset low outcome wages. More than just the average hourly wage needs consideration when selecting occupations for which to fund training, and measuring the workforce outcomes of the training programs.
References
Executive Office of the President. (2014, August). A year of action: Progress report on raising the minimum wage. Retrieved February 12, 2015, from http://www.whitehouse.gov/sites/default/files/docs/minimum_wage_report2.pdf
Gallagher, T., & Holmes, M. (2014). Workforce opportunities in Wyoming: Developing a data-driven approach to public sector investment and evaluation [PowerPoint slides].
Glover, T. (2014). Wyoming’s Occupational Projections 2012 to 2022 and Wyoming’s Occupational Employment Statistics 2013. Wyoming Department of Workforce Services, Research & Planning.
Harris, P. (2014). The recent labor market downturn as a natural experiment, part 2: The effects of labor market conditions and employer re-hiring practices on repeat use of the Unemployment Insurance (UI) system. Wyoming Labor Force Trends. 51(12). Retrieved February 10, 2015, from http://doe.state.wy.us/LMI/trends/1214/a1.htm
Knapp, L. (2011). Survey captures data on Wyoming new hires. Wyoming Labor Force Trends, 48(2). Retrieved January 6, 2015, from http://doe.state.wy.us/LMI/0211/a2.htm
Moore, M., & Knapp, L. (2014). Using New Hires Survey data to identify training opportunities. Wyoming Labor Force Trends. 51(7). Retrieved January 6, 2015, from http://doe.state.wy.us/LMI/trends/0714/a2.htm
Workforce Innovation and Opportunity Act, H.R. 803 §3(23)(A), 2014.
Workforce Innovation and Opportunity Act, H.R. 803 §116(b)(2)(A)(i)(I-VI), 2014.
Wyoming Workforce Development Council. (2015, January 15). The Council. Wyoming Workforce Development Council. Retrieved from http://wyowdc.wyo.gov/council