
Which Occupations Could Be Affected by a Minimum Wage Increase?
by: Deana Hauf, Senior Statistician
About the Occupational Employment Statistics Survey
Occupational Employment Statistics (OES) Survey data have many uses. Businesses use this information to compare the wages offered for a particular occupation to the state average, while career counselors, colleges, and students can use it in making career decisions. The data are also used to develop occupational projections and estimate staffing patterns in industries.
OES data for Wyoming and related articles and publications can be found here. The newest statewide, regional, county, and MSA data (estimates for Wyoming wages for May 2014 data) are updated to the March 2015 Employment Cost Index.
As of 2015, the federal minimum wage is $7.25, and Wyoming’s state minimum wage is $5.15. During the Wyoming 2014 legislative session, a bill was introduced that would have raised the state’s minimum wage from $5.15 to $9.00 per hour and raised the base pay for tipped employees from $2.13 to $5.00 per hour (House Bill No. HB0024, 2014). The bill failed an introductory vote in the state House of Representatives, 51-9.
Of the 45 states that have a minimum wage requirement, only four have a minimum wage set below the federal level: Arkansas, Georgia, Minnesota, and Wyoming. When the federal minimum wage is higher than the state minimum wage, the federal minimum wage goes into effect. Washington, D.C. and 22 other states have a minimum wage set higher than the federal minimum wage. In 20 states, the minimum wage rate is the same as the federal minimum wage. When the state minimum wage is greater than the federal minimum wage, the state minimum wage is used. There are five states that do not have a minimum wage rate requirement, so the federal minimum wage of $7.25 per hour applies: Alabama, Louisiana, Mississippi, South Carolina, and Tennessee.
The purpose of this article is to show which occupations and the estimated number of employees that would be affected if the state or federal minimum wage were increased to $9.25 per hour by using survey data collected through the Occupational Employment Statistics (OES) program. In order to calculate the estimated number of workers and which occupations could be affected by a minimum wage change, it was necessary for Research & Planning (R&P) to use the lowest OES wage range of $9.25 per hour, the closest alternative to the $9.00 per hour proposed during Wyoming’s 2014 legislative session.
Methodology
The Research & Planning (R&P) section of the Wyoming Department of Workforce Services has conducted the OES survey since 1996 in cooperation with the U.S. Bureau of Labor Statistics (BLS). In Wyoming, the OES Wage Survey samples and contacts approximately 900 establishments by mail in May and November of each year. Data obtained are used to estimate occupational employment and wage rates for Unemployment Insurance (UI) covered wage and salary jobs in non-farm establishments. More information on Wyoming’s OES Wage Survey can be found online at http://doe.state.wy.us/LMI/OES_toc.htm.
The OES data are collected on a survey form by wage ranges; an employer is asked to put the number of employees in an occupational category within a wage range. The lowest wage range on the survey form is “under $9.25 per hour.” The midpoint of the lowest OES wage range is $7.96.
According to the BLS (2015), “wages for the OES survey are straight-time, gross pay, exclusive of premium pay. Base rate, cost-of-living allowances, guaranteed pay, hazardous-duty pay, incentive pay, including commissions and production bonuses, and tips are included. Excluded are overtime pay, severance pay, shift differentials, nonproduction bonuses, employer cost for supplementary benefits, and tuition reimbursements. The OES Wage Survey does not include any benefit data.”
Hourly wage estimates for the OES are calculated using a year-round, full-time figure of 2,080 hours per year (52 weeks times 40 hours).
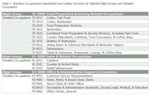 |
Occupations are identified by using the 2010 Standard Occupational Classification (SOC) System. The 2010 SOC classifies workers at the major group, minor group, broad occupation, and detailed occupation levels (U.S. Bureau of Labor Statistics, 2010). Table 1 shows examples of detailed occupations within the major groups of food preparation & serving related occupations, office & administrative support occupations, and sales & related occupations.
The employment estimates for each occupation are based on the total number of jobs worked that are reported as part of the Unemployment Insurance (UI) Covered Employment and Wages program. The BLS technical notes (http://www.bls.gov/oes/current/oes_tec.htm) relating to the OES Wage Survey include the scope of the survey, an explanation of the UI Covered Employment and Wage program, occupational classification of 22 major occupational groups, size class, and hourly intervals.
This article uses OES response data for 2010 to 2013. The data were averaged over that four-year period to determine a percent distribution in each occupation. The percent distribution was then multiplied by the 2013 (current year) total employment in order to calculate the estimated total employment in occupations below $9.25 per hour.
Results
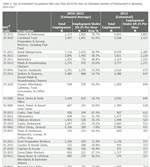 |
In May 2013 there were an estimated 29,553 workers within 117 occupations that were classified in the lowest OES wage range of under $9.25 per hour. Table 2 shows the 30 occupations by estimated highest employment that were paid less than $9.25 per hour. Of the 29,553 total estimated workers in this group, 24,610 (83.3%) were in the 30 occupations with the highest estimated employment.
Ten of these top 30 occupations were in food preparation & serving related occupations. Out of the 117 occupations making less than $9.25 per hour, waiters & waitresses had the highest employment, with 3,803 workers. Combined food preparation & serving workers, including fast food, had the second highest employment, with 3,427 workers.
Five of the top 30 estimated occupations making less than $9.25 per hour with the highest number of workers were in office & administrative support occupations: stock clerks & order fillers (640); hotel, motel, & resort desk clerks (618); office clerks, general (431); secretaries & administrative assistants, except legal, medical, & executive (230), and customer service representatives (229).
Two occupations in sales & related occupations were included in the top 30 estimated occupations shown in Table 2: retail salespersons (2,285) and cashiers (2,229).
References
House Bill No. HB0024. (2014). Wyoming State Legislature. Retrieved June 2, 2015, from http://legisweb.state.wy.us/2015/bills/HB0024.pdf
U.S. Bureau of Labor Statistics. (2010, February). 2010 SOC User Guide. Retrieved June 2, 2015, from http://www.bls.gov/soc/soc_2010_user_guide.pdf
U.S. Bureau of Labor Statistics. (2015, March). Technical notes for May 2014 OES estimates. Retrieved June 18, 2015, from http://www.bls.gov/oes/current/oes_tec.htm