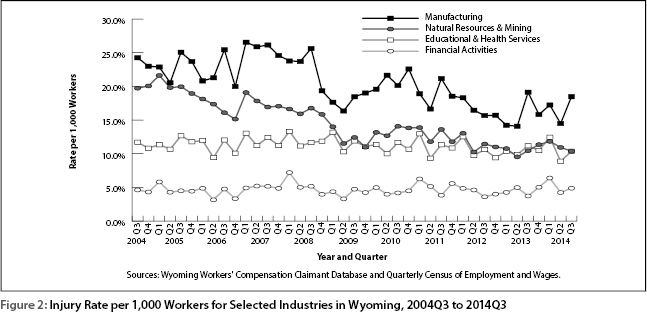
Workers’ Compensation Claims Continue Downward Trend
(Table and Figures)
| NAICS Group |
Average Rate of Injury per 1,000 Workers |
Average Employment |
|---|---|---|
|
Sources:
Wyoming Workers' Compensation Claimant Database. Quarterly Census of Employment and Wages. |
||
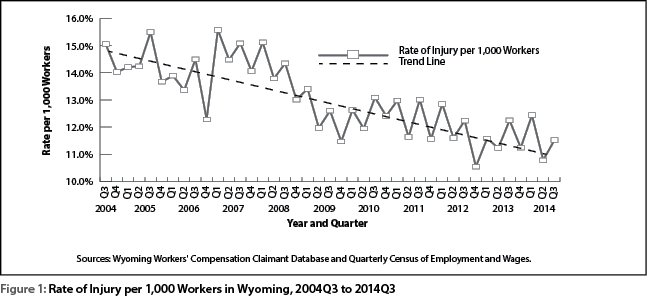
| Manufacturing | 20.3 | 10,187 |
| Construction | 17.3 | 23,431 |
| Natural Res. & Mining | 14.6 | 28,551 |
| Other Services | 12.0 | 8,267 |
| Trade, Transp., & Utilities | 11.7 | 52,373 |
| Leisure & Hospitality | 11.6 | 34,532 |
| Education & Health Svcs. | 11.2 | 58,074 |
| Public Administration | 6.6 | 24,775 |
| Information | 6.3 | 4,623 |
| Prof. & Business Svcs. | 6.0 | 17,672 |
| Financial Activities | 4.7 | 11,009 |
| Total | 13.0 | 273,494 |