Demographics and Earnings of Persons Working in Wyoming
by County, Industry, Age, & Gender, 2000-2018
Table of Contents | Introduction | Definitions | Articles | Home
Tables by Industry, County, Age, & Gender, 2000-2018 (Excel)
Published October 2019.
The Demographics of Wyoming’s Workforce in 2018
by: Michael Moore, Editor
See tables and figures for this article.
Originally published in the August 2019 issue of Wyoming Labor Force Trends.
dIn 2018, there were 343,836 individuals working in Wyoming at any time: 46.4% men, 40.2% women, and 13.4% nonresident workers for whom demographic data are not available. In addition, one in five persons (20.0%) working in Wyoming in 2018 was age 55 or older.
Each year, the Research & Planning (R&P) section of the Wyoming Department of Workforce Services publishes detailed demographics tables of Wyoming’s workforce by industry and county of employment. Complete demographics tables from each calendar year from 2000 to 2018 are available online. This article serves as an introduction to those tables, with a focus on demographics at the county and industry levels.
The numbers of individuals working in Wyoming presented in this article are based on employers’ quarterly wage and employment reports to the Unemployment Insurance (UI) tax section of the Wyoming Department of Workforce Services; these are referred to as wage records. As noted by Bullard (2015), UI covered employment represents approximately 91.5% of Wyoming’s total wage and salary employment. Any individual who had wages in Wyoming at any time from 2000 to 2018 is included in the summary counts presented in this chapter. Each individual is counted only once.
By linking the Wage Records database with other administrative databases, such as the driver’s license file from the Wyoming Department of Transportation, R&P is able to identify demographic information and other variables for each county and industry, including number of persons working, average annual wages, average number of quarters worked, average number of employers, gender, and age.
This article provides a sample of the type of research that can be accomplished by linking wage records to other administrative databases. Further examples can be found online at https://doe.state.wy.us/LMI/wagerecords.htm. A related article on Wyoming’s changing demographics can be found here, or on page 8 of the August 2019 issue of Wyoming Labor Force Trends.
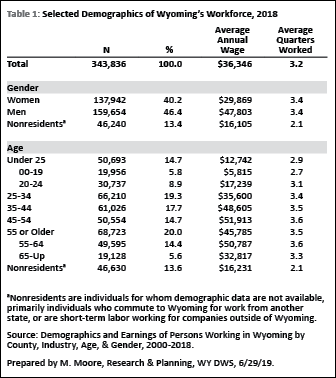
There were 343,836 individuals working in Wyoming at any time in 2018, 40.2% of whom were women, while 46.4% were men (see Table 1). The remaining 13.4% were nonresidents, or individuals for whom demographic data are not available. Nonresidents are primarily individuals who commute to Wyoming for work from another state, or are short-term labor working for companies based outside of Wyoming. Women had an average annual wage of $29,869, compared to the average annual wage of $47,803 for men. Both women and men worked 3.4 quarters of the year on average. Nonresidents had an average annual wage of $16,105 and worked 2.1 quarters on average.
Table 1 also shows that one in five persons (20.0%) working in Wyoming at any time in 2018 was age 55 or older. Individuals ages 25-34 made up 19.3% of the total, followed by ages 35-44 (17.7%) and ages 45-54 and under 25 (14.7% each). The 45-54 age group had the highest average wage ($51,913) and the greatest average number of quarters worked (3.6).
Demographics by Industry
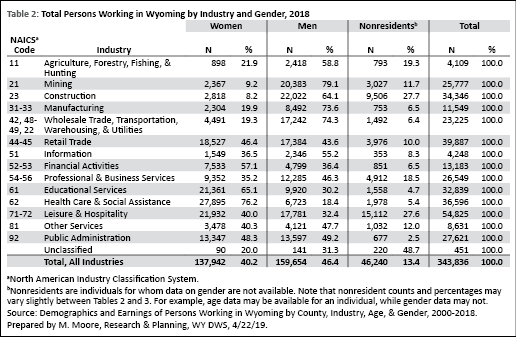
As shown in Table 2, the distribution of persons working in Wyoming in 2018 varied by industry. Women comprised the majority of all persons working in industries such as health care & social assistance (76.2%), educational services (65.1%), and financial activities (57.1%), while men accounted for the largest proportion of all persons working in mining (79.1%), wholesale trade, transportation, warehousing, & utilities (74.3%), and manufacturing (73.6%). Some industries had a high percentage of nonresident workers, including construction (27.7%) and leisure & hospitality (27.6%).
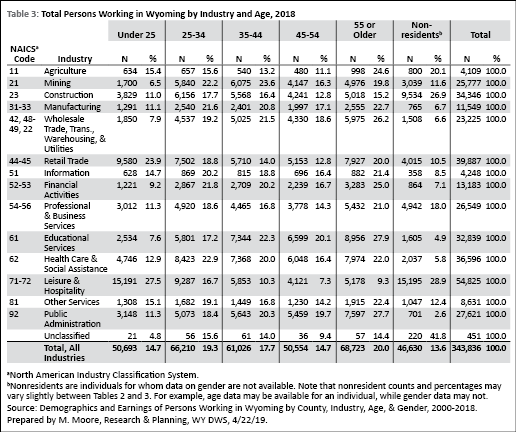
Table 3 shows the differences in persons working in Wyoming by industry and age. Some industries employed large proportions of younger workers under age 25, including leisure & hospitality (27.5%) and retail trade (23.9%). In some industries, more than one in four (25.0%) workers were age 55 or older; this included educational services (27.9%), public administration (27.7%), and wholesale trade, transportation, warehousing, & utilities (26.2%). Prior research from R&P showed that those industries with a high concentration of individuals age 55 or older were also industries with a high percentage of jobs that required a bachelor’s degree or higher. Glover (2012) noted that:
“Wyoming youth appear to have difficulty finding jobs in industries that require a higher education, such as health care & social assistance, educational services, and public administration. Members of the [baby] boom generation (those born between 1946 and 1964) tend to hold onto jobs in these industries longer, reducing the opportunities for younger workers.”
Since 2011, the number of workers reaching the traditional retirement age of 65 has increased substantially each year. Industries that have a high percentage of jobs requiring at least a bachelor’s degree and a large proportion of workers age 55 or older may present future employment opportunities for younger Wyoming workers with a postsecondary education.
Demographics by County of Employment
In many of Wyoming’s least populous counties, women made up the greatest proportion of people working in 2018, including Niobrara (53.5%), Goshen (48.3%), and Hot Springs (48.0%) counties (see Table 4). The counties with the greatest proportions of men working in 2018 were those with a large presence of jobs related to mining, including oil & gas, such as Campbell (53.6%), Sweetwater (51.9%), Natrona (49.8%), and Sublette (49.6%) counties. In Teton County, which relies on large numbers of out-of-state workers to fill tourism-related jobs, more than one-third (38.9%) of all workers were nonresidents in 2018.
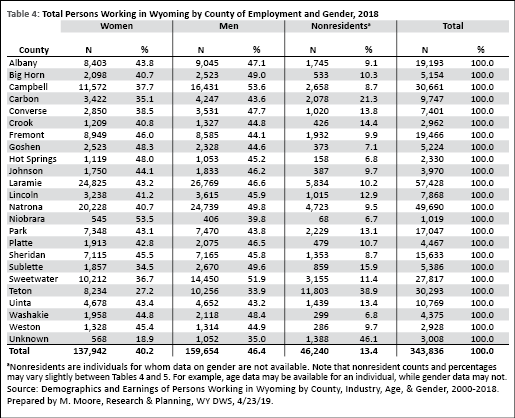
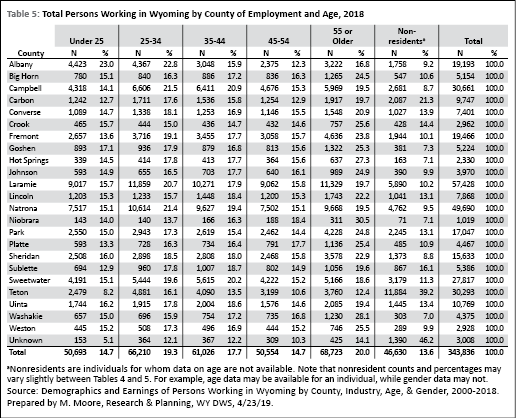
Table 5 shows that Albany County had the largest proportion of workers younger than 25 (23.0%), likely due to the number of college students living in that county. Many smaller, more rural counties had a greater proportion of workers 55 or older, including Niobrara (30.5%), Washakie (28.1%), Hot Springs (27.3%), Crook (25.6%), and Weston (25.5%) counties.
Conclusion
In 2018, 20.0% of all persons working in Wyoming at any time were age 55 or older, meaning that one in every five workers will reach the traditional retirement age of 65 within the next 10 years. A related article on page 8 of the August 2019 issue of Wyoming Labor Force Trends provides additional context about several factors that helped shape the state’s workforce in 2018, such as economic conditions, population changes, and demographic trends.
References
Bullard, D. (2015, January). Local jobs and payroll in Wyoming in second quarter 2014: Construction leads job growth. Wyoming Labor Force Trends, 52(1). Research & Planning, Wyoming Department of Workforce Services. Retrieved April 24, 2019, from https://doe.state.wy.us/LMI/trends/0115/qcew.htm
Glover, T. (2012). A Decade Later: Tracking Wyoming’s Youth into the Labor Market. Retrieved March 19, 2019, from https://doe.state.wy.us/LMI/w_r_research/A_Decade_Later.pdf


.svg)
 Wyoming at Work