Wage Records in Wyoming, 2000-2016
Demographics of Two Economic Downturns in Wyoming
by: Lynae Mohondro, Senior Research Analyst
The Bureau of Labor Statistics (BLS) and the U.S. Census Bureau conduct the Current Employment Statistics and American Community Survey. These surveys collect data on industry job loss and hours worked. At the state level, small sample sizes result in unreliable data. To maintain reliability of data on hours worked in Wyoming, the Research & Planning (R&P) section of the Wyoming Department of Workforce Services uses hours worked data from the Wage Records database. R&P has published data on the number of hours worked for the first time in Demographics of Persons Working in Wyoming by County, Industry, Age, & Gender, 2000-2016, available online at http://doe.state.wy.us/LMI/earnings_
tables.htm.
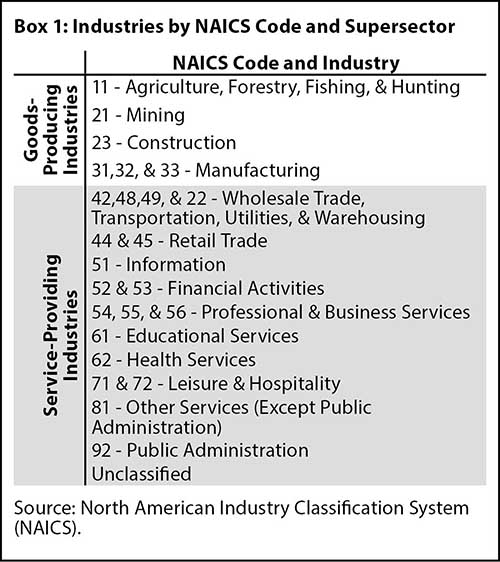
Wyoming’s reliance on the oil and gas industry leads to rapid fluctuations in economic expansion and contraction. According to the National Bureau of Economic Research (NBER, 2010), the national Great Recession lasted from November 2007 to June 2009. To some degree, this overlapped Wyoming’s previous economic downturn, which lasted from first quarter 2009 (2009Q1) to first quarter 2010 (2010Q1). In general, firms avoid layoffs at the beginning of a recession by reducing employee hours, and increase employee hours at the end of a recession before hiring new employees (Stewart, 2014). During the Great Recession, the goods-producing sector in the U.S. lost a higher percentage of jobs than the service-providing sector (Aliprantis, 2012). Box 1 shows goods-producing and service-providing industries as defined by the North American Industry Classification System (NAICS).
During times of recession or economic downturn, the workforce tends to become older and more experienced, due to layoffs of younger, less experienced workers (BLS, 2016). Overall, younger males experience the greatest fluctuations in employment and hours worked during national recessions (Laroque & Osotimehin, 2015). To illustrate these points, R&P has published several tables that show the change in employment and hours worked in Wyoming from 2008 to 2010 (previous downturn, 2009Q1 to 2010Q1) and 2014 to 2016 (most recent downturn, 2015Q2 to 2016Q4). This article includes sample tables extracted from the full tables, which are available at http://doe.state.wy.us/LMI/earnings_tables.htm.
Previous Downturn: 2009Q1-2010Q1
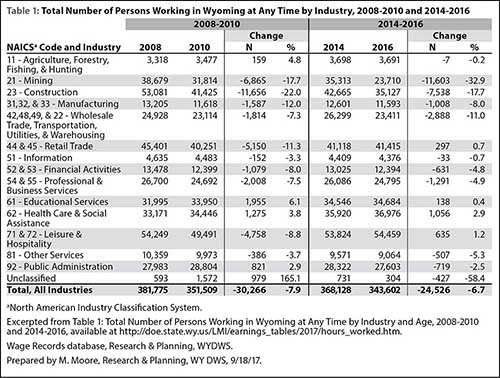
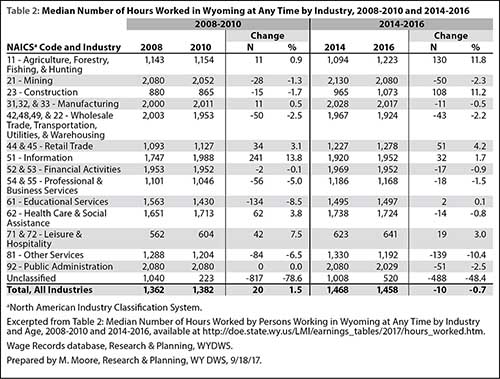
Wyoming’s goods-producing sector lost a higher percentage of workers than the service-providing sector during the previous downturn. The number of persons working in construction in Wyoming decreased by 11,656, or -22.0%, from 2008 to 2010 (see Table 1), while the median number of hours worked in construction decreased by 15, or -1.7% (see Table 2). In contrast, the number of persons working in educational services and health care & social assistance increased by 6.1% and 3.8%, respectively. The median number of hours worked decreased in educational services (-8.5%) but increased in health care & social assistance (3.8%).
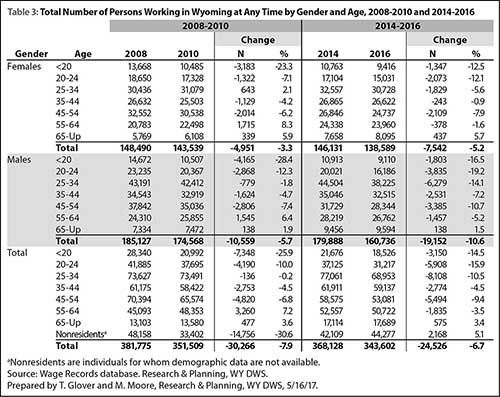
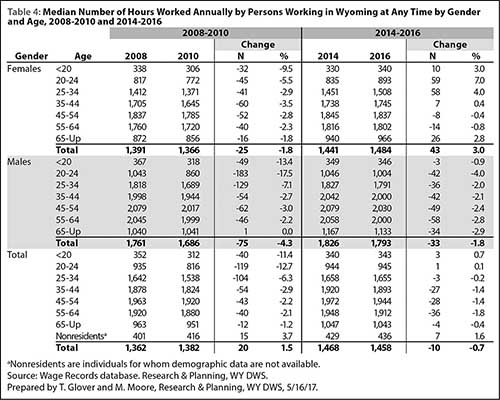
As previously mentioned, the workforce tends to become older during times of economic downturn since younger workers are the most likely to lose their jobs. This can be seen in Table 3, which shows that workers younger than 20 (-25.9%) and ages 20-24 (-10.0%) lost jobs at a greater rate than the statewide average (-7.9%) during the previous downturn. As shown in Table 4, younger workers also experienced the greatest decrease in the number of hours worked (-11.4% for those younger than 20, and -12.7% for those ages 20-24). In comparison, the number of individuals ages 55-64 working at any time increased 7.2% with a 2.1% decrease in hours worked, and the number of workers ages 65 and older increased 3.6% with a 1.2% decrease in hours worked.
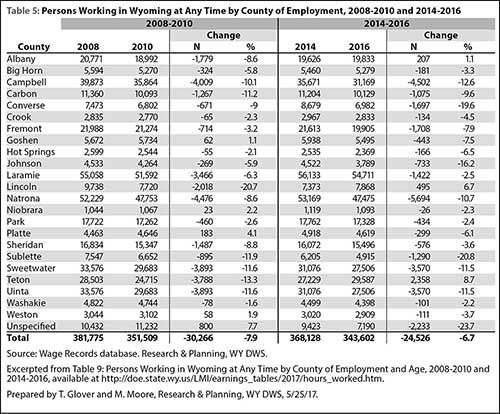
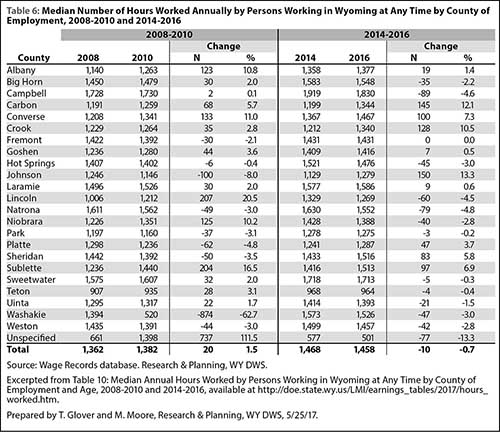
Counties that rely on goods-producing industries experienced greater fluctuations in employment and hours worked. During the previous downturn, the largest percentage decrease of persons working occurred in Lincoln County (-20.7%, see Table 5), which also experienced a 20.5% increase in the median number of hours worked (see Table 6). The largest growth occurred in Platte County, where the number of workers increased 4.1% and the hours worked decreased 4.8%.
During the previous downturn, there was a greater decrease in the number of males (-10,559, or -5.7%) than females (-4,951, or -3.3%) working in Wyoming at any time (see Table 3). During this time, the median number of hours worked by males decreased by 4.3%, compared to a decrease of 1.8% for females (see Table 4).
Recent Downturn: 2015Q2-2016Q4
From 2014 to 2016, mining experienced the greatest decrease in the number of persons working at any time (-11,603, or -32.9%), followed by construction (-7,538, or -17.7%; see Table 1). The median number of hours worked decreased in mining (-2.3%) and increased in construction (11.2%; see Table 2). This may be an indication that employers in the construction industry attempted save money with layoffs and longer workdays for remaining employees. During the same time, the number of persons working in health care at any time increased 2.9%, while the median number of hours worked decreased by 0.8%. This indicates that health care & social assistance was not as negatively affected by the downturn as construction.
Younger workers appear to have lost jobs at a greater rate than older workers during the recent downturn. As shown in Table 3, the number of persons working in Wyoming at any time decreased by 6.7% from 2014 to 2016, and the greatest percentage decreases were seen among workers younger than 20 (-14.5%), ages 20-24 (-15.9%), and ages 25-34 (-10.5%). All three groups experienced relatively little change in the median number of hours worked (see Table 4). The number of older persons working in Wyoming fluctuated less from 2014 to 2016; the number of workers ages 55-64 decreased by 3.5%, while the number of workers ages 65 and older increased by 3.4%.
Wyoming experienced less of a decrease in the number of persons working during the recent downturn (-24,256, or -6.7%) compared to the previous downturn (-30,266, or -7.9%; see Table 3). However, the decrease in the number of resident males (-19,152, or -10.6%) and resident females (-7,542, or -5.2%) was much greater than during the previous downturn (-10,559, or -5.7% for males and -4,951, or -3.3% for females). During the previous downturn, the greatest decrease in persons working was seen in nonresidents (-14,756, or -30.6%), or out-of-state workers for whom demographic data are not available. As shown in Table 4, the median number of hours worked by females increased by 3.0% during the recent downturn, compared to a decrease of 1.8% during the previous downturn. Males experienced less of a decrease in the median number of hours worked during the recent downturn (-1.8%) compared to the previous downturn (-4.3%).
During the recent downturn, the greatest percentage decrease in the number of persons working was seen in Sublette County (-20.8%; see Table 5), which depends heavily on the oil & gas industry. The median number of hours worked in Sublette County increased by 6.9% (see Table 6). The most growth occurred in Teton County (8.7%), where median hours worked decreased by 0.4%.
Over the same time period, the most growth occurred in Teton County (8.7%), where the hours worked decreased 0.4%.
Conclusion
Employers choose to hire, layoff, and adjust hours worked depending on the health of the economy. The tables available at http://doe.state.wy.us/
LMI/earnings_tables.htm show how employment and hours worked can differ among counties, industries, age, and gender during times of economic contraction. As discussed earlier, economic recessions and downturns tend to affect younger males more than any other demographic group. In addition, goods-producing industries and the counties that rely upon those industries are the most affected. This information is useful in targeting the groups of people that may need additional help locating work during periods of economic downturn.
References
Aliprantis, D. (2012, August 29). The Great Recesson’s impact on hours worked and employment. Cleveland Federal Reserve. Retrieved July 17, 2017, from https://www.clevelandfed.org/newsroom-and-events/publications/economic-trends/2012-economic-trends/et-20120829-the-great-recessions-impact-on-hours-worked-and-employment.aspx
Laroque, G., & Osotimehim, S. (2015). Fluctuations in hours of work and employment across age and gender. Institute for Fiscal Studies. Retrieved July 21, 2017, from https://www.ifs.org.uk/uploads/
publications/wps/WP201503.pdf
Stewart, J. (2014). The importance and challenges of measuring work hours. IZA World of Labor. Retrieved July 17, 2017, from https://wol.iza.org/articles/importance-and-challenges-of-measuring-work-hours/long
National Bureau of Economic Research. (2010, September 20). U.S. business cycle expansions and contractions. Retrieved July 21, 2017, from http://www.nber.org/cycles.html
U.S. Bureau of Labor Statistics. (2016, March 24). Multifactor productivity. Changes in composition of labor for BLS multifactor productivity measures, 2014. Retrieved July 21, 2017, from https://www.bls.gov/mfp/mprlabor.pdf
This article was originally published in the August 2017 issue of Wyoming Labor Force Trends.

