Employment Situation in States Along the Rockies Express Pipeline Route
Since the earliest days of energy production in pre-statehood Wyoming, producers have been looking for ways to transport their goods to customers without shedding too much of their profit in the process. The delivery system that began as wagon tracks through the sagebrush now forms a spider web of oil and natural gas pipelines throughout the state and beyond. Many of these lines are relatively short intracounty lines, interconnected parts of the gathering system. Others, such as the Wyoming-to-California Kern River Pipeline are mammoth, multi-state conduits. In recent years, limited pipeline capacity has led to lower prices for natural gas produced in Wyoming than for gas produced in areas of the country where pipeline capacity is less competitive (Leonard, 2008).
With the recent completion of the 1,679-mile,
Colorado-to-Ohio Rockies Express natural gas pipeline (see Map),
a price differential that at times was as much as $4 per thousand cubic
feet has virtually disappeared (Curran & 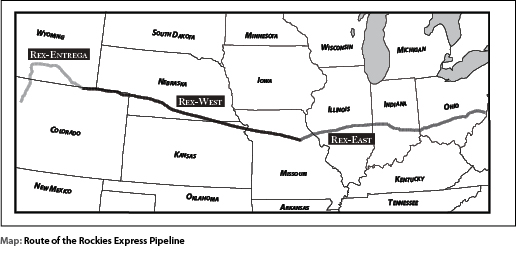 Farquhar, 2009). According to the U.S. Energy Information Administration, the completion of the three-segment pipeline in 2009 differs from most of the pipeline expansions and capacity-increasing projects of 2008 in that the previous projects had primarily expanded capacity along existing distribution routes. The new pipeline has changed regional distribution dynamics that have been in place since the construction boom following World War II (Energy Information Administration, 2009).
Regression analysis by Research & Planning (R&P) has shown that natural gas prices from 2000 to 2005 were highly correlated with the number of jobs in oil and gas, and crude oil prices explained much of the variation in oil and gas employment from 1971 to 1986 (Wen, 2005).
However, a larger contributor to gas prices is domestic demand, and that demand will be determined in large part by the health of the economies at the eastern end of the pipeline and points beyond. According to the Energy Information Administration, 30 states and the District of Columbia are 85% or more dependent upon the interstate pipeline network for their natural gas supply (Energy Information Administration, 2007). Generally speaking, these states are in the Northeast, Southeast, Midwest, and along the West Coast.
Because the customer base and geographic distribution of consumption is relatively known, we may well anticipate the rate at which Wyoming’s natural gas commodity market can expect to be stimulated as certain regions of the country pull out of the recession.
This article offers a brief look at natural gas consumption and the employment situation in those states along the Rockies Express pipeline. Unless otherwise noted, total nonfarm employment data were collected for each of the states through the Bureau of Labor Statistics’ Current Employment Statistics survey custom table creation tool (http://data.bls.gov/cgi-bin/dsrv?sm) and are seasonally adjusted. For an explanation of seasonal adjustment, see the footnote on page 20. Unemployment insurance claims data were collected via the Employment and Training Administration’s Monthly Program and Financial Data tool (http://www.ows.doleta.gov/unemploy/claimssum.asp).
Natural Gas Consumption
As Table 1 shows, the largest consumers of
natural gas in the nation are 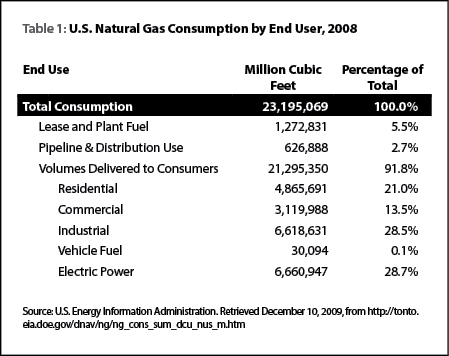 electric power generation and industrial
use (28.7% and 28.5% of total consumption for 2008, respectively). Residential
use makes up a little more than one-fifth (21.0%) of total consumption.
And while use of natural gas for electrical power has increased in the
nation over the past decade, industrial use has declined (see Figure
1;
U.S. Energy Information
electric power generation and industrial
use (28.7% and 28.5% of total consumption for 2008, respectively). Residential
use makes up a little more than one-fifth (21.0%) of total consumption.
And while use of natural gas for electrical power has increased in the
nation over the past decade, industrial use has declined (see Figure
1;
U.S. Energy Information 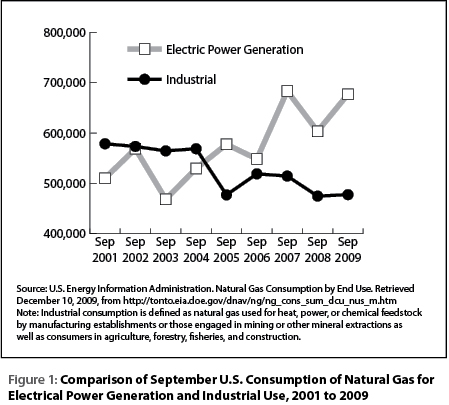 Administration, 2009a). Part of the decline in
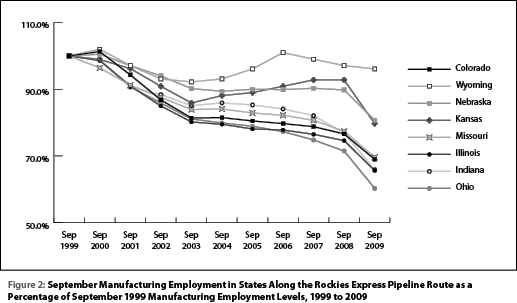
industrial consumption is due to the decline in manufacturing. As Figure
2 shows (see page 11), manufacturing employment in the states along the
Rockies Express pipeline route has declined since
Administration, 2009a). Part of the decline in
industrial consumption is due to the decline in manufacturing. As Figure
2 shows (see page 11), manufacturing employment in the states along the
Rockies Express pipeline route has declined since 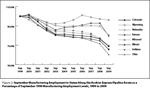 1999. However, the use
of natural gas for electrical power generation and new access to a large
percentage of the nation’s residential gas customers may bode well for
Wyoming and Rocky Mountain gas producers.
1999. However, the use
of natural gas for electrical power generation and new access to a large
percentage of the nation’s residential gas customers may bode well for
Wyoming and Rocky Mountain gas producers.
Electrical Power Generation
Of the top 10 states in terms of natural gas consumption for electrical power, only New York and New Jersey are east of the terminus of the new pipeline. Combined, they represented 8.5% of total consumption for power generation in 2008.
Industrial use
Although industrial consumption of natural gas has been declining nationally, 4 of the top 10 states for natural gas consumption for industrial purposes are along the pipeline or near its terminus. Indiana, Ohio, Illinois, and Pennsylvania together represent 15.4% of the national consumption for industrial power.
Residential use
Eight of the top 10 states for consumption of natural gas for residential use are within 500 miles of the pipeline or its terminus. Illinois, New York, Michigan, Ohio, Pennsylvania, New Jersey, Indiana, and Wisconsin combined represent 46.2% of the nation’s residential consumption of natural gas.
According to the Energy Information Administration’s (EIA) Short-Term Outlook for December 8, 2009, overall natural gas consumption for 2009 is expected to be down by 1.9%, and by an additional 0.4% in 2010 (2009b). EIA expects the Henry Hub spot price for 2010 to be $0.67 higher than the estimated 2009 price, despite record-high working inventories of natural gas and lower consumption due to mild weather in November. The EIA also expects natural gas’ share of electrical power generation to fall from 22% to 21% due to lower coal prices and increased capacity from renewable sources, including wind power.
Employment by State: A Measure of Potential Gas Consumption
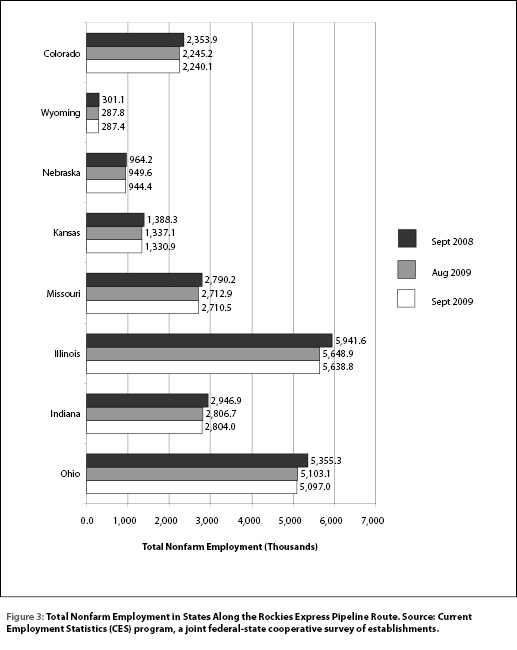
As Figures 3 and 4 show (see pages 12 and 13, respectively), 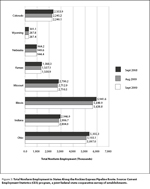 employment
levels in each of the eight states along the new pipeline have declined
over the past year, but Wyoming’s employment level for September 2009 increased
dramatically from 1999 to 2009.
employment
levels in each of the eight states along the new pipeline have declined
over the past year, but Wyoming’s employment level for September 2009 increased
dramatically from 1999 to 2009. 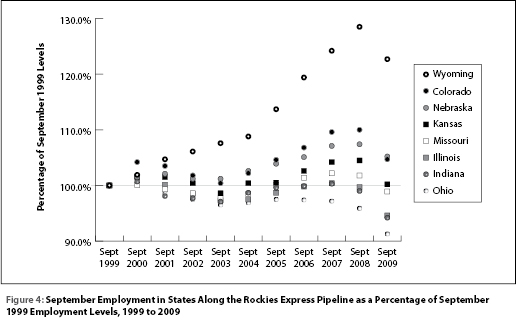 Employment levels in the four easternmost
states on the pipeline – Missouri, Illinois, Indiana, and Ohio – were lower
in September 2009 than in September 1999. Unemployment insurance claims
in most of the states along the pipeline route increased over the year
from September 2008 to September 2009, but had decreased over the month
from August. Seasonally adjusted unemployment rates for all but three states
declined from August to September but remained higher over the year. In
Illinois and Wyoming, the unemployment rate increased over the month, and
in Missouri it was unchanged. Research & Planning publishes unemployment rates for all states each month in Wyoming Labor Force Trends; readers may want to watch the following states’ rates to gain a better sense of where the natural gas market is headed.
Employment levels in the four easternmost
states on the pipeline – Missouri, Illinois, Indiana, and Ohio – were lower
in September 2009 than in September 1999. Unemployment insurance claims
in most of the states along the pipeline route increased over the year
from September 2008 to September 2009, but had decreased over the month
from August. Seasonally adjusted unemployment rates for all but three states
declined from August to September but remained higher over the year. In
Illinois and Wyoming, the unemployment rate increased over the month, and
in Missouri it was unchanged. Research & Planning publishes unemployment rates for all states each month in Wyoming Labor Force Trends; readers may want to watch the following states’ rates to gain a better sense of where the natural gas market is headed.
Colorado
From September 2008 to September 2009, total nonfarm payroll employment
in Colorado declined by 112,100 jobs. Over that period, the state lost
28,300 jobs in professional & business services and 25,600 jobs in construction. According to the Colorado Department of Labor and Employment, the three slowest growing industries are computer and electronic product manufacturing, support activities for mining, and construction of buildings (Colorado Department of Labor & Employment, 2009a) – all relatively high paying industries. Employment on Colorado’s 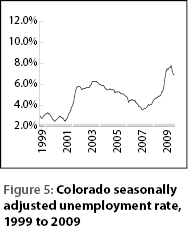 Western Slope, where the Rockies Express originates, is heavily dependent upon mining and oil and gas development. Local communities likely will see a benefit if the price differential between Rockies Express natural gas and natural gas sold elsewhere remains small. The September 2009 unemployment rate for Colorado was 7.0%, a decrease from August (7.3%; see Figure
5), but higher than the September 2008 rate, 5.0% (Colorado, 2009b).
Initial unemployment claims were 156.8% higher in September 2009 than they were a year earlier, while continued weeks claimed for the month were 231.3% higher than for September 2008 (Employment & Training Administration, 2009).
Western Slope, where the Rockies Express originates, is heavily dependent upon mining and oil and gas development. Local communities likely will see a benefit if the price differential between Rockies Express natural gas and natural gas sold elsewhere remains small. The September 2009 unemployment rate for Colorado was 7.0%, a decrease from August (7.3%; see Figure
5), but higher than the September 2008 rate, 5.0% (Colorado, 2009b).
Initial unemployment claims were 156.8% higher in September 2009 than they were a year earlier, while continued weeks claimed for the month were 231.3% higher than for September 2008 (Employment & Training Administration, 2009).
Wyoming
From first quarter 1988 through fourth quarter 2008, Wyoming’s unemployment insurance-covered employment grew – a stretch of economic expansion in which Wyoming total payroll topped the $3 billion mark in September 2008 and a record was set for number of jobs in the state (294,463). But in first quarter 2009, the 21-year streak of over-the-year growth ended, as the national recession that began in December 2007 began to show effects in Wyoming. Total payroll declined by $36.0 million, and job growth fell to -1.1%. Employment declined by 3,535 jobs in construction, and by 1,121 jobs in retail trade. Job losses were also seen in accommodation & food services, manufacturing, and administrative & waste services. Job gains occurred in state, local and federal government and in health care & social assistance, and other services (Bullard, 2009).
Although Wyoming’s seasonally adjusted unemployment rate increased from
6.6% in August to 6.8% in September (not a statistically significant increase;
see Figure 6), it remained lower than the national rate of 9.8%. 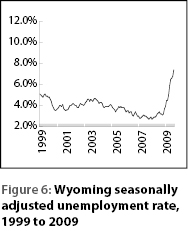 Over the
year, Wyoming employment decreased by 12,900 jobs (4.2%). The largest job
losses were in natural resources & mining (-6,000 jobs, or -19.9%) and construction (-4,600 jobs, or -15.3%). Over the month, seasonal job gains in government (5,300 jobs) were more than offset by job losses in most industry sectors. County unemployment rates for September increased in most counties, and ranged from 8.2% in Big Horn County to 3.6% in Albany County (see page 25).
Over the
year, Wyoming employment decreased by 12,900 jobs (4.2%). The largest job
losses were in natural resources & mining (-6,000 jobs, or -19.9%) and construction (-4,600 jobs, or -15.3%). Over the month, seasonal job gains in government (5,300 jobs) were more than offset by job losses in most industry sectors. County unemployment rates for September increased in most counties, and ranged from 8.2% in Big Horn County to 3.6% in Albany County (see page 25).
Initial unemployment insurance claims were 201.9% higher in September 2009 than in September 2008, but the 2,804 claims were far fewer than the 4,796 reported in March 2009. Continued weeks claimed were 335.6% higher in September 2009 than in September 2008. The 29,356 continued claims for September 2009 were considerably lower than the 36,620 for August 2009 and the peak of 43,026 for May 2009. Wyoming unemployment insurance claims are published each month in Wyoming Labor Force Trends.
Nebraska
From September 2008 to September 2009, Nebraska non-farm
employment declined by an estimated 23,434 jobs, including a decline of
9,979 manufacturing jobs. The state’s seasonally adjusted unemployment
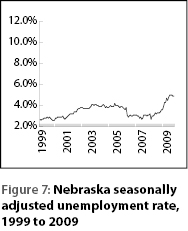 rate increased over the year from 3.4% to 4.9%, but remained far below
the national unemployment rate (see Figure 7). (Unemployment Rate Information
for September 2009)
rate increased over the year from 3.4% to 4.9%, but remained far below
the national unemployment rate (see Figure 7). (Unemployment Rate Information
for September 2009)
Nebraska’s initial unemployment claims declined from 7,634 in August 2009 to 7,159 in September, but were still higher than the 4,964 initial claims reported in September 2008. Continued claims declined from 91,709 in August to 70,911 in September, but remained nearly double the September 2008 level of 37,738.
Kansas
Kansas lost an estimated 59,700 jobs from September 2008 to September
2009, a 4.3% decrease. Among the sectors with job losses were 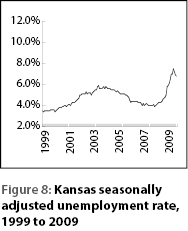 manufacturing
(-26,400 jobs), professional & business services (-13,400), and trade, transportation, & utilities (-8,700). Continued claims for unemployment insurance declined from 222,219 in August to 180,202 in September, but were still substantially higher than the 109,253 claims in September 2008. The state unemployment rate declined from 7.2% in August to 6.9% in September, but was still considerably higher than the 4.6% rate of September 2008 (see Figure
8; Kansas Department of Labor, 2009).
manufacturing
(-26,400 jobs), professional & business services (-13,400), and trade, transportation, & utilities (-8,700). Continued claims for unemployment insurance declined from 222,219 in August to 180,202 in September, but were still substantially higher than the 109,253 claims in September 2008. The state unemployment rate declined from 7.2% in August to 6.9% in September, but was still considerably higher than the 4.6% rate of September 2008 (see Figure
8; Kansas Department of Labor, 2009).
Initial unemployment insurance claims dropped from 20,750 in August 2009 to 17,574 in September, just 1,666 higher than the number for September 2008 (15,908). Continued claims declined by 43,030 over the month, but were 62.5% higher than the September 2008 level.
Missouri
Total nonfarm employment in Missouri declined by an estimated 79,700 jobs
from September 2008 to September 2009, and by 2,400 jobs from 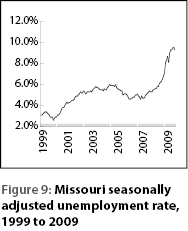 August 2009
to September 2009. The largest over-the-year losses were in manufacturing
(-29,100), construction (-18,800), and professional & business services (-15,000). Gains in educational & health services (8,600) and government (7,300) were more than offset by losses in these and other sectors (Bureau of Labor Statistics, 2009).
August 2009
to September 2009. The largest over-the-year losses were in manufacturing
(-29,100), construction (-18,800), and professional & business services (-15,000). Gains in educational & health services (8,600) and government (7,300) were more than offset by losses in these and other sectors (Bureau of Labor Statistics, 2009).
Missouri’s seasonally adjusted unemployment rate was unchanged from August to September (9.5%), and up from 6.3% in September 2008 (see Figure 9; Missouri Department of Economic Development, 2009).
Illinois
Total nonfarm employment in Illinois decreased by 302,800 from September
2008 to September 2009, and by 10,100 from August 2009 to September 2009.
The largest over-the-year job losses were in manufacturing (-79,100 jobs),
professional & business services (-72,000), and trade, transportation, & utilities (-61,100). Total employment declined from August 2009 to September 2009 by 10,100 jobs despite a gain of 8,200 in 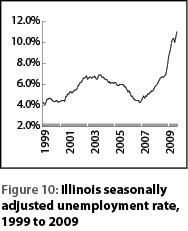 government (Illinois Department of Employment Security, 2009a).
Illinois’ seasonally adjusted unemployment rate rose from 10.0% in August to 10.5% in September. The rate in September 2008 was 6.7% (see Figure 10; Illinois Department of Employment Security, 2009b).
Initial unemployment insurance claims in Illinois increased by 21,981 from September 2008 to September 2009, but decreased from August to September by 1,924. Continued weeks claimed were up by 506,031 over the year, but down by 86,455 from August to September.
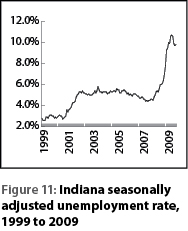
Indiana
From September 2008 to September 2009, Indiana shed an estimated 135,800 jobs, including 73,600 in manufacturing, 24,900 in trade, transportation, & utilities, and 23,800 in construction. Over-the-month job gains were seen in government (3,600 jobs), manufacturing (3,000), and professional & business services (2,900; Indiana Department of Workforce Development, 2009).
 Initial unemployment claims declined from 41,012 in September 2008 to
35,627 in September 2009 and far lower than the peak of 108,832 claims
the state hit in December 2008. Over-the-month initial claims were lower
as well, down 5,469 from August 2009. Continued claims, which peaked at
785,747 in March 2009, increased from 287,663 in September 2008 to 392,016
in September 2009, but declined from August to September by 128,213.
Initial unemployment claims declined from 41,012 in September 2008 to
35,627 in September 2009 and far lower than the peak of 108,832 claims
the state hit in December 2008. Over-the-month initial claims were lower
as well, down 5,469 from August 2009. Continued claims, which peaked at
785,747 in March 2009, increased from 287,663 in September 2008 to 392,016
in September 2009, but declined from August to September by 128,213.
Indiana’s seasonally adjusted unemployment rate rose from 6.1% in September 2008 to 9.7% in September 2009, but declined over the month from 9.9% in August (see Figure 11).
Ohio
Total nonfarm employment in Ohio decreased by 258,100 from September 2008
to September 2009, with the largest job losses in manufacturing (-115,900),
professional & business services (-54,100), and trade, transportation, & utilities
(-51,700). According to a report by the Ohio Department of Job and Family
Services, Ohio’s employment peaked in 2000, but never fully recovered from
the 2001 recession. In both goods-producing and services-providing sectors,
Ohio has underperformed U.S. averages since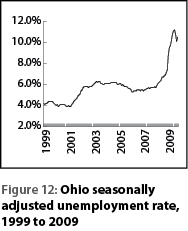 2000 (Horner, 2009).
Ohio’s seasonally adjusted unemployment rate for September 2009 was 10.1%, down from 10.8% in August 2009, but higher than the September 2008 rate of 6.8% (see Figure 12).
Initial unemployment insurance claims in Ohio fell from 75,503 in August 2009 to 67,321 in September 2009, still 1,660 higher over the year, but far lower than the peak of 144,682 from December 2008. Continued claims fell from 1,021,347 in August to 746,758 in September. There were 467,481 continued claims in September 2008.
Summary
The Wyoming economy is closely tied to natural gas production, but Rocky Mountain gas producers have historically been paid less for gas than producers in other markets because they have had to compete for limited pipeline capacity. This disparity will likely be diminished by the addition of the Rockies Express Pipeline to the nation’s gas distribution system. This new pipeline opens new markets for Wyoming natural gas, but prices will still be driven by demand in the states along the pipeline and points beyond. Use of natural gas for electrical power generation is expected to decline somewhat in the short term, but has been increasing overall since 2001. Industrial consumption has declined over the same period. Residential use makes up a smaller percentage of overall consumption, but Wyoming gas producers will now have greater access to a larger percentage of the nation’s residential gas customers. All of the states along the pipeline have seen effects of the current economic downturn, although several are showing signs of recovery through reductions in unemployment insurance claims and lower unemployment rates. Total nonfarm employment in all of the states along the pipeline was lower in September 2009 than in September 2008.
References
Bullard, D. (2009). Covered employment and wages for first quarter 2009: Jobs and payroll decrease from year-ago levels. Wyoming Labor Force Trends, 46(10), 1. Retrieved November 29, 2009, from http://doe.state.wy.us/lmi/1009/a1.htm
Bureau of Labor Statistics. (n.d.). Employment, hours, and earnings from the Current Employment Statistics survey (state and metro area). Retrieved December 10, 2009, from http://data.bls.gov/cgi-bin/dsrv?sm
Colorado Department of Labor and Employment (2009). Labor Market Facts: What Are the Slowest-Growing Jobs in an Area? Retrieved November 27, 2009, from Long-Term Industry Projections, 2008-2018.
Curran, D., & Farquhar, B. (2009, November 17). Gov celebrates opening of Rockies Express Pipeline. Wyoming Business Report. Retrieved November 24, 2009, from http://www.wyomingbusinessreport.com/article.asp?id=103047
Employment & Training Administration, United States Department of Labor. (2009). Monthly Program and Financial Data. Retrieved December 8, 2009, from http://www.ows.doleta.gov/unemploy/ claimssum.asp
Energy Information Administration. (2007). Interstate Natural Gas Supply Dependency, 2007. Retrieved November 24, 2009, from http://tinyurl.com/yhxuxnn
Energy Information Administration. (2009a). Expansion of the U.S. natural gas pipeline network: Additions in 2008 and projects through 2011. Retrieved December 21, 2009, from http://tinyurl.com/yb6hv6m
Energy Information Administration. (2009b). Short-Term Energy Outlook. Retrieved. December 21, 2009, from http://www.eia.doe.gov/emeu/steo/pub/contents.html
Horner, L., & Calig, J. (2009). In 2009 Economic analysis: Responding to recession, preparing for recovery. Ohio Department of Job and Family Services, Office. Retrieved November 29, 2009, from http://ohiolmi.com/research/2009OhioEconomicAnalysis.pdf
Illinois Department of Employment Security. (2009a) CES Monthly Statewide Data file. Retrieved December 10, 2009, from http://lmi.ides.state.il.us/cesfiles/cesmonthlysa.htm
Illinois Department of Employment Security. (2009b, November 19). National recession pushes state rate to 11.0 percent. Retrieved December 10, 2009, from http://tinyurl.com/ycgd5pm
Indiana Department of Workforce Development. (2009). Publications Lookup Tool. Monthly CES seasonally adjusted employment estimates. Retrieved December 10, 2009, from http://www.hoosierdata.in.gov/publookup/default.aspx
Kansas Department of Labor. (2009, October 21). September 2009 Labor Report. Retrieved November 29, 2009, from http://www.dol.ks.gov/lmis/newsrel/pr0910/pr0910.html
Leonard, D. W. (2008). Barriers to Growth in Wyoming’s Economy. Wyoming Labor Force Trends, 45(5), 1-11. Retrieved November 29, 2009, from http://doe.state.wy.us/lmi/0508/a1.htm
Missouri Department of Economic Development. (2009, October 14). DED releases September 2009 state jobs report. Retrieved December 10, 2009, from http://www.ded.mo.gov/cgi-bin/dispress.pl?txtpressid=219
Nebraska Department of Labor. (2009, November). Unemployment Rate Information for September 2009 (n.d.). Retrieved November 29, 2009, from http://tinyurl.com/ycyqemz
Ohio Department of Job and Family Services. (2009, October 16). Ohio and U.S. employment situation (seasonally adjusted). Retrieved December 21, 2009, from http://jfs.ohio.gov/releases/unemp/ 200910/UnempPressRelease.asp
Wen, S. (2005). Oil and gas production and the relationship between prices and employment in Wyoming. Wyoming Labor Force Trends, 42(9), 1. Retrieved November 24, 2009, from http://doe.state.wy.us/LMI/0905/a1.htm