Covered Employment and Wages for First Quarter 2009: Jobs and Payroll Decrease from Year-Ago Levels
On an over-the-year basis, employment fell by 3,059 jobs (-1.1%) and average weekly wage decreased by $1 (-0.1%) from first quarter 2008 to first quarter 2009. Job losses were reported in more than half of Wyoming counties and in 12 industry sectors.
For the first time in 21 years, the number of jobs in Wyoming and total payroll decreased from their year-ago levels. From first quarter 2008 to first quarter 2009, total unemployment insurance (UI) covered payroll decreased by $36.0 million (-1.3%). UI covered payroll represents approximately 92% of all wage and salary disbursements and 45% of personal income in the state (U.S. Bureau of Economic Analysis, 2007). Table
1 shows the sharp contrast between the payroll decline of 1.3% in first 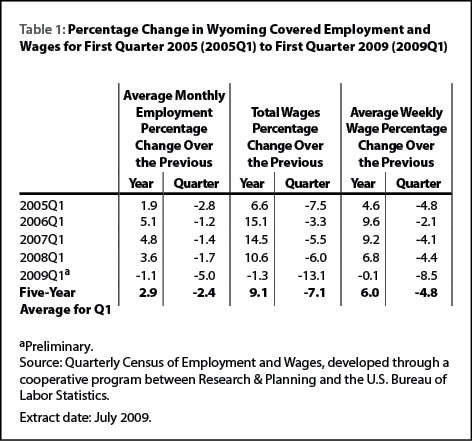 quarter 2009 and the double-digit growth seen in 2006, 2007, and 2008. Total payroll is an important economic indicator because it is often associated with consumption, retail sales, and sales tax revenue in Wyoming (Black & Evans, 1997).
The covered payroll and employment data in this article are measured by place of work in contrast to the labor force estimates, which are a measure of employed and unemployed persons by place of residence. Also, the employment data presented in this article represent a count of jobs, not persons. When individuals work more than one job, each is counted separately.
The Figure shows that wage growth
and job growth both fell sharply in 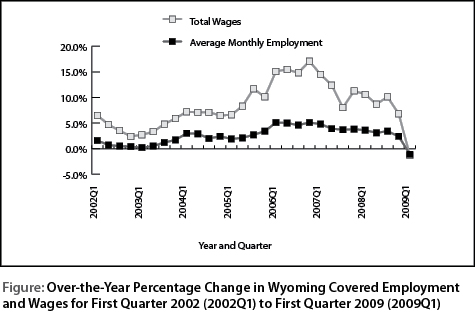 first quarter 2009. Wage growth, which stood at 10.1% in third quarter 2008, decreased to 6.8% in fourth quarter,
and then turned negative (-1.3%) in first quarter 2009 (see Table
2). Job
first quarter 2009. Wage growth, which stood at 10.1% in third quarter 2008, decreased to 6.8% in fourth quarter,
and then turned negative (-1.3%) in first quarter 2009 (see Table
2). Job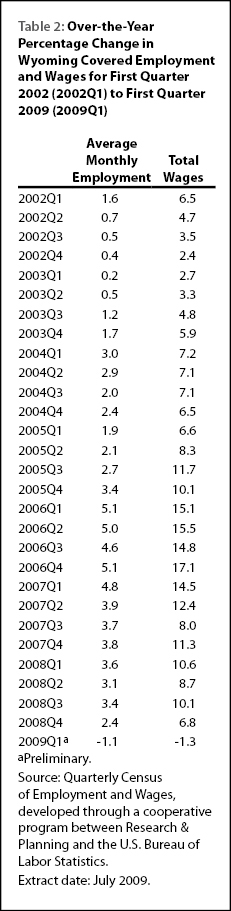 growth
fell from 3.4% in third quarter to 2.4% in fourth quarter, and then to -1.1%
in first quarter.
growth
fell from 3.4% in third quarter to 2.4% in fourth quarter, and then to -1.1%
in first quarter.
The purpose of this article is to show employment and payroll changes between first quarter 2008 and first quarter 2009. These economic changes help gauge the overall strength of Wyoming’s economy and identify the fastest and slowest growing sectors and geographic areas.
Employment and Wages by County
Table 3 shows that employment 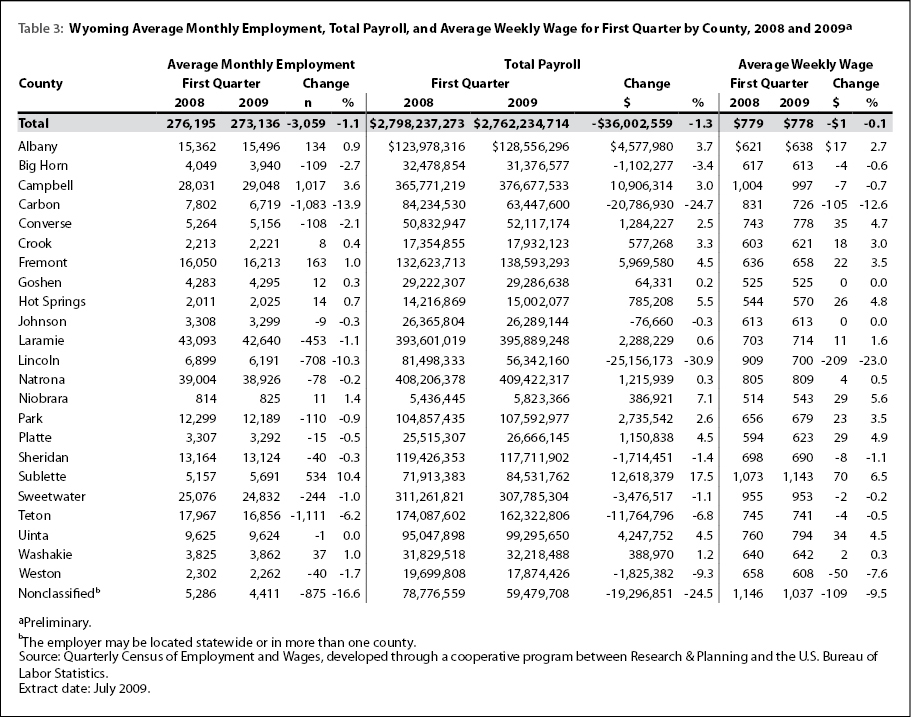 increased in 9 counties and
decreased in 14. Job losses were much more widespread than in fourth quarter
2008, when employment decreased in 4 counties.
increased in 9 counties and
decreased in 14. Job losses were much more widespread than in fourth quarter
2008, when employment decreased in 4 counties.
Campbell County added 1,017 jobs (3.6%) in first quarter 2009. Its total payroll increased by $10.9 million (3.0%). Job gains were seen in mining (more than 300 jobs), wholesale trade (approximately 200 jobs), local government (including public schools; more than 150 jobs), construction (approximately 100 jobs), and accommodation & food services (approximately 100 jobs). Employment decreased slightly in manufacturing and other services.
Sublette County’s total payroll increased by $12.6 million (17.5%) and employment grew by 534 jobs (10.4%). Mining (including oil & gas) added more than 350 jobs. Growth was also seen in wholesale trade, retail trade, transportation & warehousing, professional & technical services, and local government. Employment decreased by approximately 100 jobs in construction.
In first quarter 2009, Fremont County added 163 jobs (1.0%) and its total payroll increased by $6.0 million (4.5%). Job gains in local government, health care & social assistance, and state government were partially offset by job losses in construction, agriculture, and accommodation & food services.
Employment in Albany County rose by 134 jobs (0.9%) and total payroll increased by $4.6 million (3.7%). State government employment increased by more than 200 jobs. Job gains were also seen in health care & social assistance, professional & technical services, and local government. Job losses occurred in accommodation & food services, manufacturing, and retail trade.
In Teton County total payroll fell by $11.8 million (-6.8%) and employment decreased by 1,111 jobs (-6.2%). Job losses occurred in many sectors including accommodation & food services (more than 500 jobs), retail trade (more than 100 jobs), construction (more than 100 jobs), and arts, entertainment & recreation (approximately 100 jobs).
Carbon County lost 1,083 jobs (-13.9%) in first quarter 2009. Its total payroll decreased by $20.8 million (-24.7%). Construction posted the largest job losses (nearly 1,000 jobs), followed by mining (including oil & gas; approximately 100 jobs). It appears that part of the decrease in construction employment was related to the completion of a large project.
In Lincoln County total payroll decreased by $25.2 million (-30.9%) and employment fell by 708 jobs (-10.3%). Job gains in local government (approximately 100 jobs) were overshadowed by large job losses in construction (nearly 800 jobs). Some of the decrease in construction may have been related to the completion of a large project.
Sweetwater County lost 244 jobs (-1.0%) in first quarter. Its total payroll decreased by $3.5 million (-1.1%). Large job losses in construction (approximately 700 jobs) and administrative & waste services (approximately 100 jobs) more than offset gains in mining (including oil & gas; approximately 250 jobs) and local government (more than 100 jobs).
Employment fell by 109 jobs (-2.7%) in Big Horn County and total payroll decreased by $1.1 million (-3.4%). Mining (including oil & gas) lost more than 100 jobs, and job losses were also seen in construction, manufacturing, and retail trade. Employment increased in local government (including public schools).
Table 4 shows that Natrona County lost 78 jobs (-0.2%) in
first quarter. 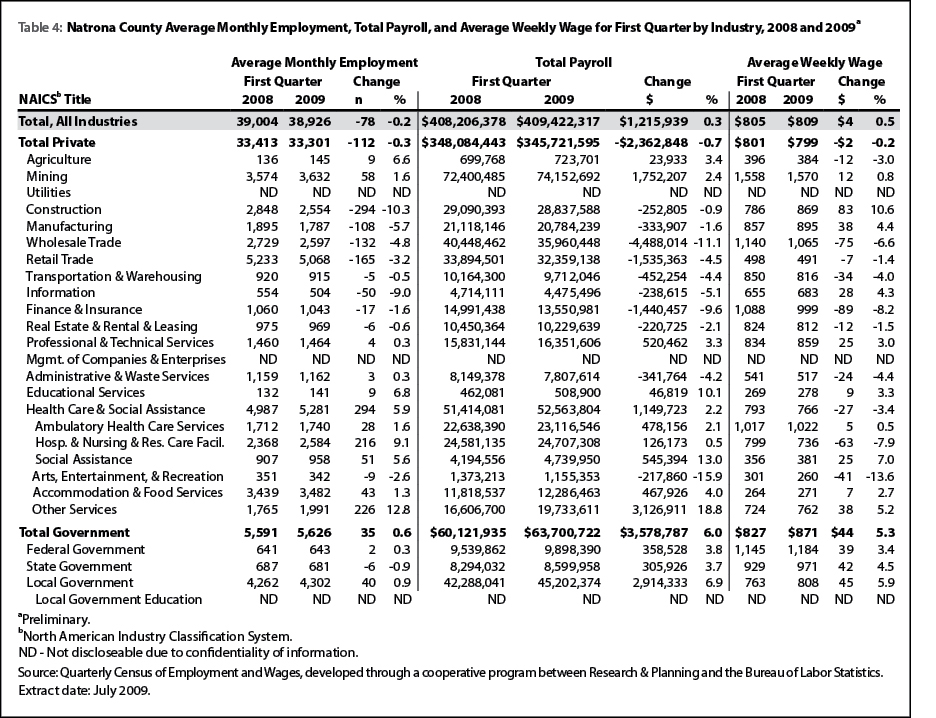 Its total payroll, however, increased by $1.2 million (0.3%).
Large job gains were seen in health care & social assistance (294 jobs, or 5.9%) and other services (226 jobs, or 12.8%). Job losses occurred in many sectors, including construction (-294 jobs, or -10.3%), manufacturing (-108 jobs, or -5.7%), wholesale trade (-132 jobs, or -4.8%), and retail trade (-165 jobs, or -3.2%).
Its total payroll, however, increased by $1.2 million (0.3%).
Large job gains were seen in health care & social assistance (294 jobs, or 5.9%) and other services (226 jobs, or 12.8%). Job losses occurred in many sectors, including construction (-294 jobs, or -10.3%), manufacturing (-108 jobs, or -5.7%), wholesale trade (-132 jobs, or -4.8%), and retail trade (-165 jobs, or -3.2%).
Employment in Laramie County fell by 453 jobs (-1.1%), but
total payroll increased by $2.3 million (0.6%; see Table
5). The largest job
gains occurred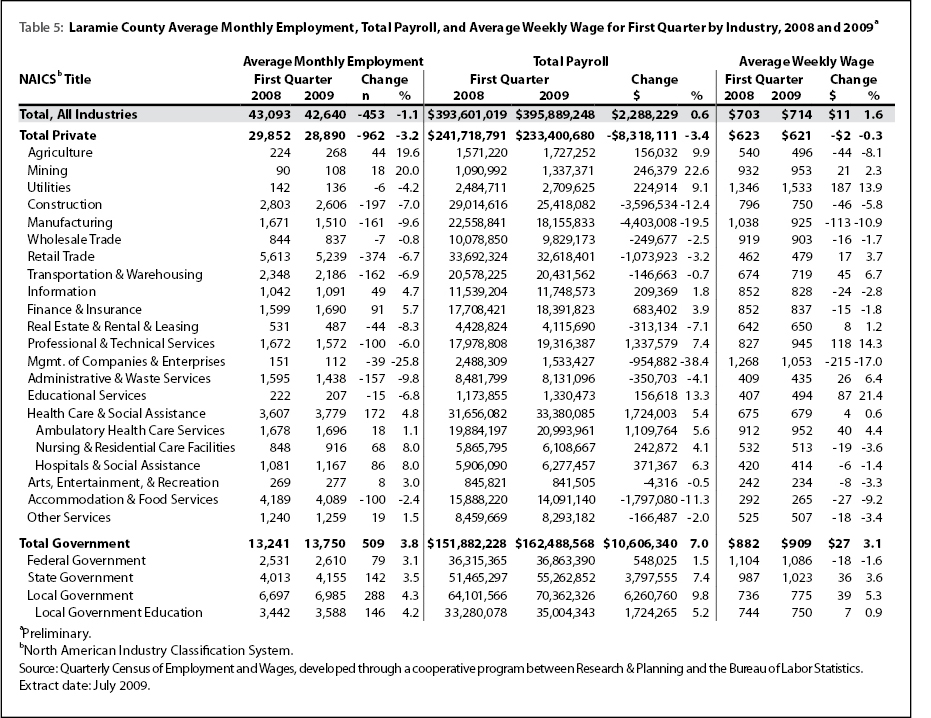 in local government (including public schools, colleges, & hospitals; 288 jobs, or 4.3%). Employment also increased in health care & social assistance (172 jobs, or 4.8%) and state government (142 jobs, or 3.5%). Sizeable job losses were seen in construction (-197 jobs, or -7.0%), manufacturing (-161 jobs, or -9.6%), retail trade (-374 jobs, or -6.7%), transportation & warehousing (-162 jobs, or -6.9%), professional & technical services (-100 jobs, or -6.0%), administrative & waste services (-157 jobs, or -9.8%), and accommodation & food services (-100 jobs, or -2.4%).
Statewide Employment and Wages by Industry
Table 6 shows that the largest job gains occurred in local
government, 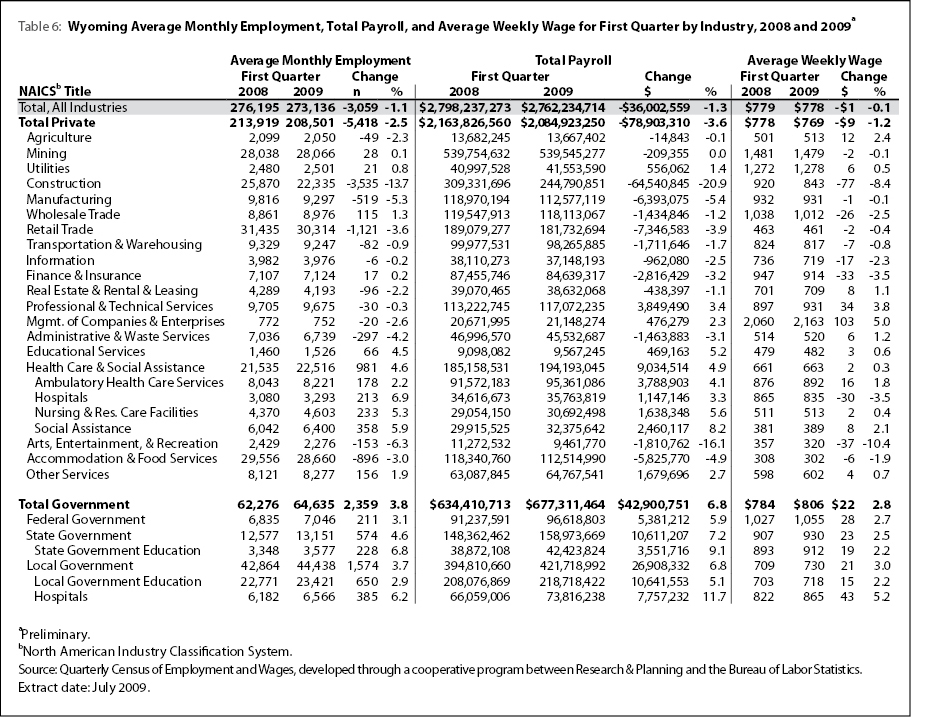 health care & social assistance, state government, federal government, other services, and wholesale trade. Substantial job losses were seen in construction, retail trade, accommodation & food services, manufacturing, and administrative & waste services.
Local government (including public schools, colleges, & hospitals) added 1,574 jobs (3.7%) and its total payroll increased by $26.9 million (6.8%). Large job gains were seen in local government education (650 jobs, or 2.9%) and hospitals (385 jobs, or 6.2%). Public administration (including cities, towns, & counties) gained approximately 250 jobs and arts, entertainment, & recreation (including gambling) added more than 150 jobs.
Health care & social assistance saw employment increase by 981 jobs (4.6%) and its total payroll rose by $9.0 million (4.9%). Social assistance added the most jobs (358 jobs, or 5.9%) followed by nursing & residential care facilities (233 jobs, or 5.3%).
Employment in state government grew by 574 jobs (4.6%) and its total payroll increased by $10.6 million (7.2%). State government education gained 228 jobs, executive, legislative, and other general government gained nearly 100 jobs, justice, public order, & safety activities gained more than 50 jobs, and administration of economic programs gained more than 50 jobs.
Federal government added 211 jobs (3.1%) in first quarter, and its total payroll increased by $5.4 million (5.9%). Hospitals added approximately 100 jobs, administration of environmental programs added approximately 50 jobs, and national security & international affairs added approximately 50 jobs.
In first quarter other services gained 156 jobs (1.9%) and its total payroll rose by $1.7 million (2.7%). The largest job gains occurred in repair & maintenance services (approximately 100 jobs), but employment also increased in personal & laundry services and membership associations & organizations.
Wholesale trade added 115 jobs (1.3%), but its total payroll decreased by $1.4 million (-1.2%). Merchant wholesalers, durable goods gained more than 100 jobs. Slight job losses were seen in electronic markets & agents & brokers.
Construction employment fell by 3,535 jobs (-13.7%) and its total payroll decreased by $64.5 million (-20.9%). Job losses occurred in construction of buildings (more than 250 jobs), heavy & civil engineering construction (approximately 2,650 jobs), and specialty trade contractors (approximately 600 jobs). It appears that the steepest job losses were seen in oil & gas pipeline and related structures construction, a sector which had grown rapidly in recent years.
Employment in retail trade decreased by 1,121 jobs (-3.6%) and its total payroll fell by $7.3 million (-3.9%). Large job losses were seen in motor vehicles & parts dealers (more than 350 jobs), nonstore retailers (more than 200 jobs), furniture & home furnishings stores (more than 100 jobs), gasoline stations (more than 100 jobs), and clothing & clothing accessories stores (more than 100 jobs).
Accommodation & food services lost 896 jobs (-3.0%) and its total payroll decreased by $5.8 million (-4.9%). Employment decreased by approximately 550 jobs in accommodation and more than 300 jobs in food services & drinking places.
Manufacturing’s total payroll decreased by $6.4 million (-5.4%) and employment fell by 519 jobs (-5.3%). Wood product manufacturing, fabricated metal product manufacturing, and transportation equipment manufacturing each lost more than 100 jobs. Employment fell slightly in many other areas of manufacturing.
Employment in administrative & waste services decreased by 297 jobs (-4.2%) and its total payroll fell by $1.5 million (-3.1%). Sizeable job losses were seen in employment services (including temporary help agencies, nearly 300 jobs) and business support services (approximately 100 jobs). Job gains were reported in waste management & remediation services, investigation & security services, and services to buildings & dwellings.
It appears that in first quarter 2009 Wyoming began to feel the effects of the national recession that began in December 2007. Job losses were seen in most counties, and in 12 industry sectors. The largest job losses occurred in construction and retail trade.
References
Black, D. & Evans, M. (1997, May). Work, pay and consumer spending, part one: Sales tax collections and total payroll. Wyoming Labor Force Trends, 34(5). Retrieved September 11, 2008, from http://doe.state.wy.us/LMI/0597/0597a2.htm
U.S. Bureau of Economic Analysis. (2007, May 15). SA04 State income and employment summary -- Wyoming. Retrieved May 15, 2007, from http://www.bea.gov/regional/spi/default.cfm
U.S. Census Bureau. (2007, August 28). 2007 NAICS codes and titles. Retrieved September 20, 2007, from http://www.census.gov/naics/2007/NAICOD07.HTM