Wyoming Normalizeda Unemployment Insurance Statistics: Continued Claims
by: Douglas
W. Leonard, Senior Economist
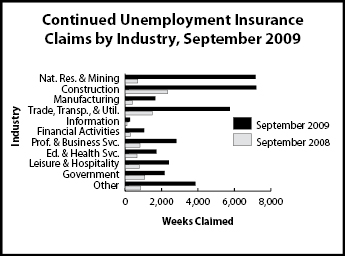
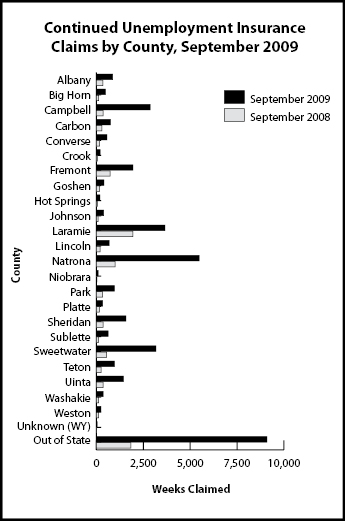
Continued weeks claimed fell by nearly 10 percent compared to August, but were still nearly quadruple the level seen one year ago. The over-the-month decline is contrary to the historic seasonal pattern.
|
|
Percent
Change Weeks Claimed |
|
Continued Weeks Claimed |
Sep 09 |
Sep 09 |
|
Sep 09 |
Aug 09 |
Sep 08 |
Aug 09 |
Sep 08 |
|
|
|
|
|
|
| Wyoming Statewide |
|
|
|
|
|
| Total Continued
Weeks Claimed |
37,215 |
41,224 |
9,719 |
-9.7 |
282.9 |
| Total Unique
Claimants |
8,875 |
11,544 |
2,804 |
-23.1 |
216.5 |
| Benefit Exhaustions |
1,249 |
1,341 |
220 |
-6.9 |
467.7 |
| Benefit Exhaustion
Rates |
14.1% |
11.6% |
7.8% |
2.5% |
6.2% |
| Goods-Producing |
16,016 |
18,441 |
3,415 |
-13.2 |
369.0 |
| Natural Resources and Mining |
7,164 |
9,147 |
689 |
-21.7 |
939.8 |
| Mining |
6,964 |
8,860 |
640 |
-21.4 |
988.1 |
| Oil & Gas Extraction |
359 |
408 |
140 |
-12.0 |
156.4 |
| Construction |
7,201 |
7,431 |
2,332 |
-3.1 |
208.8 |
| Manufacturing |
1,651 |
1,863 |
394 |
-11.4 |
319.0 |
| Service-Providing |
15,172 |
16,385 |
4,393 |
-7.4 |
245.4 |
| Trade, Transportation,
and Utilities |
5,748 |
6,234 |
1,482 |
-7.8 |
287.9 |
| Wholesale Trade |
1,431 |
1,616 |
246 |
-11.4 |
481.7 |
| Retail Trade |
2,733 |
2,830 |
813 |
-3.4 |
236.2 |
| Transportation, Warehousing
and Utilities |
1,584 |
1,788 |
423 |
-11.4 |
274.5 |
| Information |
263 |
287 |
100 |
-8.4 |
163.0 |
| Financial Activities |
1,035 |
1,090 |
280 |
-5.0 |
269.6 |
| Professional and Business
Services |
2,812 |
2,940 |
820 |
-4.4 |
242.9 |
| Educational and Health Services |
1,718 |
2,120 |
651 |
-19.0 |
163.9 |
| Leisure and Hospitality |
2,395 |
2,562 |
772 |
-6.5 |
210.2 |
| Other Services, except Public
Admin. |
1,201 |
1,152 |
288 |
4.3 |
317.0 |
| Government |
2,172 |
2,400 |
1,071 |
-9.5 |
102.8 |
| Federal Government |
478 |
501 |
270 |
-4.6 |
77.0 |
| State Government |
382 |
437 |
159 |
-12.6 |
140.3 |
| Local Government |
1,312 |
1,462 |
642 |
-10.3 |
104.4 |
| Local Education |
456 |
483 |
196 |
-5.6 |
132.7 |
| Unclassified |
3,855 |
3,998 |
840 |
-3.6 |
358.9 |
|
|
|
|
|
|
| Laramie County |
|
|
|
|
|
| Total Continued
Weeks Claimed |
3,645 |
3,911 |
1,944 |
-6.8 |
87.5 |
| Total Unique
Claimants |
897 |
1,099 |
564 |
-18.4 |
59.0 |
| Goods-Producing |
964 |
976 |
567 |
-1.2 |
70.0 |
| Construction |
689 |
656 |
439 |
5.0 |
56.9 |
| Service-Providing |
2,198 |
2,409 |
1,021 |
-8.8 |
115.3 |
| Trade, Transportation,
and Utilities |
824 |
872 |
355 |
-5.5 |
132.1 |
| Financial Activities |
155 |
151 |
73 |
2.6 |
112.3 |
| Professional and Business
Services |
422 |
455 |
231 |
-7.3 |
82.7 |
| Educational and Health Services |
356 |
438 |
147 |
-18.7 |
142.2 |
| Leisure and Hospitality |
268 |
314 |
142 |
-14.6 |
88.7 |
| Government |
329 |
361 |
238 |
-8.9 |
38.2 |
| Unclassified |
154 |
165 |
118 |
-6.7 |
30.5 |
|
|
|
|
|
|
| Natrona County |
|
|
|
|
|
| Total Continued
Weeks Claimed |
5,470 |
5,982 |
998 |
-8.6 |
448.1 |
| Total Unique
Claimants |
1,253 |
1,641 |
297 |
-23.6 |
321.9 |
| Goods-Producing |
2,320 |
2,665 |
335 |
-12.9 |
592.5 |
| Construction |
681 |
627 |
156 |
8.6 |
336.5 |
| Service-Providing |
2,837 |
2,953 |
617 |
-3.9 |
359.8 |
| Trade, Transportation,
and Utilities |
1,145 |
1,240 |
185 |
-7.7 |
518.9 |
| Financial Activities |
198 |
181 |
55 |
9.4 |
260.0 |
| Professional and Business
Services |
361 |
397 |
109 |
-9.1 |
231.2 |
| Educational and Health Services |
281 |
324 |
91 |
-13.3 |
208.8 |
| Leisure and Hospitality |
347 |
379 |
93 |
-8.4 |
273.1 |
| Government |
199 |
194 |
37 |
2.6 |
437.8 |
| Unclassified |
114 |
170 |
9 |
-32.9 |
1166.7 |
aAn average month is considered 4.33 weeks.
If a month has four weeks, the normalization factor is 1.0825. If the month
has five weeks, the normalization factor is 0.866. The number of raw claims
is multiplied by the normalization factor to achieve the normalized claims
counts.