Wyoming Normalizeda Unemployment Insurance Statistics: Initial Claims
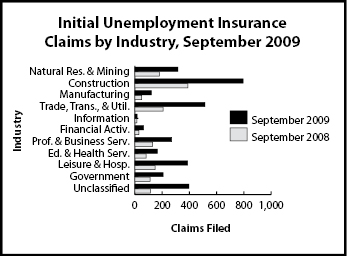
Initial claims were essentially unchanged compared to August 2009 and 125.6% greater than a year ago. Trade, transportation & utilities, construction, and manufacturing continued to be industries of considerable claims activity.
| Percent Change Claims Filed | |||||
| Claims Filed | Sep 09 | Sep 09 | |||
| Sep 09 | Aug 09 | Sep 08 | Aug 09 | Sep 08 | |
| Wyoming Statewide | |||||
| Total Claims Filed | 3,337 | 3,321 | 1,479 | 0.5 | 125.6 |
| Goods-Producing | 1,229 | 1,380 | 618 | -10.9 | 98.9 |
| Natural Resources and Mining | 315 | 368 | 179 | -14.4 | 76.0 |
| Mining | 302 | 346 | 176 | -12.7 | 71.6 |
| Oil & Gas Extraction | 22 | 16 | 87 | 37.5 | -74.7 |
| Construction | 794 | 791 | 389 | 0.4 | 104.1 |
| Manufacturing | 120 | 221 | 50 | -45.7 | 140.0 |
| Service-Providing | 1,505 | 1,380 | 635 | 9.1 | 137.0 |
| Trade, Transportation, and Utilities | 513 | 497 | 207 | 3.2 | 147.8 |
| Wholesale Trade | 77 | 90 | 32 | -14.4 | 140.6 |
| Retail Trade | 285 | 252 | 115 | 13.1 | 147.8 |
| Transp., Warehousing and Utilities | 151 | 155 | 60 | -2.6 | 151.7 |
| Information | 16 | 15 | 15 | 6.7 | 6.7 |
| Financial Activities | 63 | 61 | 29 | 3.3 | 117.2 |
| Professional and Business Services | 269 | 227 | 129 | 18.5 | 108.5 |
| Educational and Health Services | 165 | 173 | 82 | -4.6 | 101.2 |
| Leisure and Hospitality | 387 | 274 | 149 | 41.2 | 159.7 |
| Other Services, except Public Admin. | 92 | 133 | 24 | -30.8 | 283.3 |
| Government | 207 | 182 | 112 | 13.7 | 84.8 |
| Federal Government | 70 | 34 | 34 | 105.9 | 105.9 |
| State Government | 19 | 30 | 13 | -36.7 | 46.2 |
| Local Government | 118 | 118 | 65 | 0.0 | 81.5 |
| Local Education | 34 | 39 | 17 | -12.8 | 100.0 |
| Unclassified | 396 | 379 | 114 | 4.5 | 247.4 |
| Laramie County | |||||
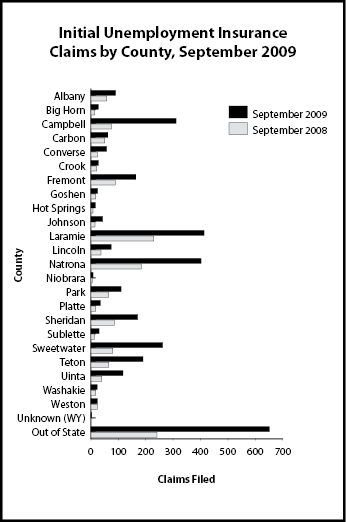
| Total Claims Filed | 414 | 355 | 226 | 16.6 | 83.2 |
| Goods-Producing | 157 | 109 | 76 | 44.0 | 106.6 |
| Construction | 140 | 80 | 68 | 75.0 | 105.9 |
| Service-Providing | 212 | 201 | 115 | 5.5 | 84.3 |
| Trade, Transportation, and Utilities | 73 | 80 | 45 | -8.8 | 62.2 |
| Financial Activities | 10 | 13 | 4 | -23.1 | 150.0 |
| Professional and Business Services | 45 | 28 | 31 | 60.7 | 45.2 |
| Educational and Health Services | 31 | 37 | 19 | -16.2 | 63.2 |
| Leisure and Hospitality | 35 | 26 | 9 | 34.6 | 288.9 |
| Government | 31 | 30 | 17 | 3.3 | 82.4 |
| Unclassified | 14 | 15 | 18 | -6.7 | -22.2 |
| Natrona County | |||||
| Total Claims Filed | 401 | 434 | 183 | -7.6 | 119.1 |
| Goods-Producing | 133 | 158 | 80 | -15.8 | 66.3 |
| Construction | 87 | 79 | 49 | 10.1 | 77.6 |
| Service-Providing | 238 | 244 | 94 | -2.5 | 153.2 |
| Trade, Transportation, and Utilities | 80 | 84 | 32 | -4.8 | 150.0 |
| Financial Activities | 10 | 12 | 9 | -16.7 | 11.1 |
| Professional and Business Services | 39 | 24 | 23 | 62.5 | 69.6 |
| Educational and Health Services | 29 | 22 | 16 | 31.8 | 81.3 |
| Leisure and Hospitality | 45 | 44 | 9 | 2.3 | 400.0 |
| Government | 17 | 22 | 0 | -22.7 | 0.0 |
| Unclassified | 13 | 10 | 9 | 30.0 | 44.4 |
aAn average month is considered 4.33 weeks. If a month has four weeks, the normalization factor is 1.0825. If the month has five weeks, the normalization factor is 0.866. The number of raw claims is multiplied by the normalization factor to achieve the normalized claims counts.