Wyoming Labor Force Trends
March 2024 | Volume 61, No. 3
Click Here for PDF
Return to Table of Contents
Employment and Wages by Employer Size Class for Private Industries in Wyoming in 2022
by: Deana Hauf, Senior Statistician
In Wyoming in 2022, the majority of private establishments had fewer than 50 employees. In addition, 23.6% of all jobs (or nearly one in four jobs) were in establishments with 20-49 employees.
This article uses unpublished May 2022 estimates collected by the Occupational Employment and Wage Statistics (OEWS) program of the U.S. Bureau of Labor Statistics to review the distribution of employment and wage by establishment size for private industries, which does not include any government agencies. The data were analyzed by the distribution of workers in the 22 major occupational groups using the Standard Occupational Classification (SOC) system by establishment size. The OEWS program uses the data for nonfarm establishments that file Unemployment Insurance (UI) reports to the state workforce agencies. More information on the OEWS program is available at https://www.bls.gov/oes/.
An establishment is defined as a unit that processes goods or provides services, such as a factory, mine, or store. The establishment is generally at a single physical location and is engaged primarily in one type of activity. An enterprise/company can have multiple establishments or locations. Each location could be analyzed and have its own employment level.
Establishments are classified into one of the following seven employment size class ranges (number of employees): 1-4, 5-9, 10-19, 20-49, 50-99, 100-249, and 250 or greater. The size class of each establishment is determined by the OEWS March 2022 employment level.
Wyoming’s total employment for all industries included in the May 2022 OEWS estimates was 268,114, of which 203,350 was in private industry. The median hourly wage for all industries was $21.85, with private industry being about a dollar less an hour at $20.75 (see Table 1). As mentioned, this study focuses on private industry employment and wages only.
Private establishments with employment of 20-49 had the highest employment of 47,980 (or 23.6% of the total) and the second lowest median hourly wage of $18.60. Establishments with 10-19 employees had the second highest employment at 36,830 (18.1%) and the lowest overall hourly median wage of $18.56.
Establishments with 250 or more employees had the lowest overall employment of 18,610 (9.2%) but had the highest hourly median wage of $31.63. Firms with 100-249 employees had the second lowest employment of 20,670 (10.2%), and this size class had the third highest hourly wage of $22.47. Establishments with fewer than five employees had the second highest hourly wage of $22.52 and employment of 27,220 (13.4%).
The 2018 Standard Occupational Classification (SOC) system is a federal statistical standard used by federal agencies to classify workers into occupational categories for the purpose of collecting, calculating, or disseminating data (U.S. Bureau of Labor Statistics, n.d.). There are 22 major occupational groups used in collecting the Wyoming OEWS data. This article discusses the four major occupational groups with the greatest employment, and the one with the smallest employment. For more information on the classification system, please visit https://www.bls.gov/soc/2018/major_groups.htm.
There were four major occupational groups within the private industry that each had approximately 11% of the total employment in March 2022 (see Table 2): sales & related occupations (11.6%), transportation & material moving occupations (11.6%), construction & extraction occupations (11.3%) and food preparation & serving occupations (11.0%). These four major groups accounted for nearly half (45.5%) of Wyoming’s employment.
Employment and wages for these four occupational groups (along with farming, fishing, & forestry occupations) are presented by employer size class in Table 3. The full table with major occupation groups is available at the bottom of the tables and figures page for this article.
Sales & related occupations (41-0000) had the highest employment of 23,590, which includes occupations such as retail salesperson, cashiers, counter & rental clerks, and insurance sales agents. Establishments with 10-19 employees had the largest employment with 5,200, followed by those with 20-49 employees with 5,120.
The major occupational group with the second highest employment was in transportation & material moving (53-0000) with 23,580. This group includes occupations such as delivery driver, CDL driver, forklift operator, and material & package handler, along with wellhead, pump, & crane operators. Large establishments with 250 or more employees had the highest employment in transportation & material moving occupations with 5,160, while establishments with 100-249 employees had employment of 3,120. In this occupational group, size is not a good predictor of wages.
Construction & extraction occupations (47-0000) had the third largest employment of 22,900; this includes occupations such as carpenters, roofers, and highway maintenance workers, along with derrick & rotary drilling operators and mining occupations. Employers with 20-49 employees had the greatest employment at 5,030, followed by employers with 10-19 employees with 4,270. The two largest class sizes had hourly wages higher than the median wage for all employees in that occupational group (see Table 3).
Food preparation & serving related occupations (35-0000) had the fourth largest employment of 22,400. These include workers that make and provide food and drinks to customers, including bartenders, cooks, fast food workers, and wait staff. The three size classes in this group that had the highest overall employment were size class 20-49 with 8,850, 10-19 with 5,200, and size class 50-99 with 4,130. Food preparations & serving related occupations also had the lowest median hourly wage of all occupational groups at $12.77. Establishments with 20 or more employees had a higher hourly wage and establishments with fewer than 20 employees had a lower hourly wage than all employees in the occupational group (see Table 3).
Farming, fishing, & forestry occupations had the lowest employment of all major occupational groups with 450, or 0.2% of Wyoming’s total employment. The reason for this is that the OEWS survey excludes the majority of the agricultural sector, with the exception of logging (NAICS 113310), support activities for crop production (NAICS 1151), and support activities for animal production (NAICS 1152). Private households (NAICS 814) also are excluded. The second lowest occupational group was protective service occupations with 1,080 or 0.5% of the total. Protective service occupations include police & sheriff patrol officers and firefighters. Most protective service occupations are in government establishments, which were not included in this research.
Reference
U.S. Bureau of Labor Statistics. (n.d.). Standard Occupational Classification. Retrieved February 23, 2024, from https://bls.gov/soc/
 Hire Wyo
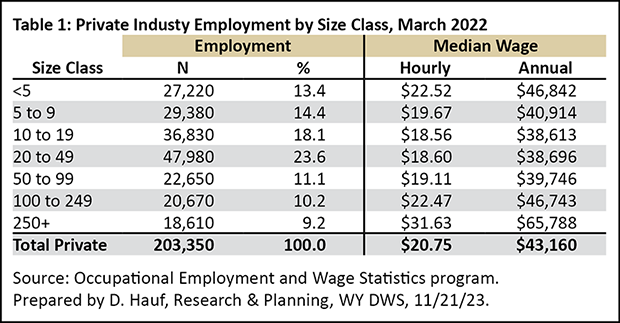