by: Sherry Wen, Principal Economist
Wyoming History of New Business and Formation Rate, 1995-2013

|
Over the past two years (2012 and 2013), new business formation in Wyoming continued an upward trend from 2010 and 2011. However, the combined four years of growth after the economic downturn years of 2008 and 2009 was much slower than the previous growth from the downturn years of 2002 and 2003 in terms of the growth pace and the formation level. The construction industry finally showed a notable recovery in 2013 after four consecutive years of decline – the largest in history. New business formation in mining dropped to the historical low again in 2012 and 2013.
Read Article Tables and Figures
by: Valerie A. Davis, Senior Statistician
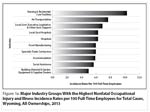
Major Industry Groups With the Highest Nonfatal Occupational Injury and Illness Incidence Rates per 100 Full-Time Employees for Total Cases in Wyoming, 2013
 |
This article summarizes the 2013 Wyoming Survey of Occupational Injuries and Illnesses results. The data include estimates of incidence rates by industry and the nature of the injury or illness. Also included are some worker demographics, such as age and gender. State and local government data are discussed briefly. An estimated 2,390 nonfatal occupational injury and illness cases with days away from work occurred in private industry in Wyoming in 2013, with an incidence rate of 3.4.
Article Tables and Figures
by: David Bullard, Senior Economist
U.S. and Wyoming Seasonally Adjusted Unemployment Rate

|
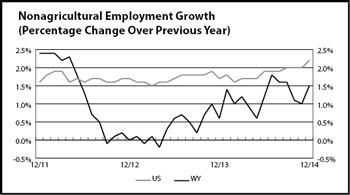
Wyoming’s seasonally adjusted unemployment rate fell significantly from 4.5% in November to 4.2% in December (the estimated number of unemployed individuals decreased by 928). Wyoming’s unemployment rate was marginally lower than its December 2013 level of 4.4% and significantly lower than the current U.S. unemployment rate of 5.6%. Seasonally adjusted employment of Wyoming residents increased slightly, rising by an estimated 815 individuals (0.3%) from November to December.
Read Article


