The Survey of Occupational Injuries and Illnesses for 2013 (Tables and Figures)
Tables 1, 2
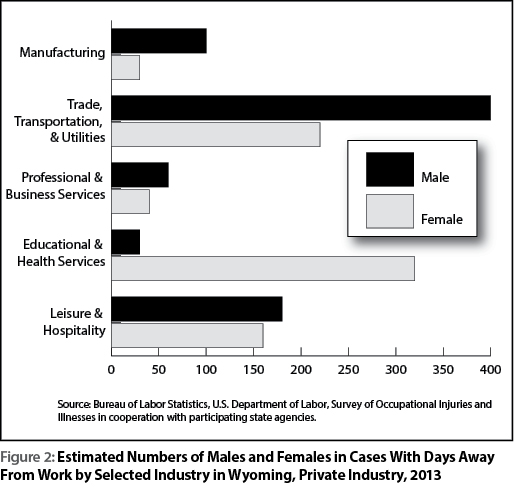
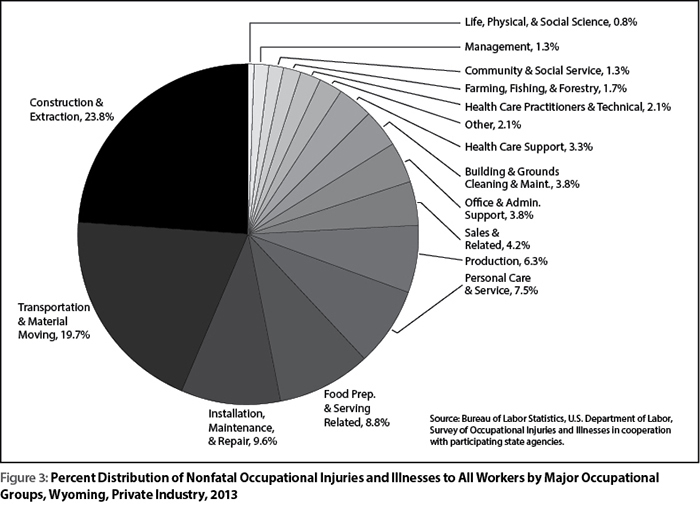
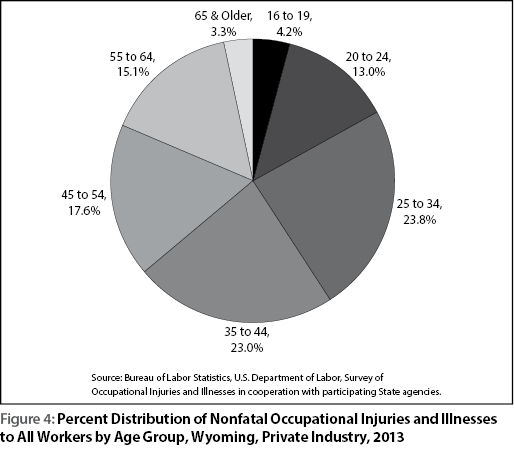
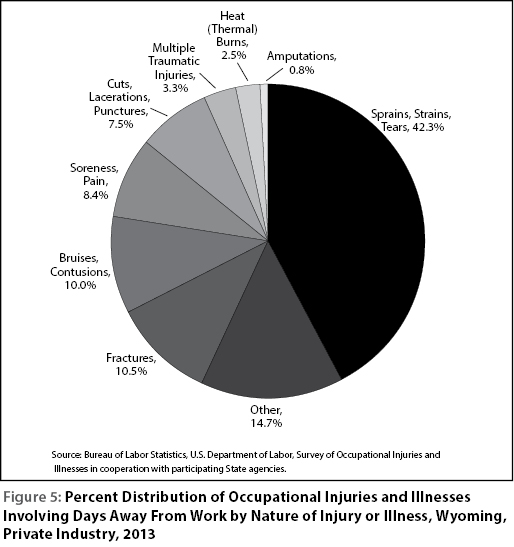
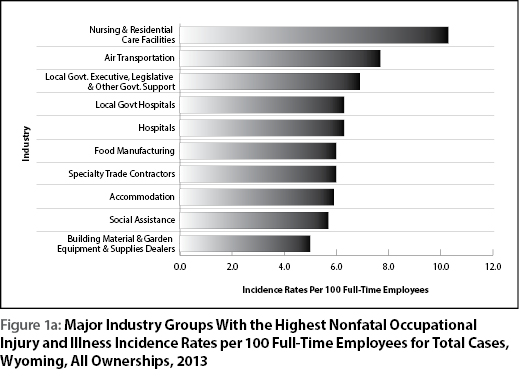
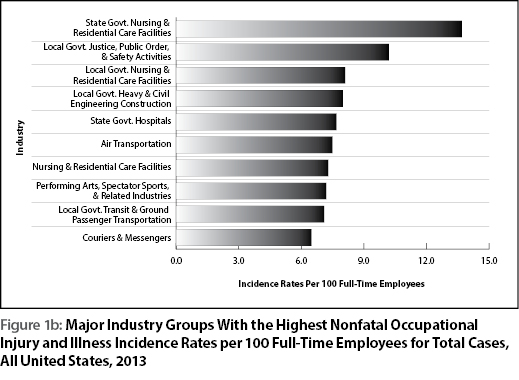
Figures 1a, 1b, 2, 3, 4, 5
| Characteristic | Total Private Industryb,c,d | |||||||||||
|---|---|---|---|---|---|---|---|---|---|---|---|---|
| 2008 | 2009 | 2010 | 2011 | 2012 | 2013 | |||||||
| N | % | N | % | N | % | N | % | N | % | N | % | |
| Total | 3,210 | 100.0 | 2,710 | 100.0 | 2,510 | 100.0 | 2,410 | 100.0 | 2,410 | 100.0 | 2,390 | 100.0 |
| Gender | ||||||||||||
| Male | 2,340 | 72.9 | 1,970 | 72.7 | 1,680 | 66.9 | 1,720 | 71.4 | 1,630 | 67.6 | 1,520 | 63.6 |
| Female | 810 | 25.2 | 710 | 26.2 | 800 | 31.9 | 670 | 27.8 | 760 | 31.5 | 850 | 35.6 |
| Age | ||||||||||||
| 16 to 19 | 180 | 5.6 | 100 | 3.7 | 60 | 2.4 | 90 | 3.7 | 90 | 3.7 | 100 | 4.2 |
| 20 to 24 | 470 | 14.6 | 460 | 17.0 | 280 | 11.2 | 350 | 14.5 | 210 | 8.7 | 310 | 13.0 |
| 25 to 34 | 640 | 19.9 | 730 | 26.9 | 600 | 23.9 | 570 | 23.7 | 600 | 24.9 | 570 | 23.8 |
| 35 to 44 | 780 | 24.3 | 480 | 17.7 | 520 | 20.7 | 430 | 17.8 | 450 | 18.7 | 550 | 23.0 |
| 45 to 54 | 670 | 20.9 | 570 | 21.0 | 630 | 25.1 | 520 | 21.6 | 620 | 25.7 | 420 | 17.6 |
| 55 to 64 | 370 | 11.5 | 280 | 10.3 | 330 | 13.1 | 390 | 16.2 | 350 | 14.5 | 360 | 15.1 |
| 65 & over | 100 | 3.1 | 90 | 3.3 | 90 | 3.6 | 50 | 2.1 | 70 | 2.9 | 80 | 3.3 |
| Length of service with employer | ||||||||||||
| Less than 3 months | 790 | 24.6 | 570 | 21.0 | 470 | 18.7 | 440 | 18.3 | 390 | 16.2 | 550 | 23.0 |
| 3 to 11 months | 750 | 23.4 | 660 | 24.4 | 560 | 22.3 | 660 | 27.4 | 590 | 24.5 | 570 | 23.8 |
| 1 to 5 years | 1,010 | 31.5 | 880 | 32.5 | 910 | 36.3 | 760 | 31.5 | 840 | 34.9 | 740 | 31.0 |
| More than 5 years | 590 | 18.4 | 560 | 20.7 | 540 | 21.5 | 520 | 21.6 | 570 | 23.7 | 520 | 21.8 |
| Number of days away from work | ||||||||||||
| Cases involving 1 day | 410 | 12.8 | 340 | 12.5 | 410 | 16.3 | 300 | 12.4 | 420 | 17.4 | 290 | 12.1 |
| Cases involving 2 days | 300 | 9.3 | 300 | 11.1 | 220 | 8.8 | 230 | 9.5 | 260 | 10.8 | 210 | 8.8 |
| Cases involving 3-5 days | 760 | 23.7 | 510 | 18.8 | 350 | 13.9 | 400 | 16.6 | 390 | 16.2 | 480 | 20.1 |
| Cases involving 6-10 days | 320 | 10.0 | 310 | 11.4 | 290 | 11.6 | 280 | 11.6 | 220 | 9.1 | 380 | 15.9 |
| Cases involving 11-20 days | 370 | 11.5 | 270 | 10.0 | 360 | 14.3 | 220 | 9.1 | 220 | 9.1 | 230 | 9.6 |
| Cases involving 21-30 days | 190 | 5.9 | 220 | 8.1 | 210 | 8.4 | 130 | 5.4 | 140 | 5.8 | 170 | 7.1 |
| Cases involving 31 or more days | 860 | 26.8 | 770 | 28.4 | 670 | 26.7 | 850 | 35.3 | 760 | 31.5 | 630 | 26.4 |
| Median days away from worke | 7 | 8 | 10 | 11 | 7 | 8 | ||||||
| Day of the week | ||||||||||||
| Sunday | 140 | 4.4 | 130 | 4.8 | 120 | 4.8 | 150 | 6.2 | 290 | 12.0 | 160 | 6.7 |
| Monday | 520 | 16.2 | 500 | 18.5 | 520 | 20.7 | 470 | 19.5 | 390 | 16.2 | 440 | 18.4 |
| Tuesday | 660 | 20.6 | 520 | 19.2 | 460 | 18.3 | 410 | 17.0 | 410 | 17.0 | 360 | 15.1 |
| Wednesday | 550 | 17.1 | 460 | 17.0 | 410 | 16.3 | 390 | 16.2 | 410 | 17.0 | 370 | 15.5 |
| Thursday | 590 | 18.4 | 430 | 15.9 | 350 | 13.9 | 440 | 18.3 | 370 | 15.4 | 430 | 18.0 |
| Friday | 520 | 16.2 | 360 | 13.3 | 440 | 17.5 | 370 | 15.4 | 330 | 13.7 | 390 | 16.3 |
| Saturday | 230 | 7.2 | 320 | 11.8 | 200 | 8.0 | 170 | 7.1 | 210 | 8.7 | 240 | 10.0 |
| aDays-away-from-work cases include those that result in days away from work with or without job transfer or restriction. bExcludes farms with fewer than 11 employees. cData for mining (Sector 21 in the North American Industry Classification System -- United States, 2007) include establishments not governed by the Mine Safety and Health Administration (MSHA) rules and reporting, such as those in oil and gas extraction and related support activities. Data for mining operators in coal, metal, and nonmetal mining are provided to BLS by the Mine Safety and Health Administration, U.S. Department of Labor. Independent mining contractors are excluded from the coal, metal, and nonmetal mining industries. These data do not reflect the changes the Occupational Safety and Health Administration made to its recordkeeping requirements effective January 1, 2002; therefore estimates for these industries are not comparable to estimates in other industries. dData for employers in railroad transportation are provided to BLS by the Federal Railroad Administration, U.S. Department of Transportation. eMedian days away from work is the measure used to summarize the varying lengths of absences from work among the cases with days away from work. Half the cases involved more days and half involved less days than a specified median. Median days away from work are represented in actual values. Note: Because of rounding and data exclusion of nonclassifiable responses, data may not sum to the totals. The scientifically selected probability sample used was one of many possible samples, each of which could have produced different estimates. A measure of sampling variability for each estimate is available upon request. Source: Bureau of Labor Statistics, U.S. Department of Labor, Survey of Occupational Injuries and Illnesses in cooperation with participating state agencies. Table created by Valerie A Davis, Wyoming Department of Workforce Services, Research & Planning, December 2014. |
||||||||||||
| 2012 | 2013 | ||||
|---|---|---|---|---|---|
| Gender |
Age Group |
% of Age Group Employed |
Employed |
% of Age Group Employed |
Employed |
| Males | 25-34 | 90.7% | 38,000 | 87.0% | 36,000 |
| 35-44 | 86.5% | 30,000 | 91.6% | 32,000 | |
| 45-54 | 85.8% | 36,000 | 86.3% | 33,000 | |
| 55-64 | 72.1% | 26,000 | 70.7% | 27,000 | |
| Females | 25-34 | 67.2% | 26,000 | 69.7% | 27,000 |
| 35-44 | 75.5% | 24,000 | 73.5% | 25,000 | |
| 45-54 | 76.7% | 29,000 | 74.2% | 28,000 | |
| 55-64 | 62.7% | 24,000 | 61.8% | 23,000 | |
| Source: U.S. Department of Labor, Bureau of Labor Statistics, Division of Local Area Unemployment Statistics. Employment status of the civilian noninstitutional population by sex, race, Hispanic or Latino ethnicity, marital status, and detailed age, 2012 and 2013 annual averages. Retrieved April 4, 2014, from http://www.bls.gov/lau/table14full12.pdf and retrieved November 12, 2014, from http://www.bls.gov/lau/table14full13.pdf. | |||||