Wyoming New Business Formation in 2012 and 2013 (Tables and Figures)
Tables 1, 2, 3, 4, 5, 6, 7
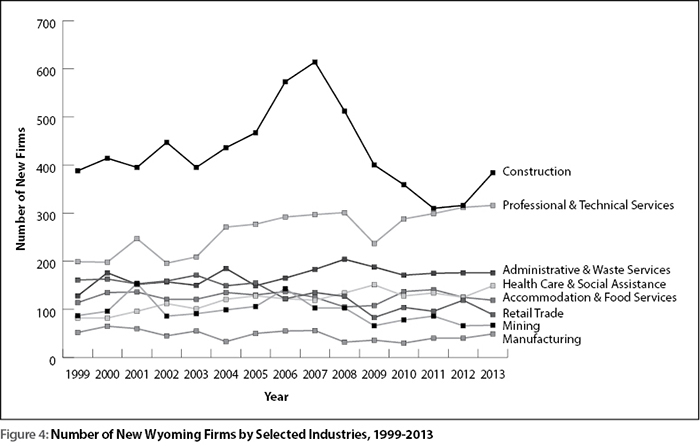
Figure 1, 2, 3, 4, 5
| Regions and Counties | 2012 | 2013 | |||||||||||
|---|---|---|---|---|---|---|---|---|---|---|---|---|---|
| New Firms | Initial Jobs | Total Wages | New Firms | Initial Jobs | Total Wages | ||||||||
| N | % | N | % | $ | % | N | % | N | % | $ | % | ||
| Northwest | 297 | 14.8% | 837 | 10.1% | $14,441,482 | 7.9% | 259 | 12.6% | 682 | 8.8% | $13,615,266 | 8.0% | |
| Big Horn | 33 | 1.6% | 71 | 0.9% | $1,185,587 | 0.6% | 26 | 1.3% | 30 | 0.4% | $476,659 | 0.3% | |
| Fremont | 119 | 5.9% | 302 | 3.6% | $6,811,854 | 3.7% | 107 | 5.2% | 277 | 3.6% | $7,646,716 | 4.5% | |
| Hot Springs | 20 | 1.0% | 56 | 0.7% | $586,378 | 0.3% | 9 | 0.4% | 19 | 0.2% | $292,937 | 0.2% | |
| Park | 101 | 5.0% | 310 | 3.7% | $3,882,683 | 2.1% | 82 | 4.0% | 219 | 2.8% | $3,411,433 | 2.0% | |
| Washakie | 24 | 1.2% | 98 | 1.2% | $1,974,980 | 1.1% | 35 | 1.7% | 137 | 1.8% | $1,787,521 | 1.0% | |
| Northeast | 291 | 14.5% | 1,007 | 12.2% | $22,137,064 | 12.0% | 333 | 16.3% | 1,444 | 18.5% | $21,103,886 | 12.4% | |
| Campbell | 117 | 5.8% | 500 | 6.0% | $15,486,509 | 8.4% | 130 | 6.3% | 658 | 8.5% | $8,471,939 | 5.0% | |
| Crook | 9 | 0.4% | 36 | 0.4% | $239,396 | 0.1% | 29 | 1.4% | 103 | 1.3% | $2,103,304 | 1.2% | |
| Johnson | 33 | 1.6% | 105 | 1.3% | $1,724,679 | 0.9% | 38 | 1.9% | 103 | 1.3% | $2,101,316 | 1.2% | |
| Sheridan | 111 | 5.5% | 314 | 3.8% | $3,753,251 | 2.0% | 115 | 5.6% | 506 | 6.5% | $6,794,626 | 4.0% | |
| Weston | 21 | 1.0% | 52 | 0.6% | $933,229 | 0.5% | 21 | 1.0% | 74 | 1.0% | $1,632,701 | 1.0% | |
| Southwest | 471 | 23.5% | 1,258 | 15.2% | $29,217,889 | 15.9% | 495 | 24.2% | 1,380 | 17.7% | $40,056,144 | 23.5% | |
| Lincoln | 69 | 3.4% | 169 | 2.0% | $2,043,909 | 1.1% | 68 | 3.3% | 135 | 1.7% | $4,545,840 | 2.7% | |
| Sublette | 38 | 1.9% | 188 | 2.3% | $2,824,805 | 1.5% | 34 | 1.7% | 103 | 1.3% | $2,604,103 | 1.5% | |
| Sweetwater | 117 | 5.8% | 278 | 3.4% | $8,103,590 | 4.4% | 109 | 5.3% | 500 | 6.4% | $11,196,921 | 6.6% | |
| Teton | 195 | 9.7% | 480 | 5.8% | $13,347,128 | 7.3% | 251 | 12.2% | 560 | 7.2% | $20,341,696 | 11.9% | |
| Uinta | 52 | 2.6% | 143 | 1.7% | $2,898,457 | 1.6% | 33 | 1.6% | 82 | 1.1% | $1,367,584 | 0.8% | |
| Southeast | 499 | 24.9% | 2,348 | 28.3% | $58,118,596 | 31.6% | 541 | 26.4% | 1,671 | 21.5% | $33,236,009 | 19.5% | |
| Albany | 81 | 4.0% | 275 | 3.3% | $3,430,628 | 1.9% | 107 | 5.2% | 306 | 3.9% | $5,008,915 | 2.9% | |
| Goshen | 34 | 1.7% | 147 | 1.8% | $3,544,289 | 1.9% | 33 | 1.6% | 127 | 1.6% | $1,610,298 | 0.9% | |
| Laramie | 358 | 17.8% | 1,820 | 22.0% | $49,760,698 | 27.1% | 359 | 17.5% | 1,100 | 14.1% | $22,135,460 | 13.0% | |
| Niobrara | 8 | 0.4% | 21 | 0.3% | $179,596 | 0.1% | 8 | 0.4% | 18 | 0.2% | $283,610 | 0.2% | |
| Platte | 18 | 0.9% | 85 | 1.0% | $1,203,385 | 0.7% | 34 | 1.7% | 120 | 1.5% | $4,197,726 | 2.5% | |
| Central | 367 | 18.3% | 1,402 | 16.9% | $30,868,570 | 16.8% | 350 | 17.1% | 1,288 | 16.5% | $29,947,824 | 17.6% | |
| Carbon | 39 | 1.9% | 299 | 3.6% | $8,670,956 | 4.7% | 46 | 2.2% | 210 | 2.7% | $9,068,442 | 5.3% | |
| Converse | 63 | 3.1% | 215 | 2.6% | $4,208,648 | 2.3% | 52 | 2.5% | 150 | 1.9% | $3,431,973 | 2.0% | |
| Natrona | 265 | 13.2% | 888 | 10.7% | $17,988,966 | 9.8% | 252 | 12.3% | 928 | 11.9% | $17,447,409 | 10.2% | |
| Othersb | 83 | 4.1% | 1,431 | 17.3% | $29,171,611 | 15.9% | 71 | 3.5% | 1,321 | 17.0% | $32,394,710 | 19.0% | |
| Statewide | 2,008 | 100.0% | 8,283 | 100.0% | $183,955,212 | 100.0% | 2,049 | 100.0% | 7,786 | 100.0% | $170,353,839 | 100.0% | |
| aInitial Jobs represent the starting level employment, which is the highest average quarterly employment during the first two quarters a firm is in business.
bOthers include all firms missing county information, having more than one county location (multi-county firms), having foreign locations, and out-of-state firms. |
|||||||||||||
| Industry | 2012 | 2013 | |||||||||||
|---|---|---|---|---|---|---|---|---|---|---|---|---|---|
| New Firms | Initial Jobs | Total Wages | New Firms | Initial Jobs | Total Wages | ||||||||
| N | % | N | % | $ | % | N | % | N | % | $ | % | ||
| Agriculture | 27 | 1.3% | 86 | 1.0% | 1,477,426 | 0.8% | 41 | 2.0% | 111 | 1.4% | 3,094,925 | 1.8% | |
| Mining | 66 | 3.3% | 436 | 5.3% | 18,417,929 | 10.0% | 67 | 3.3% | 336 | 4.3% | 13,014,503 | 7.6% | |
| Utilities | 2 | 0.1% | 3 | 0.0% | 7,765 | 0.0% | 2 | 0.1% | 5 | 0.1% | 193,131 | 0.1% | |
| Construction | 316 | 15.7% | 1,285 | 15.5% | 26,928,524 | 14.6% | 384 | 18.7% | 1,308 | 16.8% | 24,707,427 | 14.5% | |
| Manufacturing | 40 | 2.0% | 180 | 2.2% | 4,169,039 | 2.3% | 49 | 2.4% | 197 | 2.5% | 3,769,588 | 2.2% | |
| Wholesale Trade | 96 | 4.8% | 178 | 2.1% | 5,467,930 | 3.0% | 90 | 4.4% | 174 | 2.2% | 4,589,039 | 2.7% | |
| Retail Trade | 119 | 5.9% | 408 | 4.9% | 3,963,427 | 2.2% | 89 | 4.3% | 1,326 | 17.0% | 22,155,660 | 13.0% | |
| Transportation & Warehousing | 123 | 6.1% | 611 | 7.4% | 9,531,323 | 5.2% | 112 | 5.5% | 388 | 5.0% | 16,054,270 | 9.4% | |
| Information | 21 | 1.0% | 20 | 0.2% | 1,164,813 | 0.6% | 30 | 1.5% | 123 | 1.6% | 1,717,245 | 1.0% | |
| Finance & Insurance | 97 | 4.8% | 111 | 1.3% | 4,324,109 | 2.4% | 93 | 4.5% | 92 | 1.2% | 5,332,062 | 3.1% | |
| Real Estate & Rental & Leasing | 63 | 3.1% | 158 | 1.9% | 3,338,111 | 1.8% | 84 | 4.1% | 179 | 2.3% | 4,693,390 | 2.8% | |
| Professional & Technical Services | 312 | 15.5% | 582 | 7.0% | 20,962,951 | 11.4% | 316 | 15.4% | 579 | 7.4% | 29,445,620 | 17.3% | |
| Mgmt.of Companies & Enterprises | 14 | 0.7% | 22 | 0.3% | 2,864,179 | 1.6% | 9 | 0.4% | 20 | 0.3% | 703,581 | 0.4% | |
| Administrative & Waste Services | 176 | 8.8% | 340 | 4.1% | 5,505,795 | 3.0% | 176 | 8.6% | 399 | 5.1% | 7,071,947 | 4.2% | |
| Educational Services | 21 | 1.0% | 36 | 0.4% | 663,477 | 0.4% | 28 | 1.4% | 83 | 1.1% | 1,185,976 | 0.7% | |
| Health Care & Social Assistance | 125 | 6.2% | 735 | 8.9% | 35,447,669 | 19.3% | 149 | 7.3% | 424 | 5.4% | 10,749,164 | 6.3% | |
| Arts, Entertainment, & Recreation | 34 | 1.7% | 115 | 1.4% | 594,118 | 0.3% | 34 | 1.7% | 140 | 1.8% | 2,344,458 | 1.4% | |
| Accommodation & Food Services | 125 | 6.2% | 1,597 | 19.3% | 10,917,617 | 5.9% | 119 | 5.8% | 1,402 | 18.0% | 10,603,904 | 6.2% | |
| Other Services | 221 | 11.0% | 541 | 6.5% | 6,051,281 | 3.3% | 169 | 8.2% | 380 | 4.9% | 5,768,434 | 3.4% | |
| Government | 10 | 0.5% | 839 | 10.1% | 22,157,729 | 12.0% | 8 | 0.4% | 120 | 1.5% | 3,159,515 | 1.9% | |
| Total | 2,008 | 100.0% | 8,283 | 100.0% | 183,955,212 | 100.0% | 2,049 | 100.0% | 7,786 | 100.0% | 170,353,839 | 100.0% | |
| Industry | Regiona | Total, All New Wyoming Firms | |||||||
|---|---|---|---|---|---|---|---|---|---|
| NW | NE | SW | SE | Central | Non. | Total | N | Column % | |
|
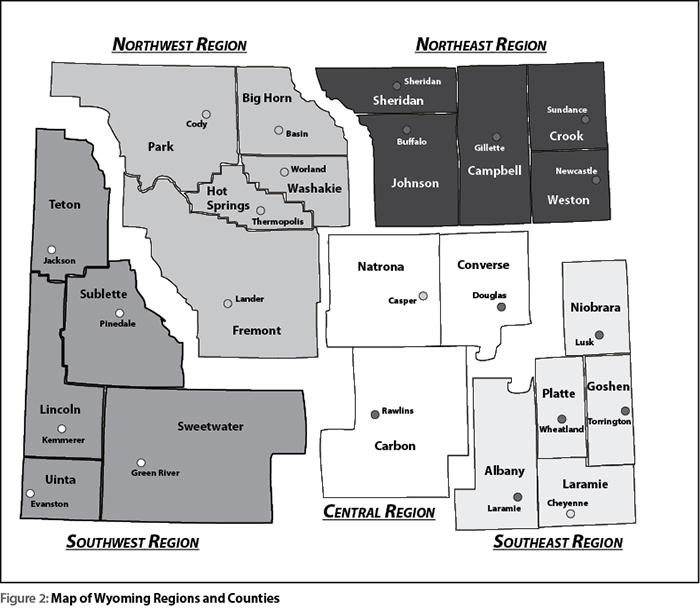
ND = not discloseable due to confidentiality. aRegions: NW = northwest; NE = northeast; SW = southwest; SE = southeast; Non. = nonclassified. For more information, see Figure 2. |
|||||||||
| Agriculture | 26.5% | 14.7% | 8.8% | 29.4% | 20.6% | 0.0% | 100.0% | 68 | 1.7% |
| Mining | 12.8% | 24.1% | 24.1% | 9.0% | 27.1% | 3.0% | 100.0% | 133 | 3.3% |
| Utilities | ND | ND | ND | ND | ND | ND | 100.0% | 4 | 0.1% |
| Construction | 13.7% | 16.6% | 21.0% | 26.6% | 18.0% | 4.1% | 100.0% | 700 | 17.3% |
| Manufacturing | 15.7% | 22.5% | 15.7% | 23.6% | 22.5% | 0.0% | 100.0% | 89 | 2.2% |
| Wholesale Trade | 14.5% | 15.6% | 16.7% | 26.9% | 19.9% | 6.5% | 100.0% | 186 | 4.6% |
| Retail Trade | 14.9% | 13.9% | 30.3% | 22.6% | 15.9% | 2.4% | 100.0% | 208 | 5.1% |
| Trans. & Warehousing | 13.2% | 15.7% | 19.6% | 20.4% | 28.1% | 3.0% | 100.0% | 235 | 5.8% |
| Information | 11.8% | 9.8% | 29.4% | 35.3% | 7.8% | 5.9% | 100.0% | 51 | 1.3% |
| Finance & Insurance | 8.9% | 8.9% | 32.1% | 21.6% | 15.8% | 12.6% | 100.0% | 190 | 4.7% |
| Real Estate & Rental & Leasing | 11.6% | 21.8% | 26.5% | 19.7% | 19.0% | 1.4% | 100.0% | 147 | 3.6% |
| Professional & Technical Services | 11.0% | 11.0% | 27.7% | 32.2% | 14.0% | 4.1% | 100.0% | 628 | 15.5% |
| Mgmt.of Companies & Enterprises | 8.7% | 4.3% | 56.5% | 17.4% | 8.7% | 4.3% | 100.0% | 23 | 0.6% |
| Admin. & Waste Services | 13.6% | 9.9% | 19.9% | 32.1% | 16.8% | 7.7% | 100.0% | 352 | 8.7% |
| Educational Services | 8.2% | 4.1% | 30.6% | 42.9% | 14.3% | 0.0% | 100.0% | 49 | 1.2% |
| Health Care & Social Assistance | 17.9% | 15.7% | 17.9% | 29.2% | 18.2% | 1.1% | 100.0% | 274 | 6.8% |
| Arts, Entertainment, & Recreation | 19.1% | 10.3% | 39.7% | 16.2% | 14.7% | 0.0% | 100.0% | 68 | 1.7% |
|
Accommodation & Food Services |
18.0% | 21.7% | 23.0% | 20.5% | 16.0% | 0.8% | 100.0% | 244 | 6.0% |
| Other Svcs. (Exc. Public Admin.) | 13.1% | 21.5% | 26.7% | 20.8% | 16.4% | 1.5% | 100.0% | 390 | 9.6% |
| Government | 11.1% | 16.7% | 16.7% | 27.8% | 16.7% | 11.1% | 100.0% | 18 | 0.4% |
| Total | 13.7% | 15.4% | 23.8% | 25.6% | 17.7% | 3.8% | 100.0% | 4,057 | 100.0% |
| Industry | 2000 | 2001 | 2002 | 2003 | 2004 | 2005 | 2006 | 2007 | 2008 | 2009 | 2010 | 2011 | 2012 | 2013 |
|---|---|---|---|---|---|---|---|---|---|---|---|---|---|---|
| Agriculture | 8.8% | 10.7% | 8.0% | 8.0% | 7.7% | 7.6% | 8.6% | 7.0% | 7.2% | 8.4% | 6.7% | 8.9% | 5.7% | 8.6% |
| Mining | 13.4% | 19.2% | 10.2% | 10.4% | 10.9% | 11.0% | 13.6% | 9.3% | 9.0% | 5.8% | 6.9% | 7.6% | 6.0% | 6.1% |
| Utilities | 4.3% | 2.2% | 3.2% | 8.2% | 1.0% | 3.1% | 3.0% | 4.0% | 3.8% | 1.7% | 3.3% | 2.5% | 1.7% | 1.7% |
| Construction | 13.6% | 12.7% | 14.0% | 12.2% | 13.2% | 13.5% | 15.7% | 16.0% | 12.8% | 10.2% | 9.5% | 8.6% | 8.9% | 10.9% |
| Manufacturing | 9.8% | 9.2% | 7.0% | 8.5% | 5.1% | 7.7% | 8.6% | 8.5% | 5.0% | 5.7% | 5.0% | 6.6% | 6.6% | 8.0% |
| Wholesale Trade | 10.6% | 11.5% | 7.7% | 8.6% | 9.2% | 10.4% | 9.0% | 8.6% | 7.1% | 5.5% | 6.7% | 7.0% | 7.4% | 7.0% |
| Retail Trade | 6.0% | 5.7% | 6.0% | 6.4% | 5.6% | 5.8% | 4.5% | 5.1% | 4.8% | 3.2% | 4.1% | 3.8% | 4.8% | 3.6% |
| Transportation & Warehousing | 13.7% | 11.4% | 13.9% | 10.8% | 12.0% | 14.5% | 14.1% | 12.1% | 13.6% | 8.4% | 8.2% | 11.8% | 11.6% | 10.4% |
| Information | 9.8% | 9.5% | 7.2% | 5.4% | 7.6% | 6.9% | 7.8% | 5.8% | 6.7% | 6.3% | 5.8% | 7.5% | 5.7% | 7.9% |
| Finance & Insurance | 8.6% | 6.3% | 7.2% | 7.3% | 6.2% | 8.1% | 7.3% | 8.0% | 7.0% | 6.5% | 8.3% | 7.0% | 8.3% | 8.0% |
| Real Estate & Rental & Leasing | 9.7% | 8.4% | 9.1% | 8.8% | 10.0% | 11.3% | 8.6% | 9.1% | 8.6% | 5.5% | 7.8% | 6.1% | 6.0% | 7.9% |
| Professional & Technical Services | 11.6% | 13.6% | 10.8% | 11.4% | 14.1% | 13.6% | 13.4% | 12.9% | 12.6% | 9.7% | 11.5% | 11.6% | 11.7% | 11.7% |
| Mgmt. of Companies & Enterprises | 14.3% | 9.9% | 12.5% | 17.9% | 16.7% | 11.9% | 11.6% | 6.0% | 7.1% | 8.0% | 5.3% | 4.6% | 10.1% | 6.5% |
| Administrative & Waste Services | 17.7% | 14.4% | 14.4% | 13.4% | 15.9% | 12.5% | 13.4% | 14.4% | 15.3% | 13.8% | 12.3% | 12.3% | 12.0% | 12.0% |
| Educational Services | 15.3% | 13.2% | 23.3% | 20.0% | 14.6% | 14.4% | 15.1% | 17.6% | 9.8% | 15.1% | 17.1% | 13.9% | 9.5% | 12.6% |
| Health Care & Social Assistance | 6.2% | 7.3% | 8.3% | 7.2% | 8.1% | 8.2% | 7.7% | 7.3% | 7.9% | 8.6% | 7.0% | 7.2% | 6.5% | 7.0% |
| Arts, Entertainment, & Recreation | 8.0% | 9.2% | 7.5% | 6.9% | 10.6% | 9.1% | 4.5% | 6.4% | 7.5% | 6.0% | 5.1% | 7.6% | 8.3% | 8.3% |
| Acc. & Food Svcs. | 7.9% | 8.0% | 7.0% | 7.0% | 7.7% | 7.2% | 7.6% | 7.0% | 5.8% | 5.9% | 7.4% | 7.5% | 6.5% | 6.2% |
| Other Svcs. (Exc. Public Admin.) | 10.3% | 11.2% | 8.9% | 10.1% | 9.4% | 9.7% | 10.6% | 11.0% | 10.9% | 8.2% | 11.1% | 11.8% | 11.7% | 9.8% |
| Total | 10.3% | 10.4% | 9.7% | 9.4% | 10.0% | 10.2% | 10.4% | 10.2% | 9.5% | 7.8% | 8.3% | 8.4% | 8.4% | 8.5% |
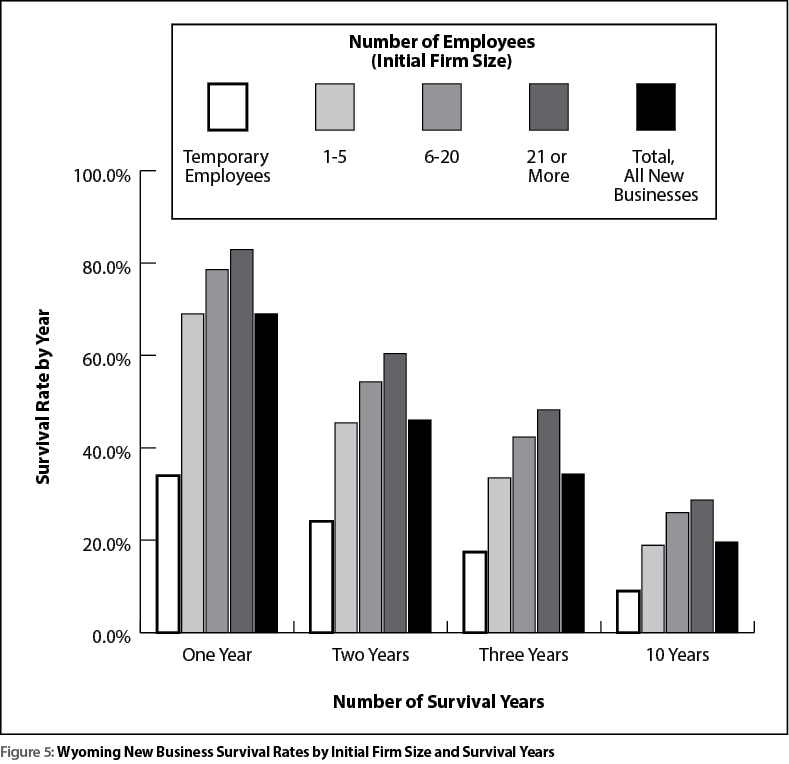
| Industry | Number of Years | |||||
|---|---|---|---|---|---|---|
| 1 | 2 | 3 | 4 | 5 | 10 | |
| Agriculture | 78.5% | 68.8% | 60.1% | 54.7% | 50.9% | 34.2% |
| Mining | 73.6% | 60.7% | 50.2% | 44.3% | 39.0% | 22.2% |
| Utilities | 73.5% | 60.0% | 57.8% | 50.8% | 52.6% | 33.3% |
| Construction | 57.7% | 44.0% | 36.1% | 29.9% | 26.0% | 14.1% |
| Manufacturing | 72.5% | 59.6% | 50.1% | 44.6% | 39.8% | 21.9% |
| Wholesale Trade | 73.6% | 57.1% | 47.2% | 39.7% | 33.9% | 18.9% |
| Retail Trade | 74.5% | 59.9% | 49.2% | 42.0% | 35.4% | 19.0% |
| Transportation & Warehousing | 67.9% | 53.9% | 44.2% | 36.8% | 32.5% | 17.6% |
| Information | 66.7% | 51.3% | 44.0% | 37.6% | 32.7% | 15.3% |
| Finance & Insurance | 68.2% | 56.4% | 46.5% | 42.0% | 37.3% | 24.4% |
| Real Estate & Rental & Leasing | 76.8% | 65.5% | 57.0% | 50.2% | 45.4% | 30.5% |
| Professional & Technical Services | 71.5% | 57.6% | 48.3% | 42.4% | 37.0% | 22.0% |
| Mgmt. of Companies & Enterprises | 76.6% | 60.7% | 55.8% | 44.9% | 37.0% | 30.0% |
| Administrative & Waste Services | 63.9% | 50.6% | 41.3% | 33.9% | 29.0% | 15.9% |
| Educational Services | 72.7% | 61.0% | 52.2% | 44.0% | 38.6% | 19.9% |
| Health Care & Social Assistance | 82.8% | 70.8% | 62.6% | 54.5% | 49.0% | 32.3% |
| Arts, Entertainment, & Recreation | 70.4% | 58.6% | 48.6% | 42.0% | 35.9% | 20.6% |
| Acc. & Food Svcs. | 73.1% | 57.0% | 47.5% | 39.9% | 35.3% | 17.3% |
| Other Svcs. (Exc. Public Admin.) | 67.9% | 52.4% | 42.4% | 34.8% | 30.1% | 15.5% |
| Government | 93.2% | 91.6% | 88.7% | 86.0% | 83.7% | 75.7% |
| Total | 69.0% | 55.2% | 46.0% | 39.2% | 34.3% | 19.6% |
| Industry | Region | ||||||
|---|---|---|---|---|---|---|---|
| Northwest | Northeast | Southwest | Southeast | Central | Nonclassified | Statewide | |
| Agriculture | 76.4% | 72.7% | 73.7% | 84.8% | 88.2% | 62.5% | 78.5% |
| Mining | 71.6% | 75.5% | 75.1% | 76.3% | 70.9% | 69.8% | 73.6% |
| Utilities | 100.0% | 66.7% | 73.3% | 83.3% | 58.3% | 50.0% | 73.5% |
| Construction | 57.0% | 60.1% | 57.7% | 56.9% | 60.7% | 43.1% | 57.7% |
| Manufacturing | 65.4% | 80.0% | 74.9% | 70.9% | 72.9% | 69.2% | 72.5% |
| Wholesale Trade | 73.5% | 76.7% | 71.1% | 77.1% | 73.0% | 68.6% | 73.6% |
| Retail Trade | 74.1% | 75.9% | 75.8% | 73.7% | 73.8% | 63.2% | 74.5% |
| Transportation & Warehousing | 69.3% | 72.0% | 65.5% | 66.5% | 68.1% | 67.9% | 67.9% |
| Information | 75.0% | 74.6% | 67.2% | 63.9% | 62.3% | 60.3% | 66.7% |
| Finance & Insurance | 71.2% | 75.4% | 69.2% | 67.9% | 75.4% | 36.1% | 68.2% |
| Real Estate & Rental & Leasing | 75.3% | 76.7% | 75.8% | 78.7% | 78.9% | 61.9% | 76.8% |
| Professional & Technical Services | 73.2% | 71.7% | 72.9% | 72.1% | 74.0% | 49.8% | 71.5% |
| Mgmt. of Companies & Enterprises | 69.0% | 89.3% | 83.3% | 64.3% | 76.9% | 66.7% | 76.6% |
| Administrative & Waste Services | 64.5% | 65.5% | 65.5% | 66.0% | 62.4% | 55.6% | 63.9% |
| Educational Services | 73.1% | 78.4% | 73.5% | 73.5% | 71.2% | 58.6% | 72.7% |
| Health Care & Social Assistance | 83.2% | 82.0% | 83.2% | 83.0% | 82.9% | 73.8% | 82.8% |
| Arts, Entertainment, & Recreation | 65.8% | 72.9% | 74.5% | 72.1% | 68.4% | 43.8% | 70.4% |
| Accommodation & Food Services | 71.2% | 72.0% | 72.0% | 76.0% | 74.2% | 79.2% | 73.1% |
| Other Svcs. (Exc. Public Admin.) ] | 65.2% | 68.7% | 71.1% | 64.4% | 70.7% | 59.6% | 67.9% |
| Government | 87.8% | 91.7% | 97.4% | 92.6% | 100.0% | 88.9% | 93.2% |
| Total | 68.8% | 70.6% | 69.1% | 69.0% | 70.7% | 55.8% | 69.0% |