
Wyoming New Business Formation in 2012 and 2013
See Related Tables and Figures
Over the past two years (2012 and 2013), new business formation in Wyoming continued an upward trend from 2010 and 2011. However, the combined four years of growth after the economic downturn years of 2008 and 2009 was much slower than the previous growth from the downturn years of 2002 and 2003 in terms of the growth pace and the formation level. The construction industry finally showed a notable recovery in 2013 after four consecutive years of decline – the largest in history. New business formation in mining dropped to the historical low again in 2012 and 2013.
New business formation and the rate of business formation are important indices of economic growth. They represent new sources of jobs, wages, and tax revenues for the state and local communities. The Research & Planning (R&P) section of the Department of Workforce Services (DWS) has been conducting new business formation research since 1995 (Yu, 1995).
This article provides information on the number of new businesses that opened and the job opportunities they provided in Wyoming during the past two years (2012 and 2013). It also takes a look at the industries and locations of the new firms because they may represent the directions of economic expansion. Lastly this article examines business survival.
In this article, a new business is defined as a business that did not exist before but now actively provides goods or services, and hires employees and pays them wages. New branches of existing firms or the reopening of firms after temporarily closing are not considered new firms. By law, if a person or a cooperative plans to start a new business in Wyoming and hire workers, he or she must register with the Department of Workforce Services’ Unemployment Insurance (UI) division and indicate what kind of business activity the firm plans to conduct, the county or counties in which the firm will locate, and other related information. The UI division will then set up a new UI account for them. A new branch of an existing firm will not have a new UI account. It will be under the same UI account as its parent company. The successor of an existing firm will not count as a new business in this research, either. The word firms in this article refers to UI accounts.
R&P manages a monthly business register database based on registrations submitted by employers to the DWS UI division. However, a business venture may not move forward as intended. Many new firms are unable to open their business as originally planned. Some businesses never actually open their doors. As a result, the new register database lacks information on the final number of new firms within a specific time period and the actual date that a firm begins business.
To address these problems, R&P matches the new UI register file to the Quarterly Census of Employment and Wages (QCEW), an administrative tax database based on the quarterly reports from employers about their employment and wages information (Bullard and Brennan, 2014). If a new firm hires workers and reports wages in QCEW, it is considered an active new firm in that corresponding quarter and is selected for the study database. R&P continues to add new firms in each quarter and obtain the longitudinal quarterly employment and wage information for each record as additional QCEW data become available.
Statewide New Business
Formation and Historical Trends
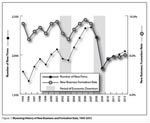 |
A total of 2,008 new firms opened in Wyoming in 2012 and 2,049 new firms opened in 2013 (see Figure 1). This upward growth trend has continued for four years since 2010 from the trough in 2009, which only gained 1,832 new firms and was the lowest level since 1996. Figure 1 shows two periods of economic downturn in Wyoming: 2002 to 2003 and 2008 to 2009. During the four years (2004 to 2007) after the first downturn, the average growth rate was 5.1%. However, during the four years (2010 to 2013) after the second downturn, the growth rate was only 2.9%. Growth rate is calculated by dividing the number of new businesses by the number of existing businesses.
The formation level was also lower in the current growth period. During the fourth year of the previous growth period (2007), there were 2,352 new firms in Wyoming. During the fourth year of the most recent growth period (2013), there were 2,049 new firms – 303 fewer new firms compared to 2007, or -12.9%.
Figure 1 also shows that the growth rate over the 14 years before 2009 remained relatively stable, ranging from 8.8% to 9.8%. The growth rate dropped to 7.3% in 2009, a record low rate. After four years of improvement, the rate was back up to 8.0%, but still lower than any point on the range of the pre-downturn years’ rates.
This slower pace of growth in new business formation was not isolated. The existing firms’ expansion that could be represented by the state annual average employment (jobs in QCEW; Bullard and Brennan, 2014) also showed slower and insignificant growth during this period. The 2007-08 financial crisis may have largely limited the ability to get loans to start or expand a business (Klein, 2014). The long lasting uncertainty of the national economy may have also affected business owners’ confidence on expansion.
New firms contributed 8,283 jobs in 2012 and 7,786 jobs in 2013, which counted for 3.0% and 2.8% state average employment, respectively. They also contributed $184.0 million in wages in 2012 and $170.4 million in 2013, equal to 1.5% and 1.4% state total wages, respectively. The total number of new firms in 2013 increased slightly (2.0%) from the previous year, but the associated initial jobs decreased 6.0%, and total wages decreased 7.4%. These opposite movements could be due to the proportion of small sized firms and low paying firms. The average firm size in 2013 was 3.8 jobs, down from 4.1 jobs in 2012. The highest average firm size was 4.8 jobs per firm in 1999.
New Business
Formation by Region
 |
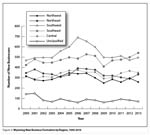
This section focuses only on the most recent year’s data (2013). Other previous years’ numbers may be listed in figures or tables for comparison purposes. See Figure 2 for a map of Wyoming’s regions.
 |
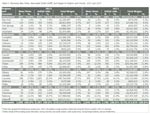 |
During the past two years (2012 and 2013), the southeast region of Wyoming was the fastest growing region in the state in terms of number of new firms, and surpassed the southwest region, which had been the fastest growing region for more than a decade (see Figure 3). The southeast gained more than a quarter (26.4%, or 541 new firms) of Wyoming’s total new firms in 2013 (see Table 1). The southwest was second with 495 firms (24.2%), followed by the central region, which gained 350 firms (17.1%). The northeast region expanded by 333 firms (16.3%), the third year it was behind central region in the past eight years. The northwest region added the fewest number of new firms in the state (259, or 12.6%). The southeast was the only region in the state showing consecutive growth over the past four years from the trough year 2009, and it was the only region that surpassed its pre-downturn peak level (527 firms in 2007) in 2013. In contrast, both the southwest and northeast regions were flat or continued declining in their new business formation level, and reached record lows in 2012, then experienced limited growth in 2013. The lower price on coal and natural gas, less demand for both, and the tighter pollution regulations (Dawn McCarty, 2013) and permit reviews (Lynds and Toner, 2014) might be among the main reasons for slower development in these two regions. As of 2013, the new business formation level in the southwest region was only at 71.7% of its peak year’s level (690 new firms in 2006).
Business Formation by County
Laramie County added the largest share of all new firms (359, or 17.5%) in 2013, followed by Natrona (252, or 12.3%) and Teton (251, or 12.2%) counties (see Table 1). Laramie County also provided the largest share of jobs (1,100, or 14.1%) and wages ($22.1 million, or 13.0%) among new businesses. With a similar number of new businesses, Natrona County gained more jobs (928, or 11.9%) than Teton County (560, jobs or 7.2%), but less wages ($17.4 million, or 10.2%, compared to $20.3 million, or 11.9%). This could mean that Natrona had a larger proportion of larger new firms but more lower-paying jobs compared to Teton County in 2013. This kind of formation structure could be very different from year to year, even for the same county. For example, Laramie County had almost the same number of new firms in 2012 (358) as in 2013 (359), but this similar number of new firms in 2012 contributed 720 more jobs (65.5% more) and more than double the wages ($27.6 million more, or 124.8%) than those in 2013.
Business Formation by Industry
 |
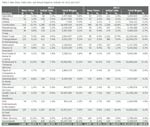 |
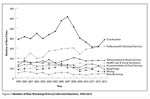
Construction has led all industries in new business formation in Wyoming for years (see Figure 4). In 2013, construction again contributed the largest share of new business (384, or 18.7% of the state’s total; see Table 2). Among all industries in Wyoming, construction experienced the longest and largest decline during and after the state’s economic downturn. After four years of consecutive decline from its peak year of 2007, which had 614 new firms, new firm formation in the construction industry reached its trough in 2011 (310 new firms) with nearly half of its peak level. There was no significant recovery in 2012, with only six more new firms (1.9%) from 2011. In 2013 construction had a notable upturning trend, increasing 21.5% from the previous year. However, it was still under any of the pre-downturn years levels (1999 to 2007). This long and steep contraction and slow recovery has never been seen before. The most recent housing and finance crises combined recession might have made recovery and expansion extremely difficult for this industry.
The professional & technical services industry was the second largest contributor of the number of new firms. A total of 316 (15.4% of state total) new businesses opened in 2013, which surpassed the previous peak year’s level (301 firms in 2008). Administrative & waste services ranked third, with 176 new firms (8.6%) in 2013. Other services experienced continued growth and ranked third for three years (2010 to 2012) before a decrease in new firms in 2013 (169 new firms, or 8.2% of the state’s total).
The larger number of new firms in an industry does not necessarily make it a bigger job or wage contributor among industries. It depends more on the industry’s characteristic, labor, high tech, and knowledge concentration levels. For example, professional & technical services gained 316 new firms in 2013 but only led to 579 associated jobs, while retail trade had less than one-third of that number in new firms (89) but gained more than double the amount of new jobs (1,326).
In 2013, new firms in accommodation & food services contributed the largest number of jobs (1,402, or 18.0% of the state’s total), followed by retail trade (1,326 jobs, or 17.0%) and construction (1,308 jobs, or 16.8%). Professional & technical services was the largest wage contributor among new firms, with $29.5 million (17.3% of the state’s total). Construction was the second, paying $24.7 million (14.5%) in wages, followed by retail trade with $22.2 million (13.0%).
After two years of slow growth in 2010 and 2011, new business formation in mining decreased to the trough year’s (2009) level of 66 new firms with 66 in 2012 and 67 in 2013. This was the lowest number of new businesses in mining since 1999. Lower energy prices and more environmental protection regulations might be among the main reasons.
Region and Industry
 |
In order to show a more detailed distribution of new firms by region and industry, data from 2012 and 2013 are combined in Table 3. About half of the 4,057 new firms established in these two years were located in two regions of the state: the southeast (25.6%) and southwest (23.8%). However, the industry distribution among different locations around the state was quite different. More than one-fourth (27.1%) of new mining firms were located in central region, and only 9.0% of new mining firms opened in the southeast. More than half (56.5%) of the new firms in management of companies & enterprises were located in the southwest, and only 4.3% were in the northeast. As the fastest growing region in Wyoming, the southeast gained the largest share of new firms from a variety of industries. For example, more than one-third (42.9%) of new firms in educational services, 35.3% in information, and 32.2% in professional & technical services were in this region. Natural resources, transportation conditions, geographic location, population, and special projects such as pipeline, wind mill, and highway construction are some of the main factors that caused the large uneven industry distributions.
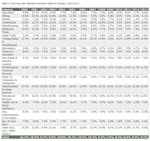 |
Formation rate by industry represents what proportion of an industry was new in a given year. Table 4 shows that some industries’ formation rates fluctuated largely from year to year, such as mining (19.2% in 2001 and 5.8% in 2009) and educational services (23.3% in 2002 and 9.5% in 2012). The majority of the industries had relatively stable formation rates over the last 14 years (2000 to 2013). In 2013, five industries had formation rates of more than 10%: educational services (12.6%), administrative & waste services (12.0%), professional & technical services (11.7%), construction (10.9%), and transportation & warehousing (10.4%).
Initial Firm Size
 |
The majority (81.1%) of the new firms started in 2012 and 2013 were small sized, with five or fewer employees (see Table 5). Some of them (6.0% of state total) only hired temporary employees for the first two quarters in operation. These firms’ average quarterly employment was zero for both beginning quarters, but their wage data show that they paid someone during these two quarters. A little more than one-tenth (10.3%) of the new firms started at the middle size with six to 20 employees and only 2.6% started with a large size (21 or more employees). The similar distribution pattern on firm sizes has been consistent since 1993 (Yu, 1997), when this kind of research was first available. Among private industries, accommodation & food services was the only one that had more than one-tenth (17.6%) of its new firms started at the large size. Mining had 6.8% of its new firms started with 21 or more employees. On the other hand, all or nearly all of the new firms in utilities (100%) and finance & insurance (99%) opened with five or fewer employees. Some of these (25.0% or more of the total) only used temporary employees.
Business Survival
Information about the prospects of a business surviving in a given industry and location could help individuals who are planning to open a business. This information may also help the Wyoming Business Council and other public and private funding sources for new ventures to develop practical strategies to ensure greater return on investment when establishing a new firm.
Due to limited information on business transitions such as selling, merging, and dividing, R&P only considers firm survival relative to the original owners in this research. Some firms may still operate but have changed ownership. Those firms would not be included in these survival counts. A quick verification study was done in 1999 (Yu, 1999) and the result indicated that the methodology used in this survival study could closely represent all new firms’ survival situations.
There are many factors that could impact a firm’s survivability, such as the supply and demand situation for a specific product or service the firm provides, competition from similar businesses, government policies, supply of required labor, and location.
One year after its opening, if a firm is still reporting its employment and wage information to the DWS UI Tax Division, it is considered as having survived one year. The one-year survival rate is the result of one year survivals divided by the total number of firms that reached their one year anniversary date. The same method is used to determine survival rates for two, three, or more years. In order to obtain a general pattern of survival rates in Wyoming and avoid variation in individual years, R&P used all records since fourth quarter 1992 (1992Q4) that met the specific requirement for each survival rate.
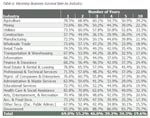 |
Statewide, more than two-thirds (69.0%) of all new firms survived one year after opening and more than one-third (34.3%) were still active after five years (see Table 6). The survival rates get smaller as the years in business increase. Industries face different challenges in their operations and their survival rates could vary considerably. For example, among all private industries, 62.6% of new firms in health care & social assistance were still in business three years after opening, and only 36.1% in construction were still in operation. Construction showed the lowest survival rates across all different years. This may directly relate to the large portion of temporary projects such as roads, oil and gas pipelines, buildings, etc. Firms in agriculture had the second highest three-year survival rate (60.1%), followed by firms in utilities with 57.8% and real estate & rental & leasing with 57.0%. For the long term (10 years), firms in agriculture and utilities did the best, with more than one-third still active after 10 years in business.
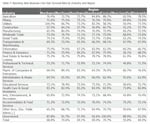 |
As mentioned previously, a firm’s location could be a very important factor to survivability. For example, 100% of firms in utilities survived one year in business in the northwest region, but only 58.3% survived one year in the central region (see Table 7). On the other hand, firms in Agriculture, construction, real estate & rental & leasing, and professional & technical services, showed the highest one-year survival rates in the central region compared with all other regions. Some industries had very similar one-year survival rates in all five regions of the state, such as health care & social assistance, ranging from 82.0% to 83.2%.
 |
New firms’ survival rates also vary largely by firm size. In general, larger sized firms had higher survival rates than the middle and small sized firms (see Figure 5). Firms started with only temporary employees showed the lowest survival rates. For example, larger sized firms showed 82.9% of them were still in business after one year opening and near half (48.2%) survived after three years, compared with the initial temp hiring firms with only near one-third (34.0%) survived after one year and 17.4% after three years. Larger firms may have prepared more sufficiently than other sized firms from the beginning and had stronger competition power.
Summary
New business formation in Wyoming has shown a continued upward growth for four years (2010 to 2013) from the trough year of 2009. However, the growth speed was much slower than the one after the previous downturn of 2002 to 2003. Construction, which has always been the leading industry in terms of new business formation in Wyoming, finally showed a notable upturn in 2013 after four years in a large decline. New business formation in mining dropped to the lowest level again in 2012 and 2013 after two years (2010 and 2011) of slow growth. Lower energy prices, lack of demand, and more environmental protection regulation are believed to be among the main reasons.
References
Bullard, D., and Brennan, N. (2014). Local jobs and payroll in Wyoming in fourth quarter 2013: modest job growth continues. Wyoming Labor Force Trends, 51(7). Retrieved November 20, 2014, from http://doe.state.wy.us/LMI/trends/0714/qcew.htm
Klein, K. E. (2014, February 13). Funding a new small business? Don’t bother with banks. Bloomberg Business. Retrieved from http://www.bloomberg.com/bw/articles/2014-02-13/funding-a-new-small-business-dont-bother-with-banks
Lynds, R., and Toner, R. (2014, February). Wyoming’s Oil and Gas Resource Summary Report. Retrieved November 21, 2014, from http://www.wsgs.wyo.gov/Public-Info/OnlinePubs/docs/Oil-and-Gas-Summary.pdf
McCarty, D., Elmquist, S., and Milford, P. (2014, July 25). Coal company pain accelerates as bankruptcy cases rise. Bloomberg Business. Retrieved October 27, 2014, from http://www.bloomberg.com/news/2014-07-24/coal-bankruptcies-loom-on-pain-from-cheap-gas-new-rules.html
Yu, S. (1995, June). New business formation: An economic development indicator. Wyoming Labor Force Trends, 32(6). Retrieved December 10, 2014, from http://doe.state.wy.us/LMI/0695/0695a1.htm
Yu, S. (1997, April). A study of Wyoming’s new business formation. Wyoming Labor Force Trends, 34(4). Retrieved October 22, 2014, from http://doe.state.wy.us/LMI/0497/0497a1.htm