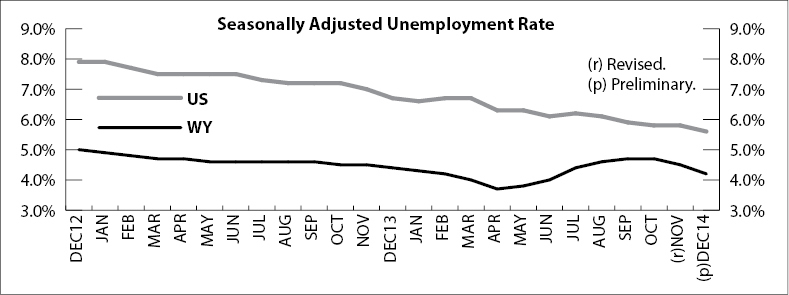
Wyoming Unemployment Rate Falls to 4.2% in December 2014
The Research & Planning section of the Wyoming Department of Workforce Services reported that the state’s seasonally adjusted1 unemployment rate fell significantly from 4.5% in November to 4.2% in December (the estimated number of unemployed individuals decreased by 928). Wyoming’s unemployment rate was marginally lower than its December 2013 level of 4.4% and significantly lower than the current U.S. unemployment rate of 5.6%. Seasonally adjusted employment of Wyoming residents increased slightly, rising by an estimated 815 individuals (0.3%) from November to December.
Most county unemployment rates changed very little from November to December. The one exception was Teton County, where the unemployment rate fell from 7.9% to 4.8% as the start of the winter tourist season boosted employment. Unemployment also fell in Weston (down from 3.9% to 3.5%), Niobrara (down from 3.3% to 3.0%), and Albany (down from 3.5% to 3.2%) counties. Slight increases in unemployment rates were seen in Crook (up from 3.7% to 4.1%), Johnson (up from 4.5% to 4.8%), Big Horn (up from 4.5% to 4.7%), and Sublette (up from 3.2% to 3.4%) counties.
From December 2013 to December 2014, unemployment rates fell in 20 counties, were unchanged in two counties, and increased in Sublette County (up from 3.2% to 3.4%). The largest decreases occurred in Teton (down from 6.4% to 4.8%), Platte (down from 5.1% to 4.0%), and Johnson (down from 5.7% to 4.8%) counties.
Converse County had the lowest unemployment rate in December (2.7%). It was followed by Campbell (2.8%), Niobrara (3.0%), and Albany (3.2%) counties. The highest unemployment rates were found in Fremont (5.3%), Lincoln (5.2%), and Park (5.0%) counties.
Total nonfarm employment (measured by place of work) rose from 290,000 in December 2013 to 294,300 in December 2014, a gain of 4,300 jobs (1.5%).
1Seasonal adjustment is a statistical procedure to remove the impact of normal regularly recurring events (such as weather, major holidays, and the opening and closing of schools) from economic time series to better understand changes in economic conditions from month to month.