Demographics and Earnings of Persons Working in Wyoming
by County, Industry, Age, & Gender, 2000-2018
Table of Contents | Introduction | Definitions | Home
Tables by Industry, County, Age, & Gender, 2000-2018 (Excel)
Published October 2019.
Changes in Wyoming’s Workforce Demographics: 2014-2018 -- Tables and Figures
by: Michael Moore, Editor
See article.
Originally published in the August 2019 issue of Wyoming Labor Force Trends.
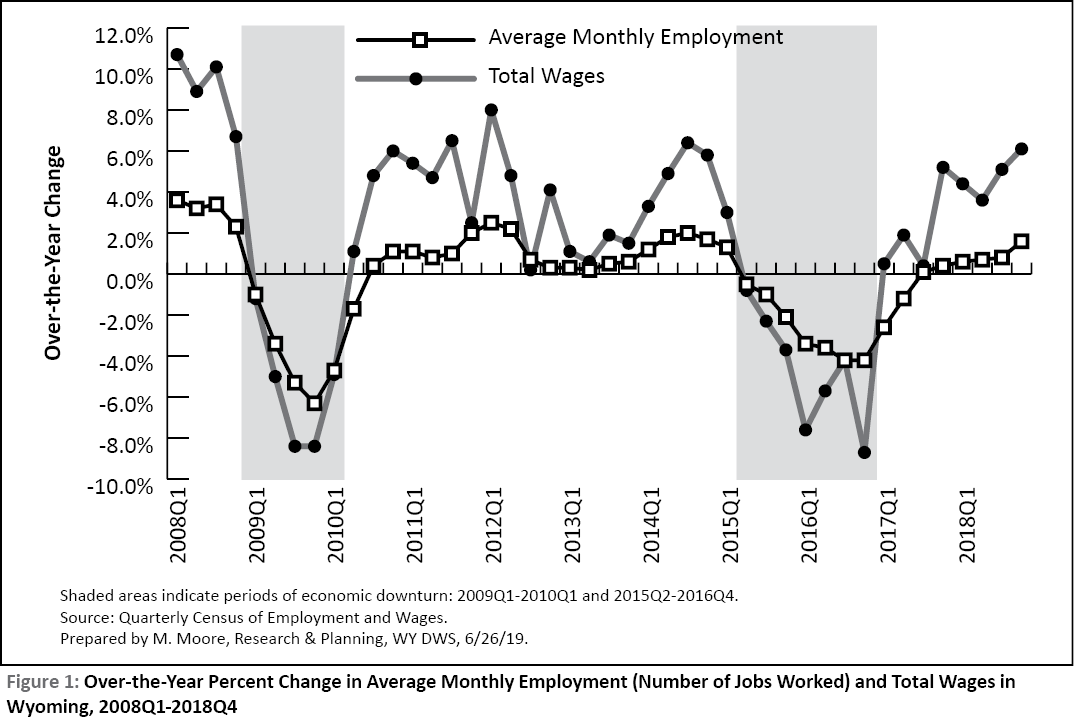
| Table 1: The Differences in Wyoming's Economic Downturns |
| Previous Economic Downturn |
Most Recent Economic Downturn |
|
|
|
|
- Collapse in energy prices
|
- Oil and natural gas prices fell; demand for coal dropped
|
- Began during national Great Recession
|
- Surrounding states saw job growth
|
- Other states lost jobs too
|
- People could go elsewhere for work
|
- Increase in population, labor force
|
- Decrease in population, labor force
|
- Large increase in Unemployment Insurance claims
|
- Moderate increase in Unemployment Insurance claims
|
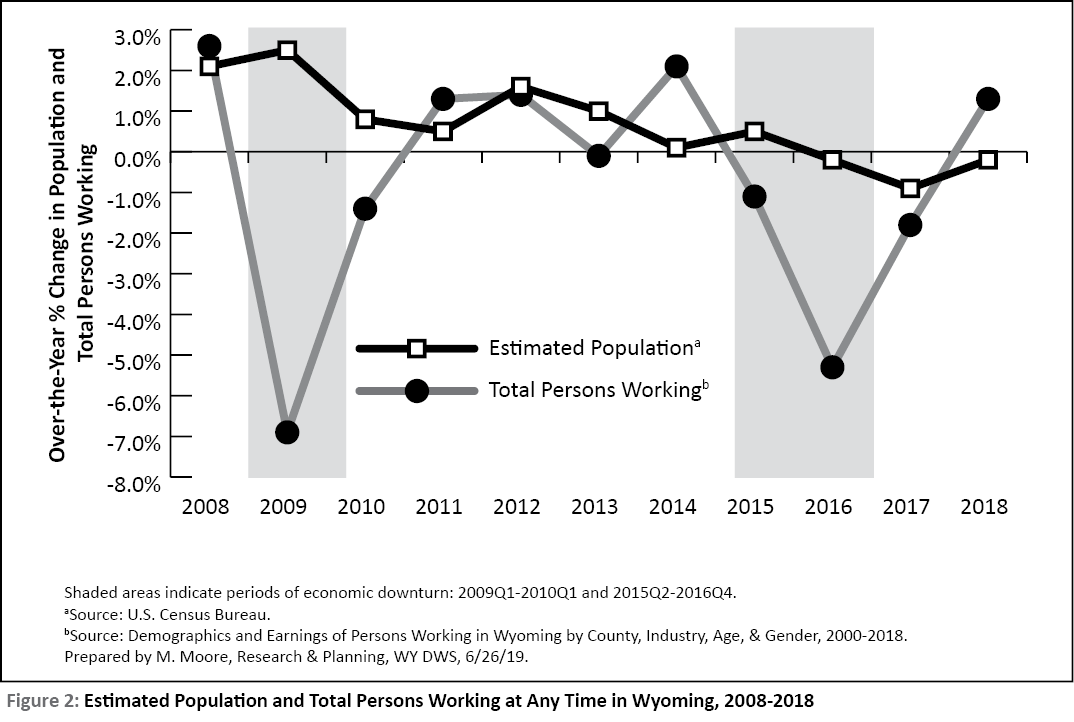
| Table 2: Estimated Population and Total Persons Working at Any Time in Wyoming, 2008-2018 |
|
Estimated Populationa |
Persons Working at Any Timeb |
|
|
Over-the-Year Change |
|
Over-the-Year Change |
| Year |
N |
N |
% |
N |
N |
% |
| 2008 |
546,043 |
11,167 |
2.1 |
383,446 |
9,769 |
2.6 |
| 2009 |
559,851 |
13,808 |
2.5 |
357,148 |
-26,298 |
-6.9 |
| 2010 |
564,483 |
4,632 |
0.8 |
352,152 |
-4,996 |
-1.4 |
| 2011 |
567,224 |
2,741 |
0.5 |
356,837 |
4,685 |
1.3 |
| 2012 |
576,270 |
9,046 |
1.6 |
361,887 |
5,050 |
1.4 |
| 2013 |
582,123 |
5,853 |
1 |
361,512 |
-375 |
-0.1 |
| 2014 |
582,548 |
425 |
0.1 |
368,939 |
7,427 |
2.1 |
| 2015 |
585,668 |
3,120 |
0.5 |
364,859 |
-4,080 |
-1.1 |
| 2016 |
584,290 |
-1,378 |
-0.2 |
345,669 |
-19,190 |
-5.3 |
| 2017 |
578,934 |
-5,356 |
-0.9 |
339,284 |
-6,385 |
-1.8 |
| 2018 |
577,737 |
-1,197 |
-0.2 |
343,836 |
4,552 |
1.3 |
| Change, 2014-2018 |
-4,811 |
-0.8 |
|
-25,103 |
-6.8 |
| aSource: U.S. Census Bureau. |
| bSource: Demographics and Earnings of Persons Working in Wyoming by County, Industry, Age, & Gender, 2000-2018. |
| Prepared by M. Moore, Research & Planning, WY DWS, 7/11/19. |
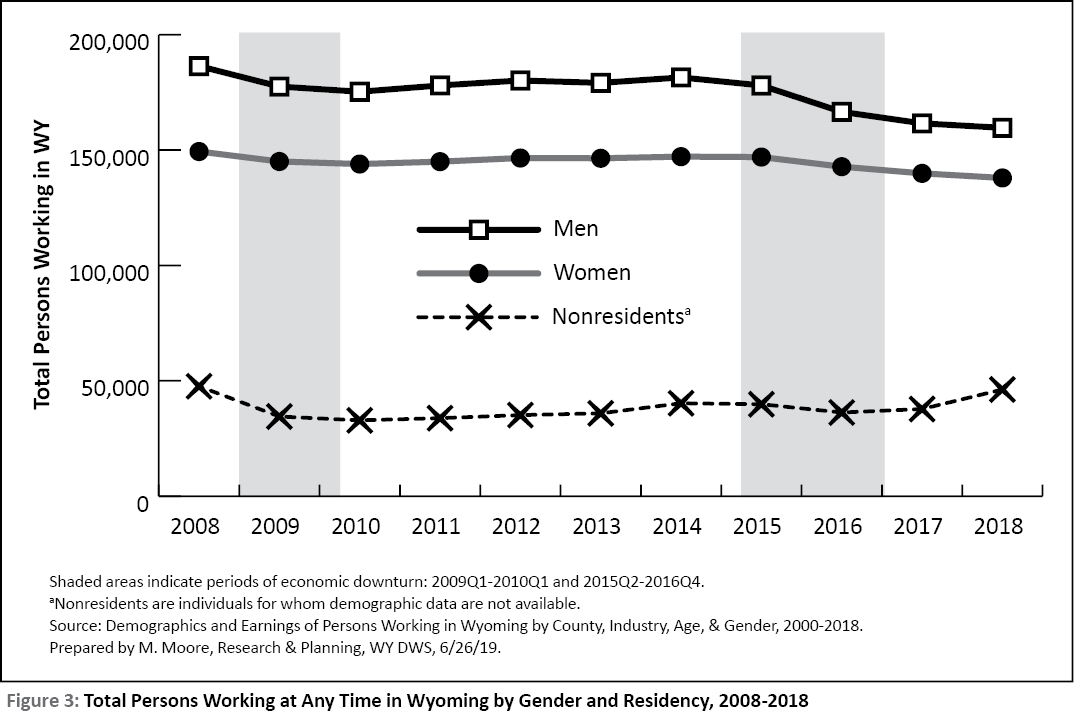
| Table 3: Total Persons Working in Wyoming at Any Time by Gender and Residence, 2008-2018 |
|
Women |
Men |
Nonresidentsa |
|
|
Over-the-Year Change |
|
Over-the-Year Change |
|
Over-the-Year Change |
| Year |
N |
N |
% |
N |
N |
% |
N |
N |
% |
| 2008 |
149,384 |
2,354 |
1.6 |
186,428 |
6,399 |
3.6 |
47,634 |
1,016 |
2.2 |
| 2009 |
145,069 |
-4,315 |
-2.9 |
177,552 |
-8,876 |
-4.8 |
34,527 |
-13,107 |
-27.5 |
| 2010 |
143,962 |
-1,107 |
-0.8 |
175,308 |
-2,244 |
-1.3 |
32,882 |
-1,645 |
-4.8 |
| 2011 |
144,998 |
1,036 |
0.7 |
178,029 |
2,721 |
1.6 |
33,810 |
928 |
2.8 |
| 2012 |
146,568 |
1,570 |
1.1 |
180,178 |
2,149 |
1.2 |
35,141 |
1,331 |
3.9 |
| 2013 |
146,459 |
-109 |
-0.1 |
179,141 |
-1037 |
-0.6 |
35,912 |
771 |
2.2 |
| 2014 |
147,169 |
710 |
0.5 |
181,502 |
2361 |
1.3 |
40,268 |
4356 |
12.1 |
| 2015 |
146,982 |
-187 |
-0.1 |
178,024 |
-3478 |
-1.9 |
39,853 |
-415 |
-1.0 |
| 2016 |
142,819 |
-4,163 |
-2.8 |
166,579 |
-11,445 |
-6.4 |
36,271 |
-3,582 |
-9.0 |
| 2017 |
139,917 |
-2,902 |
-2.0 |
161,600 |
-4,979 |
-3.0 |
37,767 |
1,496 |
4.1 |
| 2018 |
137,942 |
-1,975 |
-1.4 |
159,654 |
-1,946 |
-1.2 |
46,240 |
8,473 |
22.4 |
| Change, 2014-2018 |
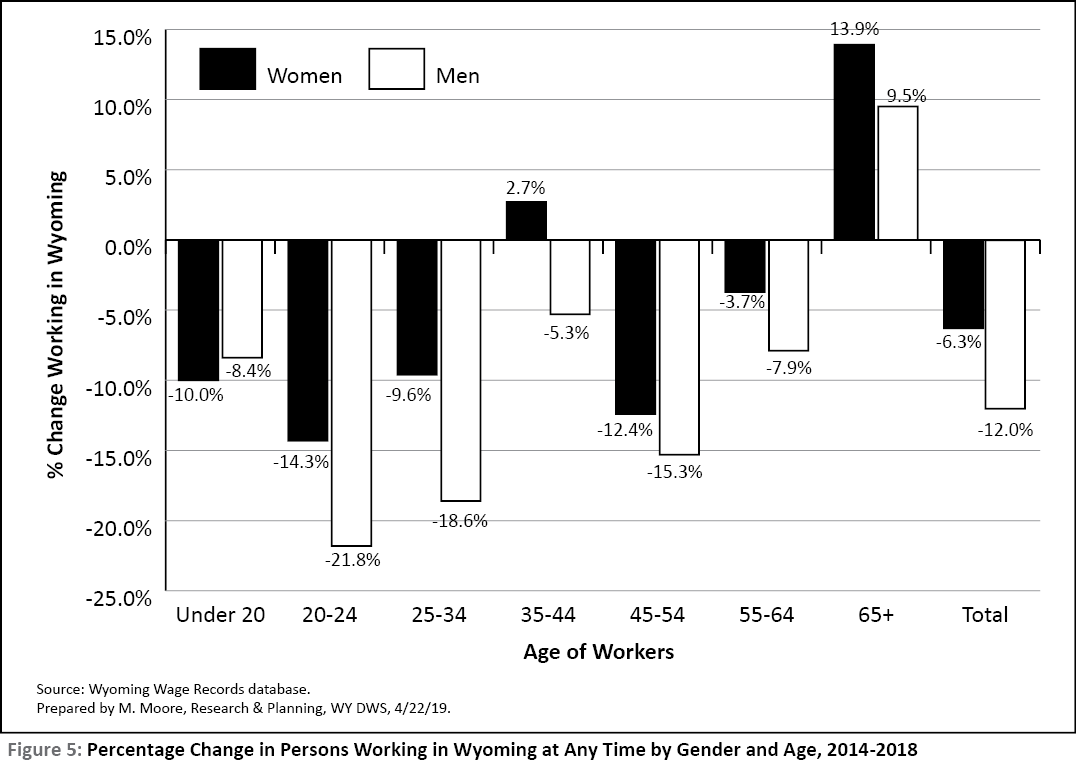
-9,227 |
-6.3 |
|
-21,848 |
-12.0 |
|
5,972 |
14.8 |
| aNonresidents are individuals for whom demographic data are not available, primarily individuals who commute to Wyoming for work from another state, or are short-term labor working for companies outside of Wyoming. |
| Source: Demographics and Earnings of Persons Working in Wyoming by County, Industry, Age, & Gender, 2000-2018. |
| Prepared by M. Moore, Research & Planning, WY DWS, 7/11/19. |
| Table 4: Total Persons Working in Wyoming at Any Time by Selected Generation, 2014-2018 |
|
2014 |
2018 |
Change, 2014-2018 |
| Generationa |
Age |
N |
% |
Age |
N |
% |
N |
% |
| Baby Boomers |
50-68 |
92,945 |
25.2 |
54-72 |
69,783 |
20.3 |
-23,162 |
-24.9 |
| Generation X |
34-49 |
96,956 |
26.3 |
38-53 |
86,397 |
25.1 |
-10,559 |
-10.9 |
| Millennials |
18-33 |
119,909 |
32.5 |
22-37 |
104,309 |
30.3 |
-15,600 |
-13.0 |
| Other Generations |
<18,
>68 |
18,373 |
5.0 |
<22,
>72 |
36,717 |
10.7 |
18,344 |
99.8 |
| Total WY Residents |
|
328,183 |
89.0 |
|
297,206 |
86.4 |
-30,977 |
-9.4 |
| Nonresidentsb |
|
40,756 |
11.0 |
|
46,630 |
13.6 |
5,874 |
14.4 |
| Total |
|
368,939 |
100.0 |
|
343,836 |
100.0 |
-25,103 |
-6.8 |
| aGenerations defined by Pew Research Center, 2015. |
| bNonresidents are individuals for whom demographic data are not available. |
| Source: Demographics and Earnings of Persons Working in Wyoming by County, Industry, Age, & Gender, 2000-2018. |
| Prepared by M. Moore, Research & Planning, WY DWS, 7/11/19. |
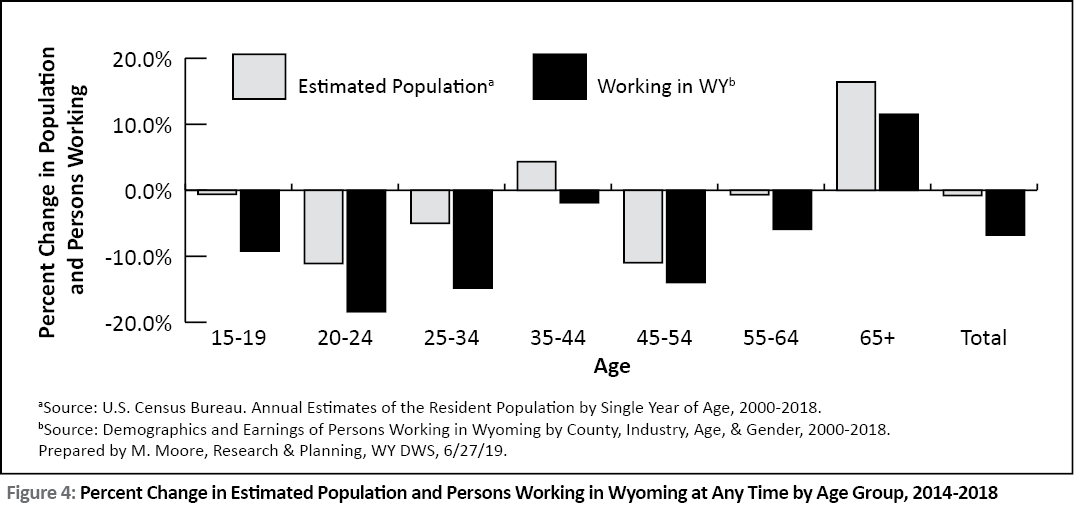
| Table 5: Wyoming Estimated Population and Number of Persons Working at Any Time by Age, 2014-2018 |
| Estimated Populationa |
|
|
|
Change, 2014-2018 |
| Age |
2014 |
2018 |
N |
% |
| <15 |
116,407 |
112,863 |
-3,544 |
-3 |
| 15-19 |
36,542 |
36,313 |
-229 |
-0.6 |
| 20-24 |
42,683 |
37,966 |
-4,717 |
-11.1 |
| 25-34 |
81,909 |
77,778 |
-4,131 |
-5 |
| 35-44 |
69,724 |
72,713 |
2,989 |
4.3 |
| 45-54 |
72,889 |
64,880 |
-8,009 |
-11 |
| 55-64 |
80,450 |
79,849 |
-601 |
-0.7 |
| 65+ |
81,944 |
95,375 |
13,431 |
16.4 |
| Total |
582,548 |
577,737 |
-4,811 |
-0.8 |
|
|
|
|
|
| Number of Persons Workingb |
|
|
|
Change, 2014-2018 |
| Age |
2014 |
2018 |
N |
% |
| 00-19 |
21,979 |
19,956 |
-2,023 |
-9.2 |
| 20-24 |
37,654 |
30,737 |
-6,917 |
-18.4 |
| 25-34 |
77,693 |
66,210 |
-11,483 |
-14.8 |
| 35-44 |
62,189 |
61,026 |
-1,163 |
-1.9 |
| 45-54 |
58,778 |
50,554 |
-8,224 |
-14 |
| 55-64 |
52,731 |
49,595 |
-3,136 |
-5.9 |
| 65+ |
17,159 |
19,128 |
1,969 |
11.5 |
| Nonresidentsc |
40,756 |
46,630 |
5,874 |
14.4 |
| Total |
368,939 |
343,836 |
-25,103 |
-6.8 |
| aSource: U.S. Census Bureau. |
| bSource: Demographics and Earnings of Persons Working in Wyoming by County, Industry, Age, & Gender, 2000-2018. |
| cNonresidents are individuals for whom demographic data are not available. |
| Prepared by M. Moore, Research & Planning, WY DWS, 7/11/19. |

 Wyoming at Work