Economic Indicators
by: Margaret Hiatt, Administrative/Survey Support Specialist
The consumer price index for transportation increased by 7.1% from February 2010 to February 2011, possibly reflecting the impact of higher gasoline prices.
|
|
|
|
Feb |
Jan |
Feb |
Percent Change |
|
|
|
|
2011 |
2011 |
2010 |
Month |
Year |
|
|
|
|
______(p)_ |
______(r)_ |
_____(b)_ |
_____ |
_____ |
| Wyoming Total Civilian Labor Force1 |
|
288,743 |
288,127 |
292,699 |
0.2 |
-1.4 |
|
|
Unemployed |
|
20,115 |
21,240 |
24,061 |
-5.3 |
-16.4 |
|
|
Employed |
|
268,628 |
266,887 |
268,638 |
0.7 |
0.0 |
| Wyoming Unemployment Rate/Seas. Adj. |
|
7.0%/6.2% |
7.4%/6.3% |
8.2%/7.5% |
N/A |
N/A |
| U.S. Unemployment Rate/Seas. Adj. |
|
9.5%/8.9% |
9.8%/9.0% |
10.4%/9.7% |
N/A |
N/A |
| U.S. Multiple Jobholders |
|
6,882,000 |
6,621,000 |
7,161,000 |
3.9 |
-3.9 |
|
As a percent of all workers |
|
5.0% |
4.8% |
5.2% |
N/A |
N/A |
| U.S. Discouraged Workers |
|
1,020,000 |
993,000 |
1,204,000 |
2.7 |
-15.3 |
| U.S. Part Time for Economic Reasons |
|
8,749,000 |
9,187,000 |
9,282,000 |
-4.8 |
-5.7 |
|
|
|
|
|
|
|
|
|
| Hours & Earnings for Production Workers |
| Wyoming Manufacturing Hours & Earnings |
|
|
|
|
|
|
|
Average Weekly Earnings |
|
$843.09 |
$850.91 |
$824.18 |
-0.9 |
2.3 |
|
Average Weekly Hours |
|
39.9 |
40.5 |
40.5 |
-1.5 |
-1.5 |
| U.S. Manufacturing Hours & Earnings |
|
|
|
|
|
|
|
Average Weekly Earnings |
|
$775.46 |
$773.98 |
$739.60 |
0.2 |
4.8 |
|
Average Weekly Hours |
|
40.9 |
40.8 |
40.0 |
0.2 |
2.3 |
|
|
|
|
|
|
|
|
|
| Wyoming
Unemployment Insurance |
|
Weeks Compensated 2 |
|
33,421 |
32,494 |
44,526 |
2.9 |
-24.9 |
|
Benefits Paid |
|
$10,682,167 |
$10,395,251 |
$14,975,761 |
2.8 |
-28.7 |
|
Average Weekly Benefit Payment |
|
$319.62 |
$319.91 |
$336.34 |
-0.1 |
-5.0 |
|
State Insured Covered Jobs (1) |
|
251,656 |
251,620 |
249,068 |
0.0 |
1.0 |
|
Insured Unemployment Rate |
|
3.4% |
3.4% |
4.7% |
N/A |
N/A |
|
|
|
|
|
|
|
|
|
| Consumer Price Index (U) for All U.S. Urban
Consumers |
| (1982 to 1984 = 100) |
|
|
|
|
|
|
|
All Items |
|
221.3 |
220.2 |
216.7 |
0.5 |
2.1 |
|
|
Food & Beverages |
|
224.0 |
223.2 |
219.1 |
0.4 |
2.2 |
|
|
Housing |
|
217.3 |
216.7 |
215.8 |
0.2 |
0.7 |
|
|
Apparel |
|
118.4 |
116.7 |
118.9 |
1.5 |
-0.4 |
|
|
Transportation |
|
203.0 |
200.8 |
189.6 |
1.1 |
7.1 |
|
|
Medical Care |
|
397.1 |
393.9 |
385.9 |
0.8 |
2.9 |
|
|
Recreation (Dec. 1997=100) |
|
113.2 |
112.6 |
113.3 |
0.5 |
-0.1 |
|
|
Education & Communication (Dec. 1997=100) |
|
130.7 |
130.7 |
129.1 |
0.0 |
1.2 |
|
|
Other Goods & Services |
|
385.4 |
384.7 |
378.0 |
0.2 |
2.0 |
|
|
|
|
|
|
|
|
|
| Producer Prices (1982 to 1984 = 100) |
|
All Commodities |
|
195.5 |
192.2 |
181.0 |
1.7 |
8.0 |
|
|
|
|
|
|
|
|
|
| Wyoming Building Permits (New Privately Owned
Housing Units Authorized) |
|
Total Units |
|
75 |
84 |
387 |
-10.7 |
-80.6 |
|
|
Valuation |
|
$13,045,000 |
$14,646,000 |
$37,408,000 |
-10.9 |
-65.1 |
|
Single Family Homes |
|
50 |
64 |
69 |
-21.9 |
-27.5 |
|
|
Valuation |
|
$11,125,000 |
$12,940,000 |
$13,174,000 |
-14.0 |
-15.6 |
|
Casper MSA2 Building Permits |
|
12 |
9 |
328 |
33.3 |
-96.3 |
|
|
Valuation |
|
$1,281,000 |
$1,349,000 |
$25,383,000 |
-5.0 |
-95.0 |
|
Cheyenne MSA Building Permits |
|
25 |
24 |
27 |
4.2 |
-7.4 |
|
|
Valuation |
|
$2,934,000 |
$2,938,000 |
$3,439,000 |
-0.1 |
-14.7 |
|
|
|
|
|
|
|
|
|
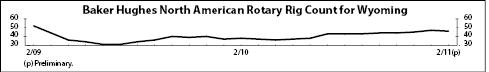
| Baker Hughes North American Rotary Rig Count
for Wyoming |
|
46 |
47 |
38 |
-2.1 |
21.1 |
|
|
|
|
|
|
|
|
|
|
|
|
|
|
|
|
|
|
(p) Preliminary. (r) Revised. (b) Benchmarked.
1 Local Area
Unemployment Statistics Program estimates. |
|
|
|
| 2 Metropolitan Statistical Area. |
|
|
|
|
|
|